The Effect of a Benevolent Mobile App on Brand
Consideration, and Enforcement Methods for
Improved Measurement.
ARCHIVES
by
Beneah Kombe Wekesa
l~f
_i_c:;." '''!JLGCC~]
L'UG
2
0
2015
-=--.,,"-'~
...
-S.B. Computer Science, M.I.T., 2012
Submitted to the Department of Electrical Engineering and Computer
Science
in partial fulfillment of the requirements for the degree of
Master of Engineering in Computer Science
at the
MASSACHUSETTS INSTITUTE OF TECHNOLOGY
February 2015
©
Massachusetts Institute of Technology 2015. All rights reserved.
I
j
ff
/}
Signature redacted
Author ... .
Department of Electrical Engineering and Computer Science
_1 A ~
January 14, 2015
certified by.
Signature redacted ___ ... .
David Austin Professor, Emeritus
I\
11 _Thesis Supervisor
/
Glen L. Urban
Signature redacted
Accepted by . . . .
. ... .
~
Albert R Meyer
Chairman, Department Committee on Graduate Theses
The Effect of a Benevolent Mobile App on Brand
Consideration, and Enforcement Methods for Improved
Measurement.
by
Beneah Kombe Wekesa
Submitted to the Department of Electrical Engineering and Computer Science on January 14, 2015, in partial fulfillment of the
requirements for the degree of
Master of Engineering in Computer Science
Abstract
This thesis covers two studies. The first study sets out to determine whether benev-olent apps are effective. Benevbenev-olent apps, are created to offer useful information to consumers or otherwise help them with decision-making, instead of attempting to generate sales or promote special deals. In this first study, I analyze the effect of a benevolent app on the brand consideration of the company that creates the benevo-lent app. Specifically, I build Android and iOS benevobenevo-lent apps for Suruga Bank, and evaluate Suruga’s brand consideration among the respondents both Pre and Post the app experience. I introduce several software enforcement to ensure that each respon-dent goes through the entire app experience. I detail the design and implementation of the experiment, from the software point of view, and present the significant re-sults from data analysis of a 1500-user data base. In this study, I demonstrate that benevolent apps are in fact more effective at improving brand consideration when compared to traditional media advertisements like magazines. The second study sets up enforcement and methodology for serving video in an upcoming study to evaluate the effect of story-telling on brand consideration.
Thesis Supervisor: Glen L. Urban Title: David Austin Professor, Emeritus
Acknowledgments
I would like to thank Prof. Urban for his constant guidance through my Masters program. It is hard to imagine a better thesis supervisor and research environment, where I was able to bring my Computer Science skills into an active area of marketing science research. Jeff, Renee, and the rest of the research group, many thanks. To Shigeto Takei and Kengo Suzuki, thanks for bringing a lot of industry perspective to the table. Special thanks to my big family for being there for me from half-way across the world in Kenya. I thank you Baba Mzee Wekesa Wesonga, Mayi Beatrice Nekesa, Faith Nasenya, Diana Natecho, Kristina Nasiloli, Alexander Wanjala, Oscar Baraka, and Joel Amittai for encouraging and motivating me these past 8 years. I specifically dedicate my current academic pursuits to two of my siblings; Victor Aura and Adrian Mbula, whose absence through this process was certainly not by their choice. To the Brueck-Smiths, the Miller-Littles and the Stollers, thanks for giving me a second home in Cleveland and checking on me when I went underground, as I did frequently. Not to forget the many friends. You are all the real MVPs.
Contents
1 Introduction and Background 13
1.1 Marketing Science . . . 14
1.2 Brand Consideration . . . 15
2 Methodology and Technological Goals 17 2.1 Market Research Methodology . . . 17
2.2 Technological Goals . . . 18
2.2.1 Serving the Stimuli . . . 18
2.2.2 Manipulations . . . 18
2.2.3 Enforcement . . . 19
2.2.4 Survey-Stimuli linkage . . . 19
3 Benevolent Applications 21 3.1 Previous Project: Liberty Mutual . . . 21
3.2 Current Project: Suruga Bank . . . 23
3.2.1 Motivation . . . 23
4 Suruga Project 25 4.1 Survey . . . 25
4.2 The Dream Move Application . . . 26
4.2.1 Enforcement . . . 28
4.2.2 Survey Integration . . . 29
5 Results and Challenges 31 5.1 Utility Codes . . . 31 5.2 Results . . . 31 5.3 Challenges . . . 35 6 Story-Telling 37 6.1 Motivation . . . 37 6.2 Survey . . . 38
7 Enforcement and Challenges 41
7.1 Enforcement . . . 41 7.2 Survey Integration . . . 45 7.3 Challenges . . . 46 8 Conclusion 47 8.1 Contributions . . . 47 8.2 Future Work . . . 48 A Source Code 51
List of Tables
5.1 Pre-Post Consideration across the 3 study cells . . . 32 5.2 Pre-Post Consideration against the 3 study cells and significant covariates 33 5.3 Pre-Post Consideration marginals for the 3 study cells and significant
covariates . . . 33 5.4 Pre-Post Consideration against the 3 study cells, significant covariates,
List of Figures
4-1 Dream Move: App entry experience . . . 27
4-2 Dream Move: App browsing experience . . . 27
4-3 Dream Move: App exit experience . . . 28
6-1 Stimuli website: Suruga website mock-up . . . 39
6-2 Stimuli website: Youtube mock-up . . . 40
6-3 Stimuli website: Control site . . . 40
7-1 Story-telling: Enforcement rules . . . 42
Chapter 1
Introduction and Background
In this thesis, I will detail the implementation of a benevolent application and discuss the results of evaluating the impact of the benevolent application on the publishing firm’s brand consideration in a study of 1500 participants in Japan by use of mar-keting science techniques. This study demonstrates that a benevolent application inspires a bigger change in a brand’s consideration among potential customers, as op-posed to traditional media advertisement (magazine in this study). I will also explain the methodology and implementation details for enforcement rules for the upcoming story-telling project.
The rest of this chapter introduces definitions that are relevant for the rest of this thesis.
Chapter 2 discusses research methodology applied in these studies, as well as the technological goals.
Chapter 3 introduces the benevolent apps project. It discusses a previous project, the current project and the motivation for it.
Chapter 4 details the Suruga benevolent apps study. It discusses the survey and explains the structure of Dream Move - the benevolent application used in the Su-ruga Bank project, the enforcement implemented in the application, and details the variables measured in the survey.
Chapter 5 gives the analysis of data collected in the Suruga project survey as well as the challenges faced.
Chapter 6 introduces the Suruga story-telling study. It details the motivation and objectives for the study as well as the experiment setup.
Chapter 7 covers the enforcement implementations for the story-telling project as well as challenges encountered over the course of the project.
Finally, Chapter 8 concludes by mentioning contributions and enumerating future work for each of the two studies in this thesis.
1.1 Marketing Science
Marketing, is defined by the American Marketing Association as:
The activity, set of institutions, and processes for creating, communicating, deliv-ering, and exchanging offerings that have value for customers, clients, partners, and society at large. [1]
The association defines marketing research as:
The function that links the consumer, customer, and public to the marketer through information–information used to identify and define marketing opportunities and prob-lems; generate, refine, and evaluate marketing actions; monitor marketing perfor-mance; and improve understanding of marketing as a process. Marketing research specifies the information required to address these issues, designs the method for col-lecting information, manages and implements the data collection process, analyzes the results, and communicates the findings and their implications. [1]
One method of conducting marketing research is the use of surveys. Surveys are a primary research or field research method, and are the the method adopted in conducting the marketing research done to complement the work done in this thesis. Respondents were provided a set of questions, then they were served the desired stimuli (on the web or through a mobile device), then they were provided with another set of questions. These pre-stimuli and post-stimuli questions were then used determine
1.2 Brand Consideration
Brand consideration, as used within the context of this thesis, is the probability of selecting a specific brand by a customer when faced with the need for a product or service that is provided by the brand. A consideration of 100% for instance means the respondent will absolutely choose the brand, while a consideration of 50% implies the respondent could toss a coin to make the decision.
Consideration for any brand is important: if your brand is not considered, you will not be evaluated by consumers in their information gathering activity (e.g. web, friends, media) and be placed in the purchase set of alternatives.
The pre-stimuli and post-stimuli questions in the surveys used in the studies specif-ically ensured to collect the before-and-after brand consideration measures for the specific companies that we were working with. The change in brand consideration was the independent variable we then adopted in our analysis of survey data.
Chapter 2
Methodology and Technological Goals
This chapter describes the market research methodology that was adopted in the benevolent apps study done with Suruga Bank, as well as the methodology set up for the Story-Telling study that is currently in the field.
2.1 Market Research Methodology
Good marketing research studies share multiple methodical best practices which are explained here-under [2]
• Pre and Post Measures Detailed and carefully crafted surveys are taken before and after the study. These surveys are designed to minimize biases and other methodological problems such as demand characteristics.
• Controlled Environment In order to establish causal results and not just correlations, study participants are exposed to the stimuli in as controlled an environment as possible.
• Pre-Test Group A specially picked group of initial subjects is selected and used to determine a baseline measurement for the study.
• Validation In order to ensure that users are engaged and not manipulating the survey, validation mechanism is built into the survey.
The following design and implementation characteristics apply to the benevolent apps and story-telling studies discussed in this thesis:
• Stimuli adaptation to pre-survey The studies had multiple stimuli, showed to respondents depending on the cell assigned to each respondent. The benev-olent app project for example had magazine stimuli and control stimuli in ad-dition to the app itself. The story-telling project has several video delivery avenues (e.g. business-to-consumer, consumer-to-consumer, etc) and a respon-dent only views one of these deliver channels. The surveys have to adapt the stimuli presented to the respondents based on their pre-survey respondents to ensure that the respondents for each cell are both relevant and as diverse as possible.
• Change in consideration These surveys both examined the effect of several parameters, under the influence of the served stimuli, on brand consideration.
2.2 Technological Goals
The following technological goals were central to the success of the experiments con-ducted.
2.2.1 Serving the Stimuli
A key part of these studies was serving stimuli to the respondent in between the pre-measures and the post-pre-measures. In the case of the benevolent application, a mobile application had to be built to serve the necessary stimuli to the survey respondents. In the case of the story-telling project, a website had to be built to serve the stories (presented as video stimuli) to the survey respondents.
2.2.2 Manipulations
Slight variations were necessary to ensure that different cells in the studies were served the correct stimuli, and to the correct effect. For example in the story-telling project,
the video was the same but the actual website that hosted the video differed from cell to cell: video served from the business to the consumer for example featured on a mock-up the business’s website, while video served from the consumer to another consumer featured on a mock-up of public video hosting sites like YoutubeTM, Google
Inc., Mountain View, USA or VimeoTM, Vimeo LLC, New York, USA.
2.2.3 Enforcement
For each study, steps had to be taken to;
i. Ensure that all the desired stimuli has been presented to the survey respondents. ii. Ensure that each survey respondent has spent a reasonable amount of time interacting with each of the stimuli that they are expected to observe in the study.
iii. Ensure each survey respondent completes the entire stimuli exercise.
iii. First warn, then disqualify respondents who do not adhere to the criteria in i., ii. & iii. above.
These requirements inspired several enforcement rules for each of the studies, which had to be tracked by software and added to the data profile for each respondent participating in the survey.
2.2.4 Survey-Stimuli linkage
Given that the respondents started with the survey, proceeded to the stimuli, then finished with the survey, infrastructure had to be set up to ensure a smooth survey-stimuli-survey transition. This infrastructure also had to pass critical information back and forth, for example the respondent’s survey ID and whether the respondent had violated the enforcement rules and been terminated or not.
Chapter 3
Benevolent Applications
Benevolent apps are smart-phone apps that build trust by providing consumers with with valuable information or assisting them in decision-making, without promoting special deals, coupons, or pushing any specific products. Such apps demonstrate that the publishing firm has the consumer’s interests as a paramount concern and advocates for their interests before the firm’s own corporate profit interests, and by so doing the benevolent apps build consumer trust in the publishing firm. [5]
One big part of the work carried out for this thesis evaluates the effect of a benevolent application on brand consideration for a bank (Suruga Bank). Previously, a similar study was carried out with an insurance company, Liberty Mutual, as the publishing firm. The next two subsections briefly talk about these two studies. The first subsection summarizes the previous Liberty Mutual study, the next subsection gives an overview of the Suruga study. This study was conducted as part of this thesis and is covered in more detail in Chapter 4
3.1 Previous Project: Liberty Mutual
The benevolent app used in this study, Liberty Mutual Dubble Wrap, was designed for people who are in the process of moving by providing them with two capabilities: 1. Liberty Safe where they can record (with text and photos) their valuable items
2. Box X-ray where they can record all items and their condition in each packing box as they move.
.
Liberty Mutual does not offer moving insurance, so this app was built to purely build trust through benevolence and increase brand image, consideration and purchase intent. In fact, at the end of the app, users could contact Liberty Mutual for more information about home, life and accident insurance. The app is benevolent, but there is a path to capture the goodwill generated by linking to the Liberty Mutual’s agents. If they do call Liberty Mutual, they already have their belongings catalogued on the app in the Liberty Safe. This makes the application process easier and reflects more closely the actual losses that might occur to the possessions of the renter or home owner.
The app was tested in a comprehensive market research study. 550 consumers in a controlled panel were exposed to the app and additional 200 people were used as a control sample. Overall, the Liberty Mutual moving app was seen as meaningful, believable, and relevant (over 4 Average Rating on 5 point scales). This favorable user experience was reflected in positive attitude changes toward Liberty Mutual. A very significant increase in the rating of trust occurred, backed up by increases in works hard to meet my needs, is more responsible, and in believability and confidence attributes. Responsibility and trust are key attributes of Liberty Mutual’s brand image.
In the base measures, probability of considering Liberty Mutual for insurance ( 1-10 scale) was 5.4, but after the use of the app, consideration was 6.7% or a significant increase of 1.3 rating points or a 24% increase relative to the pre measure (ratio of post to pre was 1.24). For those who would consider Liberty, the likelihood of purchase of homeowners/renter insurance went up significantly from 2.9 on a 5 point scale (1= very unlikely to 5 as very likely) to 3.3, or a significant 14% increase from the pre value (1.14 ratio of post to pre measure). Consideration went up and also likelihood of purchase went up for those who would consider Liberty, so the combined multiple is 1.41 (1.24 x 1.14) for a 41% potential increase in sales potential for those who used
the app. [5]
In the highly competitive insurance industry, preference for a company relative to competitors is important. We measured preference by having customers allocate 100 points between the leading firms they would consider. In the base measures, Liberty Mutual earned 9.2% of the preference points, but after use of the app, had 17% of the points: they almost doubled their preference share. And they took significant chunks out all of their rivals. The biggest gains were from rivals Geico, Progressive, and State Farm.
Liberty mutual used the results of this study to develop their overall mobile strat-egy, but they did not fully deploy this moving app, but rather they developed a similar home inventory app called Home Gallery. Interestingly, State Farm did release a similar moving application called Move Tools, which helps you create a task list for moving including organizing, inventorying (along with value), packing, and labeling your belongings, as well as coordinating logistics for the actual move. This recognizes the benefit of providing a benevolent app to improve brand perception.
3.2 Current Project: Suruga Bank
The Suruga Bank benevolent app project was very similar in structure to the Liberty Mutual project. The app developed in this case, Dream Move, provided savings and mortgage advice to people with varying move timeframes, from 6 months to over 20 years.
3.2.1 Motivation
Introduced at the beginning of this section, a benevolent application does not promote any product(s) or deals/coupons. Instead, the app simply provides consumers with valuable information for planning or decision-making purposes.
The objective of this study was to establish whether the consumer interprets such an app as an indication of the fact that the publishing firm has the consumer’s interests as a paramount concern, hence building the consumer’s trust in the firm that
published the benevolent app. The metric used to measure the consumer’s openness to using the publishing firm’s products and services is the firm’s brand consideration as introduced in Section 1.2
Chapter 4
Suruga Project
This section presents the Suruga benevolent application project that was conducted in the spring of 2014.
4.1 Survey
The survey was set up to handle three cells, with a targeted count of 500 respondents per cell:
Control cell This was the control group. This group was served with an article that was not relevant to banking/housing choices.
Magazine cellThis cell was provided with a magazine article from Suruga Bank, broadly talking about banking and housing. This cell was included for purposes of comparing the benevolent smart-phone app against traditional media advertisements like magazine advertisements.
Benevolent app cellThis cell got to interact with the Dream Move application, the benevolent app. This was the focus group for the study.
Pre and post measurements were collected for Suruga’s brand consideration before and after the stimuli treatment, and these values were then used to determine the per user change in consideration for the Suruga brand over the course of the study. This change in consideration is what we used as the independent variable in the data analysis that was conducted post-survey.
In addition to brand consideration, several other metrics were collected about each respondents which served as the covariates in the data analysis. These metrics included; the amount time the respondent has spent in their current house, the re-spondent’s highest education level, the rere-spondent’s income bracket, the rere-spondent’s intent to move within the next several years/months.
4.2 The Dream Move Application
Dream Move is an application that helps people to choose a new house, and gives them advice on their house selections based on their savings. The application also gives the users financial tips based on the mortgage that Suruga Bank can provide to them for the purchase/rental of their preferred houses.
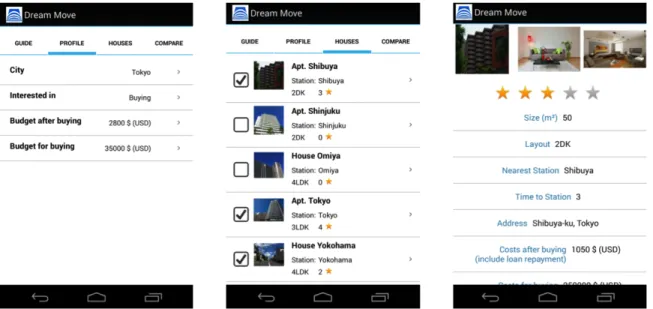
Dream Move was built for two platforms, Apple’s iOS and Google’s Android plat-forms. The application provided the benevolent application experience in the project’s survey for respondents allocated to the cell. Figures 4-1 to 4-3 demonstrate screen-shots of the application at various stages of user interaction.
i. Figure 4-1 illustrates the entry experience into the application. The user is presented with 3 pages of instructions about the purpose of the application and how it relates to the survey, then they can log in to the application using a pass-code that is provided only to the participants of the field study.
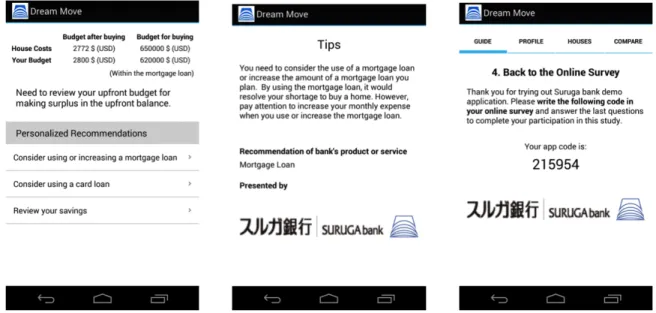
ii. Figure 4-2 illustrates the browsing experience within the application once the user has successfully provided the pass-code. The user can modify their prefer-ences, for example the city, whether they are looking to rent or to buy, and also how much they have in savings and monthly budget. The user can is then pre-sented with houses meeting his preferences and they can select/rate the houses they are interested in.
iii. Figure 4-3 snapshots the applications exit experience. The user is presented with a review of his choices and their affordability based on his financial position. For each choice, the user can view the personalized financial tips in case they decide
to buy/rent that house. These helpful tips are presented without attempting to sell any products from Suruga Bank. After this, the user is presented with a code that they input in the field survey to confirm participation in the study.
Figure 4-1: Dream Move: App entry experience
Figure 4-3: Dream Move: App exit experience
4.2.1 Enforcement
The enforcement for Dream Move was split into 3 tasks for each respondent. These tasks can be viewed in the second image in the app entry experience (Figure 4-1);
1. Set location, rent/buy interest, and budget.
2. Look at at least 3 houses in the selected location, and select at least 3 houses that you like.
3. View the financial advice for at least one of the three selected houses.
These tasks were considered enough to have taken the respondent through a suffi-cient portion of Dream Move’s benevolent app experience. To make the enforcement clear enough and guide the respondents through the application, the app browsing was organized into 4 tabs which can be viewed in Figure 4-2. The first tab was a dedicated guide which the respondent could always refer to if they forgot exactly what tasks they had to undertake. The next 3 tabs handled the above mentioned 3 enforce-ment tasks. To make the app browsing experience crystal clear, navigation into a tab was only allowed after completion of the task handled in the previous tab. In case this was not the case, the survey participant observed a pop-up message reminding them specifically what they had yet to complete in the previous tab.
4.2.2 Survey Integration
Respondents in the cell selected to view the Dream Move application were presented with two ways to download the benevolent application and view the stimuli. The first option was a URL which when input on their smartphone browser redirected to the application in either the iOS or Android application store. The second options was to scan a QR code which directly navigated the phone to the Dream Move page on the app store.
Once the respondent had the Dream Move application installed, the app provided clear instructions on the expected in-app interactions as well as the enforcement requirements. These have been mentioned in more detail in Section 4.2.1 above. The survey also provided a special 5 digit code which the respondents had correctly provide before they could start browsing the app. This was a simple constraint to stop any member of the general public from browsing the app - it was specifically built for this study.
For navigation back to the survey, respondents were advised to leave the survey open and return to it after completing the application experience. In order to proceed with the survey, the respondents had to provide a unique 6 digit number. This number was provided to respondents who completed the entire application experience without violating the requisite enforcement rules. This is visible in the last image in Figure 4-3 above in the app exit experience.
4.3 Database Setup and Data Collection
The data for this study was collected by Applied Marketing Science, Inc. (AMS), a leading market research and consulting firm with whom we partnered for the study. Data collection was set up to basically follow the survey questionnaire, keeping the same labels and ordering as in the survey questionnaire. At survey completion, AMS provided all the raw survey data from their database in a Microsoft Excel spreadsheet which we could sift and use on our end.
expe-rience, which was the most critical part of the study. Section 4.2.2 above covers the details of the stimuli-survey integration.
Chapter 5
Results and Challenges
This section covers the analysis of data collected in the Suruga benevolent application project conducted in spring 2014. Section 5.1 presents a few utility codes in python that were used to extract targeted data from the final survey data. Section 5.2 presents the actual experiment results.
5.1 Utility Codes
Given that Applied Marketing Science Inc. (AMS) returned the collected data in one Microsoft Excel file, it became quickly clear that some utility scripts would be necessary for purposes of working with the data. For this purpose, python was an easy choice because it is both easy and it has several libraries built for manipulating excel files e.g. openpyxl [3] and xlrd [4]. Appendix A.1 includes a sample of the codes used to swipe specific data from the final results spreadsheet. With slight modifications, a similar script could pull data meeting any other constraints from the spreadsheet.
5.2 Results
This analysis involved looking at the collected pre and post data for brand considera-tion and the co-variates. The statistical model used all the three cells (app, magazine, control) in the analysis.
Table 5.1: Pre-Post Consideration across the 3 study cells Variable Coefficient App 10.12 *** Magazine 4.20 ** Control 2.02 *** ⇤ ⇤ ⇤ = Significant at 1% ⇤⇤ = Significant at 5% ⇤ = Significant at 10%
The first analysis checked the behavior of the independent variable (the difference between post-consideration and pre-consideration) for the Suruga brand across the three different cells without any covariates. Consideration was calculated as a per-centage from 0 to 100. Results from all cells were significant, Table 5.1 shows the coefficients per cell.
Table 5.1 demonstrates that all treatment cells had significant effects on the change in Suruga’s brand consideration. The app cell showed a +10.12 change in consider-ation on the 100-point scale between pre and post measures (down to +8.1 after adjusting for the control effect of +2.02). The magazine cell similarly showed a +4.20 net effect on Suruga’s change in brand consideration (down to +2.18 after adjusting for the control effect). Without including any of the covariates, this result already shows that the benevolent app inspires a positive change in brand consideration of around 4-times what traditional advertising media (like magazines) can achieve.
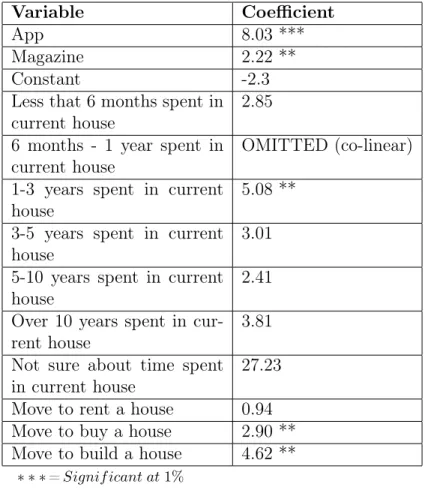
Next we carried out new regressions including the covariates and the the three experiment cells, still keeping the change in Suruga’s brand consideration as the independent variable. Table 5.2 shows the coefficients for the regression including the app cells and the significant covariates.
From these regressions we observed that the amount of time spent in the current house and the purpose of moving houses significantly affected the change in brand consideration. The full story of the interaction of these covariates with the experiment cells and the change in consideration is told by the marginals in table 5.3.
Table 5.2: Pre-Post Consideration against the 3 study cells and significant covariates
Variable Coefficient
App 8.03 ***
Magazine 2.22 **
Constant -2.3
Less that 6 months spent in
current house 2.85
6 months - 1 year spent in
current house OMITTED (co-linear)
1-3 years spent in current
house 5.08 **
3-5 years spent in current
house 3.01
5-10 years spent in current
house 2.41
Over 10 years spent in
cur-rent house 3.81
Not sure about time spent
in current house 27.23
Move to rent a house 0.94 Move to buy a house 2.90 ** Move to build a house 4.62 **
⇤ ⇤ ⇤ = Significant at 1% ⇤⇤ = Significant at 5% ⇤ = Significant at 10%
Table 5.3: Pre-Post Consideration marginals for the 3 study cells and significant covariates Cell 1-3 years in cur-rent house Move to
buy Move tobuild 1-3in currentyears house & to buy 1-3 years in current house & to build App 10.81 8.63 10.35 13.71 15.43 Magazine 5.01 2.83 4.55 7.91 9.63 Control 2.78 0.6 2.32 5.68 7.40
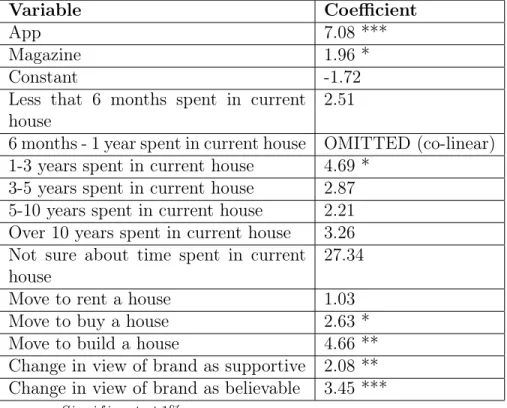
Table 5.4: Pre-Post Consideration against the 3 study cells, significant covariates, and significant attributes
Variable Coefficient
App 7.08 ***
Magazine 1.96 *
Constant -1.72
Less that 6 months spent in current
house 2.51
6 months - 1 year spent in current house OMITTED (co-linear) 1-3 years spent in current house 4.69 *
3-5 years spent in current house 2.87 5-10 years spent in current house 2.21 Over 10 years spent in current house 3.26 Not sure about time spent in current
house 27.34
Move to rent a house 1.03
Move to buy a house 2.63 *
Move to build a house 4.66 **
Change in view of brand as supportive 2.08 ** Change in view of brand as believable 3.45 ***
⇤ ⇤ ⇤ = Significant at 1% ⇤⇤ = Significant at 5% ⇤ = Significant at 10%
pre-stimuli and post-stimuli measures were also collected per survey participant. An interesting analysis would be a look at the change in consideration, across the three cells, with the change in these trust attributes as the dependent variables. Table 5.4 displays the significant covariates and the significant attributes.
These results show that across all cells, covariates, and attributes, the benevolent app has a more significant positive effect on the observed change in consideration of the Suruga brand, as compared to magazines (traditional media advertisement). Additionally, the change in view of the brand as both supportive and believable demonstrates a positive and significant effect.
5.3 Challenges
From a technical standpoint, this project offered minimal challenges.
Getting the Android application ready and publishing it was straightforward given that the Android SDK requires development in Java and the publishing process is almost instantaneous. Special care had to be taken to ensure that application sup-ported previous versions of the Android operating system (up to Android 2.2) because there are way too many Android phones running older OS versions, and survey re-spondents using those phones needed to be covered too. Fortunately this was a simple declaration in the app manifest file.
On the contrary, there was quite a bit of learning involved in getting the iOS app ready, and even moreso in getting the app published. Objective-C is not hard, but it has a learning curve which can give you a few sleepless nights if you are trying to get an app ready in 2 weeks.
Chapter 6
Story-Telling
This section presents the Suruga story-telling project, heading into soft-launch this winter and expected to go into the field in spring 2015.
6.1 Motivation
This project explores the possibility that presenting a product or service to a potential customer in a story could positively influence the customer’s consideration of brand which present’s its product or service in the story. In particular, this project seeks to investigate the effect of outlier stories, those stories that essentially attain the most narrative transportation on the receiver, on brand consideration. At this, the study will test the effect of story authorship on brand consideration. Among the authorship options include:
i. Business to consumer stories
ii. Consumer to business to consumer stories. iii. Consumer to consumer stories
6.2 Survey
This survey is currently set up to handle 7 cells (the same video will be used on all cells except the control group who will have an article to read):
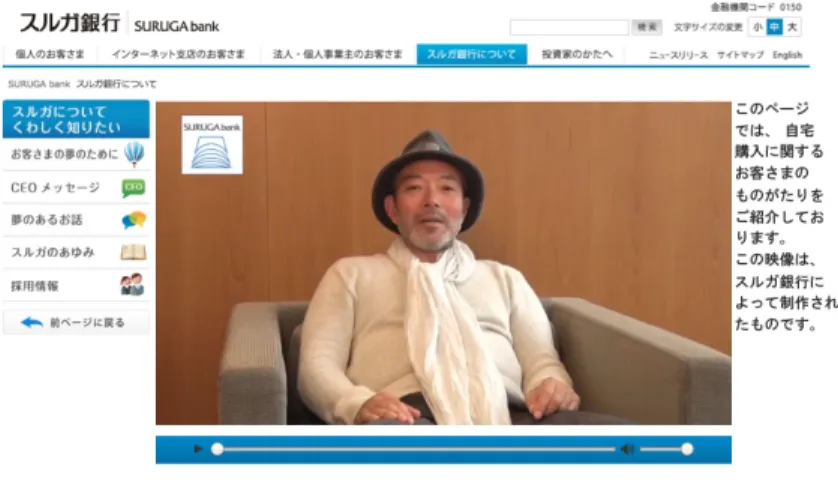
Suruga Brand to Consumer Story (Suruga B2C): This cell will view a video, produced by Suruga bank, and served on a mock-up of Suruga’s own website. This way it is clear that the video is produced by Suruga (the business) and intended to reach the consumers.
Suruga Consumer to Brand to Consumer Story (Suruga C2B2C): This cell will view a video, produced by a customer of Suruga Bank, and served on a mock-up of Suruga’s own website. This way it is clear that the video is produced by a customer (consumer) but intended to reach other consumers through the business (Suruga’s website).
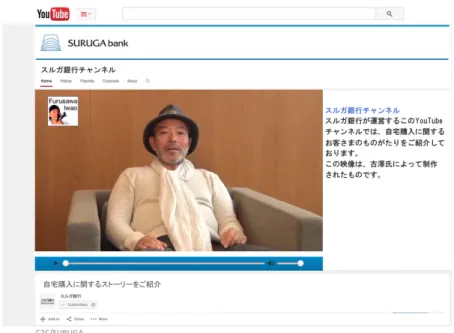
Suruga Consumer to Consumer Story (Suruga C2C): This cell will view a video, produced by a customer of Suruga bank, and served on a mock-up of Suruga’s YouTube channel. This way it is clear that the video is produced by a customer (con-sumer) who decided to share his/her story on Suruga’s public sharing site (YouTube channel).
Suruga Small-Brand to Consumer Story (Suruga b2C): This cell will view a video, produced by Suruga bank, and served on a mock-up of Suruga bank’s YouTube channel. This way it is clear that the video is produced by Suruga (the business) and intended to reach the consumers, not through the bank’s own website but through the public social video sharing site (YouTube) albeit through Suruga’s YouTube channel.
Housing Finance Channel Consumer to Consumer Story (HFC C2C): This cell will view a video, produced by a customer of Suruga bank, and served on a mock-up of Housing Finance Channel’s YouTube account page. This way it is clear that the video is produced by a customer (consumer) and intended to reach other consumers through a third-party public site (Housing Finance Channel’s YouTube channel).
Housing Finance Channel Small-Brand to Consumer Story (HFC b2C): This cell will view a video, produced by Suruga bank, and served on a mockup of Housing Finance Channel’s Youtube channel. This way it is clear that the video is produced by Suruga (the business) and intended to reach the consumers, not through the bank’s own website but through a third party public social video sharing site (Housing Finance Channel’s Youtube channel).
Control cell: This will be the control group. This group will not be served any video stimuli with a story. Instead they will be presented with an unrelated article to read.
Figures 6-1 - 6-3 demonstrate screenshots of the three essentially different versions of the stimuli-serving websites; those hosted on Suruga’s website, those on Youtube, and the control.
Figure 6-1: Stimuli website: Suruga website mock-up
Pre and post measurements will be collected for Suruga’s brand consideration before and after the stimuli treatment, and these values will then used to determine the per user change in consideration for the Suruga brand over the course of the study, in a way very similar to what was done in the Suruga benevolent apps project.
Figure 6-2: Stimuli website: Youtube mock-up
Chapter 7
Enforcement and Challenges
7.1 Enforcement
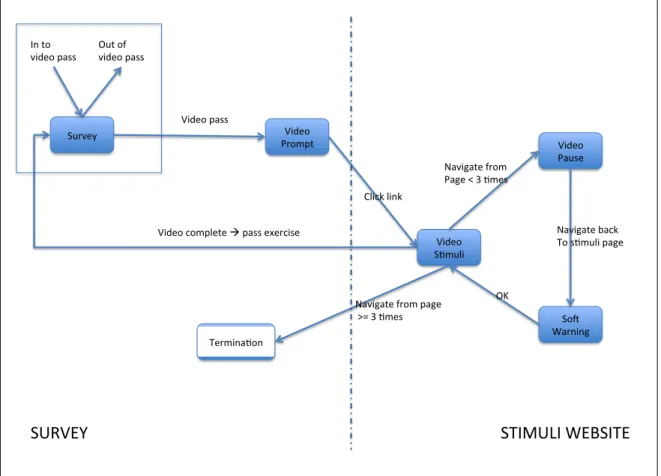
The validation requirements for this project revolved around ensuring that the respon-dents watched the entire video stimuli for their assigned cell, and that they watched it with minimal distractions to ensure normal encoding of the story. To attain this, we came up with the following enforcement rules;
• The amount of time spent by the respondent on the website is at least as long as the duration of the video stimuli, at least 30 seconds for the control site. • The video stimuli may not be fast-forwarded, but may be rewinded.
• To avoid distractions, the respondent may only be allowed to leave the stimuli website a maximum of 3 times, after which we can assume their encoding of the story is compromised and discontinue them from the survey.
Figure 7-1 displays the original enforcement rules.
For the control site, the only enforcement is in ensuring that the respondent spends at least 30 seconds on the site before navigating back to the survey. Navigation back to the survey is triggered by a button click, hence this enforcement can be completely implemented in Javascript using a code snippet similar to the one in Code 7.1.
Termina(on* Survey* Video* Pause* So3* Warning* Video* Prompt* Video* S(muli* Click*link* Video*pass* Video*complete*!*pass*exercise* OK* Navigate*back* To*s(muli*page* Navigate*from* Page*<*3*(mes* Navigate*from*page* *>=*3*(mes* Out*of* video*pass* In*to* video*pass* SURVEY* STIMULI*WEBSITE*
1 window.onload = function() {
2 // record the window load time (NB: in milliseconds) 3 var startTime = new Date();
4 var waitMessage = "You need to spend at least 30s on the site"; 5
6 // set the click event listener for the button
7 document.getElementById("returnToSurveyBtn").onclick = function() { 8 // Get the current time (milliseconds)
9 var currTime = new Date();
10 if ((currTime - startTime) < 30000) {
11 // Haven’t spent 30 seconds (30000ms) on the site ye 12 alert(waitMessage);
13 } else {
14 // call the function that navigates back to the survey
15 exitPage(); 16 } 17 } 18 19 function exitPage() { 20 window.location = "http://survey_address.com"; 21 } 22 }
Code 7.1: Control time check
For the video stimuli sites, there are a few more checks. The time constraint is instead implemented by a combination of
• Pausing the video on navigating away from the browser tab displaying the video • Disabling fast forwarding for the video
• Disabling fullscreen view for the video. This is important because a key part of the stimuli treatment is the presentation of the actual website on which the video is hosted. Recall, the same video is used in all cases. to achieve this, it is mandatory to implement custom controls for the HTML5 video view.
• Completing the video stimuli exercise and navigating back to the survey on completion of the video playback
Code 7.2 displays code snippet for handling navigation away from the browser tab. The video is paused on navigation away from the browser tab. On return to the browser, a warning is shown or the respondent is discontinued from the survey if they have exited more than thrice.
Code 7.3 shows an easy way to disable fast-forwarding on HTML5 video player by hooking an event-listener to the video player’s control’s seek bar and updating only for times less than the current time.
1 window.onload = function() {
2 var exitCount = 0; // tracking number of browser tab exits 3 function videoPlayerHandleVisibilityChange() {
4 var video = document.getElementById("video"); 5 if (document.body.className == "hidden") { 6 video.pause();
7 // increment exit count if playback is already on 8 if (video.currentTime > 0) {
9 exitCount += 1;
10 }
11 } else {
12 if (video.currentTime > 0) {
13 // You navigated away from the page after starting video 14 if (exitCount >= 3) {
15 terminateRespondent();
16 } else {
17 alert("The video was paused because you left the browser. You have now left the browser tab " + exitCount +" time(s).");
18 }
19 }
20 } 21 } 22
23 /* terminates respondent and redirects back to the survey */ 24 function terminateRespondent() {
25 } 26 }
Code 7.2: Handling browser navigation 1 window.onload = function() {
2 // Event listener for the seek bar
3 var seekBar = document.getElementById("video-seek-bar"); 4 seekBar.addEventListener("change", function() {
5 // Calculate the new time
6 var time = video.duration * (seekBar.value / 100); 7
8 // Update the video time only for rewind ! 9 if (time < video.currentTime) {
10 video.currentTime = time; 11 } else {
12 alert("Fast-forward is disabled for this video"); 13 }
14 }); 15 }
7.2 Survey Integration
Based on how much of each cell is covered, and on the respondent’s pre-survey ques-tions, the survey logic assigns respondents to a specific cell. Since each cell has its own stimuli-serving website hence its own unique URL, the survey simply redirects the respondents to the URL for the chosen stimuli. In order to identify the survey logic, the survey logic does also pass the respondent’s survey ID as a URL parameter while redirecting the respondent to the stimuli. Parsing the URL parameters can be done using a code snippet like Code 7.4 within Javascript’s window.onload regime
1 window.onload = function() { 2 var urlParams;
3 (window.onpopstate = function () { 4 var match,
5 pl = /\+/g, // Regex for replacing addition symbol with a space 6 search = /([^&=]+)=?([^&]*)/g, 7 decode = function (s) { 8 return decodeURIComponent(s.replace(pl, " ")); 9 }, 10 query = window.location.search.substring(1); 11 12 urlParams = {};
13 while (match = search.exec(query))
14 urlParams[decode(match[1])] = decode(match[2]); 15 })();
16 }
Code 7.4: Extracting URL params
The stimuli-hosting website has mechanisms described in Section 7.1 to ensure the enforcement rules are observed, and to terminate the respondents from the survey. On completion of the stimuli exercise (or on termination), the stimuli site redirects the respondent to the survey, and passses URL parameters for the respondent’s survey ID as well as an indicator for whether the respondent has been terminated or not. The navigation from the video hosting sites back to the survey happens automatically within 3 seconds of completion of the video or termination. Navigation from the control site is triggered by clicking the "Back to Survey" button at the bottom of the page.
Once back on the survey, non-terminated respondents proceed with the post-stimuli parts of the survey, to completion.
7.3 Challenges
This project is just going into the pre-test phase at the moment so a few more things may need to be changed before it actually goes to the field. As demonstrated in Chapter 6, all the development work was completed in html and Javascript, very easy languages to work with.
The biggest challenge probably came in implementing some aspects of the enforce-ment which were unfortunately limited by most browsers’ inter-tab security model. For example, it was desired to display a message when a survey participant clicked on another browser tab before completing the stimuli exercise, but this turned out to be essentially impossible. An easy work-around that adhered to browsers conventions was to display the message when the respondent returned to the tab.
Currently, the enforcement implementations assume that respondents will com-plete the survey in one session. This seems to be a reasonable assumption because closing the browser midway through the video exercise will result in termination from the survey. Suppose completion of the survey in multiple session be required later, it may be necessary to not only store session information in Javascript objects as is done now, but also in HTML5 localStorage. The session infor
Chapter 8
Conclusion
8.1 Contributions
In this thesis:
1. I have detailed the implementation of a benevolent application and discussed the results of evaluating the impact of the benevolent application on the pub-lishing firm’s brand consideration in a study of 1500 participants in Japan. The study demonstrates that a benevolent application inspires a bigger change in a brand’s consideration among potential customers, as opposed to traditional media advertisement (magazine in this study).
2. I have explained the implementation details of the websites that will serve stim-uli for the upcoming story-telling project, especially the enforcement rules and the resultant enforcement codes.
I discussed the challenges involved in implementation of the benevolent applica-tion, as well as in creating websites for the story-telling project and ensuring that enforcement rules are observed. Hopefully this information helps others conducting similar experiments. I have also littered code snippets, particularly in the section about enforcement in the story-telling project, with similar hopes.
8.2 Future Work
The Suruga project was the second project on benevolent apps after the Liberty Mutual project covered in Section 3.1. Suruga is a bank, and Liberty Mutual is an insurance company. It may be interesting to look at benevolent apps in another industry that is very different from banking and insurance industries, say the food industry. It may be the case that people attach different scoring metrics to food and health as opposed to money and banking, for example, and this could lead to stronger or weaker changes in brand consideration.
Another interesting follow-up to the benevolent apps project is a study of the apps that sit somewhere in the middle of the benevolence scale, they’re neither fully push apps nor fully benevolent apps. Figure 8-1 displays the area occupied by such apps.
Push%
Apps% Benevolent%Apps%
Increasing%benevolence% Interes6ng%apps%
for%next%studies%
The next steps for the story-telling project is a soft-launch, then field study and analysis of the collected data.
Appendix A
Source Code
A.1 openpyxl/xlrd example
1 #!/usr/bin/python 2 import sys
3 from openpyxl.workbook import Workbook 4 from openpyxl import load_workbook 5 import xlrd
6
7 if __name__ == "__main__":
8 workbook = load_workbook(filename = ’Suruga_Full_Raw_Data.xlsx’,
9 use_iterators = True) 10 headers_workbook = Workbook() 11 12 for ws in workbook.get_sheet_names(): 13 sheet = headers_workbook.create_sheet() 14 sheet.title = ws 15 16 sheets = workbook.get_sheet_names() 17 for x in range(len(sheets)): 18 headers = [] 19 i = 0
20 for row in workbook.get_sheet_by_name(sheets[x]).iter_rows(): 21 if i == 0:
22 for cell in row:
23 headers.append(cell.value) 24 else: 25 break 26 i += 1 27 headers_workbook.get_sheet_by_name(sheets[x]).append(headers) 28 29 headers_workbook.save(’Raw_Completes.xlsx’)
Bibliography
[1] American Marketing Association. Definition of Marketing, July 2013 (accessed January 5, 2015).
[2] Brandon Baker. High fidelity website research - using a browser extension to provide a natural environment. Master’s thesis, M.I.T., 2013.
[3] Eric Gazoni. openpyxl - A python library to read/write xlsx/xlsm files, January 2015.
[4] John Machin. xlrd - Library for developers to extract data from Microsoft Excel (tm) spreadsheet files, Accessed January 2015.
[5] Glen L. Urban and Fareena Sultan. The case for benevolent mobile apps. MIT Sloan Management review, 2014.