HAL Id: hal-02930808
https://hal.archives-ouvertes.fr/hal-02930808
Submitted on 4 Sep 2020
HAL is a multi-disciplinary open access
archive for the deposit and dissemination of
sci-entific research documents, whether they are
pub-lished or not. The documents may come from
teaching and research institutions in France or
abroad, or from public or private research centers.
L’archive ouverte pluridisciplinaire HAL, est
destinée au dépôt et à la diffusion de documents
scientifiques de niveau recherche, publiés ou non,
émanant des établissements d’enseignement et de
recherche français ou étrangers, des laboratoires
publics ou privés.
Carbon nanotubes accelerate acetoclastic
methanogenesis: From pure cultures to anaerobic soils
Leilei Xiao, Shiling Zheng, Eric Lichtfouse, Min Luo, Yang Tan, Fanghua Liu
To cite this version:
Leilei Xiao, Shiling Zheng, Eric Lichtfouse, Min Luo, Yang Tan, et al.. Carbon nanotubes accelerate
acetoclastic methanogenesis: From pure cultures to anaerobic soils. Soil Biology and Biochemistry,
Elsevier, 2020, 150, pp.107938. �10.1016/j.soilbio.2020.107938�. �hal-02930808�
https://doi.org/10.1016/j.soilbio.2020.107938
Carbon nanotubes accelerate acetoclastic methanogenesis: From pure
cultures to anaerobic soils
Leilei Xiao
a,e,f, Shiling Zheng
a,f, Eric Lichtfouse
c, Min Luo
d, Yang Tan
f, Fanghua Liu
a,b,e,f,*aKey Laboratory of Coastal Biology and Biological Resources Utilization, Yantai Institute of Coastal Zone Research, Chinese Academy of Sciences, Yantai, 264003, PR
China
bLaboratory for Marine Biology and Biotechnology, Qingdao National Laboratory for Marine Science and Technology, Qingdao, 266237, PR China
cAix-Marseille Univ, CNRS, IRD, INRAE, Coll France, CEREGE, Avenue Louis Philibert, Aix en Provence, 13100, France
dSchool of Environment and Resource, Fuzhou University, Fuzhou, 350116, PR China
eCenter for Ocean Mega-Science, Chinese Academy of Sciences, Qingdao, 266071, PR China
fCAS Key Laboratory of Coastal Environmental Processes and Ecological Remediation, Yantai Institute of Coastal Zone Research (YIC), Chinese Academy of Sciences
(CAS), Yantai, Shandong, 264003, PR China
A R T I C L E I N F O Keywords: Methane DIET-Independent methanogenesis Conductive material Acetoclastic methanogenesis Pure culture Proteome A B S T R A C T
Direct interspecies electron transfer (DIET) between electricigens and methanogens has been shown to favour CO2 reduction to produce biomethane. Furthermore, DIET is accelerated by conductive materials. However,
whether conductive materials can promote other methanogenic pathways is unclear due to a lack of detailed experimental data and the poor mechanistic studies. Here, we hypothesized that conductive carbon nanotubes (CNTs) stimulate acetoclastic methanogenesis independently of electricigens in pure cultures of Methanosarcina spp. and anaerobic wetland soil. We found a significant increase in the methane production rate during the growth phase, e.g. from 0.169 mM to 0.241 mM after addition of CNTs on the 3rd day. CNTs did not increase the abundance of electromicroorganisms or the electron transfer rate in anaerobic soils, using via microbial diversity and electrochemical analysis. 13C–CH3COOH labelling, stable carbon isotope fractionation and the CH3F
in-hibitor of acetoclastic methanogenesis were used to distinguish methanogenic pathways. CNTs mainly acceler-ated acetoclastic methanogenesis rather than CO2 reduction in both pure cultures and anaerobic soils.
Furthermore, the presence of CNTs slightly alleviate the inhibition of CH3F on acetoclastic methanogenesis
during the pure culture of Methanosarcina barkeri and Methanosarcina mazei with the production of more than 0.3 mM methane. CNTs closely attached to the cell surface were observed by transmission electron microscopy. Proteome analysis revealed a stimulation of protein synthesis with about twice the improvement involved in –COOH oxidation and electron transfer. Overall, our findings demonstrate that conducting CNTs favor methane production and that the mechanism involved is acetoclastic methanogenesis via acetate dismutation, at least partly, rather than classical CO2 reduction.
1. Introduction
Methane plays a crucial role globally as a greenhouse gas and a source of renewable fuel. Biomethane is typically produced by the cooperation of various microorganisms such as fermenting microor-ganisms and methanogenic archaea or methanogens (Liu et al., 2018; Zhu et al., 2018). Fermenting microorganisms are responsible for pro-ducing methanogenic substrates, such as acetate and CO2. Methanogens produce methane as the end-product of their anaerobic respiration to obtain energy. The common habitats of methanogens include sediments,
anaerobic soils, landfills and so on (Ji et al., 2018; Xiao et al., 2019a). 77.4% of the cultivated methanogens can reduce CO2, and the next most abundant type of metabolism is methylotrophic methanogenesis (Holmes and Smith, 2016). The acetoclastic methanogenic pathway is by far the least metabolism, only 12 species in two genera, namely, Methanosarcina and Methanosaeta (formerly known as Methanothrix), able to utilize acetate as a carbon and energy source (Holmes and Smith, 2016). Methanosarcina is a metabolically versatile methanogen with the ability to use CO2, acetate and methyl compounds to generate methane (Rother and Metcalf, 2004). For example, research published40 years
* Corresponding author. Yantai Institute of Coastal Zone Research, 17 Chunhui Road, Laishan District, Yantai, Shandong, 264003, China.
E-mail address: fhliu@yic.ac.cn (F. Liu).
Soil Biology and Biochemistry 150 (2020) 107938
https://doi.org/10.1016/j.soilbio.2020.107938
ago has confirmed acetate, methanol and CO2 as substrates for growth of Methanosarcina barkeri (Hutten et al., 1980).
Methylotrophic methanogenesis contributes a very small amount of methane accumulation (Conrad, 2005). Therefore, two other pathways mainly account for biomethane production: acetoclastic methanogenesis (Eq. (1)) and CO2 reduction, which contribute to approximately 2/3 and 1/3 of the global biomethane production, respectively (Conrad, 2005). CO2 reduction is performed either by hydrogenotrophic methanogenesis (Eq. (2)) or direct interspecies electron transfer (DIET, Eq. (3)). Acetoclastic methanogenesis: CH3COO− +
H+
→CH4 + CO2 (Eq. 1)
Hydrogenotrophic methanogenesis : 4H2 + CO2→CH4+2H2O (Eq. 2) DIET : 8H++
8e− +
CO2→CH4+2H2O (Eq. 3)
During acetoclastic methanogenesis, methanogenic archaea convert acetate into methane and CO2 by dismutation (Eq. (1)). Here, the acetate carboxyl group is oxidized to CO2 with the release of electrons (Li et al., 2006). Then, electrons are used to reduce CoM-S-S-CoB that transforms the acetate methyl to form methane. As a consequence, a complete acetoclastic methanogenesis has no net electron gains or losses. During hydrogenotrophic methanogenesis, CO2 is reduced by H2 (Eq. (2)). Specifically, CO2 is first reduced to methanofuran-CHO, and then, a series of intermediate metabolites are involved such as
methyl-tetrahydromethanopterin-HCO and
methyl-tetrahy-dromethanopterin-CH3 (H4MPT-CH3). From H4MPT-CH3 to methane, hydrogenotrophic methanogenesis and acetoclastic methanogenesis share the same route. DIET coupling exoelectrogenic bacteria and methanogens has been further proposed to explain methanogenesis in complex environments (Morita et al., 2011; Song et al., 2019; Xiao et al., 2019a,c). This coupling can be strengthened by the addition of conductive materials (Liu et al., 2012; Lu et al., 2020; Viggi et al., 2014; Xiao et al., 2018; Xiao et al., 2019b).
DIET coupled to CO2 reduction is the main mechanism referred to explain methane production. Nonetheless, this has been unequivocally demonstrated only in cocultures of Geobacter with Methanosaeta or Methanosarcina (Martins et al., 2018; Van Steendam et al., 2019). Interestingly, it is acetotrophic methanogens rather than hydro-genetrophic methanogens that can accept electrons to reduce CO2. In-sights into an alternative mechanism come from enhanced acetate dismutation by conductive materials (Fu et al., 2019; Li et al., 2018). For instance, Fu et al. (2019) disclosed that nano-Fe3O4 acted as an intra-cellular electron shuttle to accelerate acetoclastic methanogenesis by culturing M. barkeri with acetate as a carbon source. Whereas, redox cycling of Fe (II) and Fe (III) in nano-magnetite in the extracellular space accelerated acetoclastic methanogenesis by cultivating Methanosarcina mazei (Wang et al., 2020). These studies evidence the acceleration of acetate dismutation. However, the mechanism of increased acetoclastic methanogenesis is still poorly understood. Concerning iron ions may be used as nutrients to improve the activity and function of methanogens. Therefore, more work is needed to verify the benefits from conductivity. As human activities increase, more and more carbon nanomaterials end up into soils (Rai et al., 2018; Usman et al., 2020). Nano-magnetite has been found to accelerate methane production by acetate dismutation in pure culture. However, it is still unclear how conductive nanomaterials work to accelerate acetoclastic methanogenesis in multicommunity environments.
To accurately distinguish the source of methane, multiple techniques are necessary. CH3F is an inhibitor of acetoclastic methanogenesis, which is widely used to analyze the contribution of CO2 reduction and acetate dismutation (Conrad and Casper, 2010; Ji et al., 2018; Xiao et al. 2018). In brief, methane accumulation comes from both CO2 reduction and acetoclastic methanogenesis without CH3F. Whereas only CO2 reduction can contribute to methane production in the presence of CH3F. The difference between the two treatments thus reveals the contribution of acetoclastic methanogenesis. In addition to the use of
CH3F, stable isotope fractionation is a more precise and accurate method (Conrad, 2005). Although these methods are widely used to distinguish traditional methane production pathways, these methods are rarely used to study methane production influenced by electromicroorganisms and conductive materials (Xiao et al., 2020).
Here, we propose an alternative mechanism of acetoclastic meth-anogenesis involving electron transfer by conductive carbon materials and we explain the mechanism in depth. To test this hypothesis we studied methane production in pure cultures of M. barkeri, M. Mazei and in anaerobic soil containing carbon nanotubes (CNTs). The mechanisms were qualitatively and quantitatively assessed by 13C tracing, CH3F methanogenic inhibition, proteome analysis, thermodynamic analysis, electrochemical analysis, modelling and microscopy.
2. Materials and methods
2.1. Microorganisms and growth conditions for pure culture
Experiment 1: Mineral salt medium, as described elsewhere (Zehnder and Wuhrmann, 1977), was used to culture M. barkeri and M. mazei under strict anaerobic conditions with ~20 mmol L−1 acetate as the methanogenic substrate. In addition to H2, some components with reducibility, such as cysteine and Na2S, may act as electron donors to reduce CO2 to produce methane. In this study, the final concentration of cysteine was about 1 mM, and it was approximately 0.5 mM for Na2S. Therefore, two kinds of methanogenic substrates were provided including acetate and CO2. Anaerobic tubes (25 mL total volume, me-dium volume of 10 mL) were pressurized with a mixture of N2/CO2 (80%/20%). All incubations were conducted at 30 ◦C in the dark. In this study, carbon nanotubes were purchased from Macklin (Shanghai, China; CAS: 308068-56-6, Lot#:C10112635, Inner diameter: 5–10 nm, Outer diameter: 10–20 nm, Length: 500–2000 nm). No nanotubes was added in the control group, and the experimental group was added artificially. The final concentration of CNTs was ~0.2 g/L. According to visual observation, most of the CNTs were deposited on the bottom of the vials. The concentration of produced gases was tested using a gas chromatograph (GC; Agilent 7820A, USA) equipped with a flame ioni-zation detector (FID) and a thermal conductivity detector (TCD). A possible dissolution of methane in the medium can be neglected as fol-lows: in the vials with a headspace-to-medium ratio of 15 mL/10 mL, the percentage of methane in the gas phase (fg) is 97.9% at 30 ◦C is given by the equation fg=100%*KH1RT*
Vg Vw 1
KHRT*VwVg+1 (Stumm and Morgan, 1996),
where Vg and Vw are the volumes of the gaseous and aqueous phases, respectively, R is the ideal gas constant, and a value of 0.0013 mol L−1 atm−1 is used for Henry’s law constant, K
H. The column is a Hayesep Q 80–100 mesh (6 ft × 1.8〃 * 2.0 mm). High-pressure liquid chroma-tography (HPLC; Agilent 1260 Infinity) was used to test the acetate concentration.
Experiment 2: CH3F, an inhibitor of acetoclastic methanogenesis (Conrad, 2005), was applied to explore whether CNTs can improve the ability of M. barkeri to endure hostile environments. CH3F was applied at 1.5% v/v to replace the equal gas mixture (N2/CO2, 80%/20%) in the vials, other operations can refer to experiment 1.
2.2. Analysis of potential methane production pathways in pure culture systems with 13C labelling
Experiment 3: To clarify the methanogenic pathways for methane accumulation with and without CH3F, carbon isotopes of CH4 (13CH4/12CH4) were tested. CH4 collected from the headspace was tested to obtain the δ13C value using a gas chromatograph combustion isotope ratio mass spectrometer (GC–C–IRMS) system (Thermo Fisher MAT253, Germany). To eliminate the interference of original CO2, separation of CH4/CO2 was performed in a Finnigan Precon. In brief, mixed gas (~1 mL) was injected into a sample container (100 mL),
which was filled with helium gas (99.999% purity) beforehand. Helium loaded the mixture into a chemical trap, which can be applied to scrub CO2 and H2O. Then, CH4 can be oxidized in a combustion reactor at 960 ◦C and converted to CO
2 and water. After that, the combusted CO2 was subsequently purified by two liquid nitrogen cold traps with inter-nal filling of Ni wires and then transferred into the IRMS for determi-nation. The precision of repeated analyses was ±0.2‰ when 1.3 nmol methane was injected. The abundance of 13C in a sample is given relative to a standard using the δ notation:
δ13C = [(13 C 12C ) sample / (13 C 12C ) PDB − 1 ] ×1000.
where PDB refers to the Pee Dee Belemnite carbonate that is used as standard which has a 13C/12C ratio of 0.0112372.
Experiment 4: To test methane production pathway of M. barkeri and M. mazei in the presence of CH3F. Artificial abundance of 13CH3COOH (3% and 5%) was used in pure culture. The test of 13CH4/12CH4 was performed as described in Experiment 3.
2.3. LC-MS/MS based methanogen proteomics
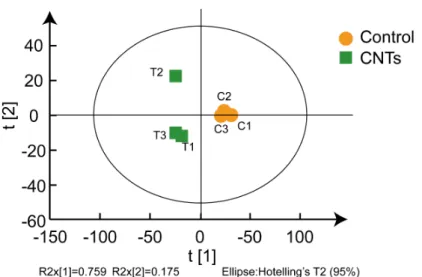
Experiment 5: Proteome analysis was used to determine how CNTs increased the competitiveness of the acetoclastic methanogenic pathway. M.barkeri cells were obtained following the operation of Experiment 1 and proteins of this archaea were analyzed by LC-MS/MS. Three replicates were conducted. Briefly, the total protein collected from each sample, sampled on the 25th day, was digested with trypsin and then the peptides were labelled using a 6-plex TMT reagent Multi-plex kit (Applied Biosystems, Foster City, CA) according to the manu-facturer’s protocol. A Triple TOF 6600 mass spectrometer (SCIEX, Concord, Ontario, Canada) was used to acquire the data. Based on PCA analysis of proteome data (Fig. S1), one of the repeats of the CNT group was not considered in the subsequent analysis. The detailed methods regarding protein extraction and digestion, TMT labelling, and LC-MS/ MS analysis can be found in the supporting information.
2.4. Microcosm cultivation and chemical analysis
Experiment 6: After intermittent flooding in October 2017, we sampled soil from the Yellow River Delta, which is a sensitive wetland with serious human intervention (Xiao et al., 2017). To prepare the slurry for the subsequent culture experiment, 150 g soils, 1.5 g dry ground straw of Phragmites australis, and 450 mL sterile water were added into a serum bottle with the total volume of 1000 mL. The detailed operation can be found in the supplementary materials. For the following experiments, vials with a volume of 11 mL were used to test the effect of CNTs on methane production in anaerobic soil. Three cycles of vacuum/charging high-purity N2 were conducted to create anaerobic vials. Then, 5 mL portions of the slurry were dispensed into each vial. Suspensions of 10 g/L CNTs in ultrapure water were N2 flushed and then sterilized. For treatment with CNTs, a CNT suspension (100 μL) was
added to each vial to reach a concentration of about 0.2 g/L. An equal amount of water was added to the vial of the control group. A 400 μL
acetate solution (0.275 M) was used as the substrate for methanogens with the final acetate concentration of approximately 20 mM. Overall, all treatments contained the same amount of upper space and slurry plus sterile water approximately 5.5 mL. Vials were sacrificed in triplicate to test the concentrations of acetate, methane, H2 and CO2 after a certain incubation period. A modified Gompertz model was used to quantita-tively analyze the production of methane with and without CNTs in anaerobic soils: P = Pmax∗exp { − exp [ Rmax∗e Pmax ∗(λ − t) + 1 ]}
where P is the methane concentration (mM) at time t, Pmax is the
maximum methane concentration (mM), t is the time (D), Rmax is the maximum methane production rate (mM D−1), λ is the lag phase (D), and e is 2.71828. The kinetic parameters of biomethane production are shown in Table S2.
CH3F was applied to inhibit the progress of direct acetate dis-mutation in anaerobic soil (Experiment 7). In addition to replacing the same amount of nitrogen with 1.5% CH3F gas, other operations can refer to experiment 6.
Experiment 8: In addition to using the methanogenic inhibitor to analyze the respective contribution of acetoclastic methanogenesis to total methane production, carbon stable isotope fractionation and the related calculations were conducted. Gases collected from the headspace were used to test the δ13C-values of methane and CO2. The test of the δ13C-values of methane can refer to Experiment 3. A similar method was used to test δ13C-values of CO
2. The chemical trap was replaced by a water trap. The α value can be calculated using the equation: α =
δ13CO2+1000
δ13CH4+1000. For the calculation of fma, the equation was used as follows,
fma =δmc−δ13CH4
δmc−δma .
2.5. Calculation of Gibbs free energy for hydrogenotrophic and acetoclastic methanogenesis
Experiment 9: The Gibbs free energy (ΔG) of hydrogenotrophic methanogenesis was calculated based on the concentrations of H2, CO2 and CH4 to analyze the potential contribution of different methanogenic pathways (Xiao et al., 2019b). Briefly, the following equation was used: ΔG = ΔG0+RT* { ln [ CCH4 ( CCO2* C 4 H2 ) ]}
with ΔG0, ΔG at 273.15 K and 101.325 kPa; R, the ideal gas constant, 8.3145 J mol−1⋅K−1; T, the absolute thermodynamic temperature, 303.15 K; CCH4,CCO2 and CH2: concentrations of methane, CO2, and H2,
mol⋅L−1. For the calculation of ΔG0, ΔG0
=ΔGf0 -ΔS*(Tf-T0), ΔGf0, ΔG under 298.15 K and 101.325 kPa; ΔS, entropy change at 298.15 K; Tf and T0, 298.15 K and 273.15 K, respectively. ΔGf0 =ΔH-Tf*ΔS, ΔH, enthalpy change at 298.15 K.
For the calculation of ΔG of acetoclastic methanogenesis, the following equation holds:
ΔG = ΔG0+RT ∗ { ln [ CCH4*CCO2 (Cacetate) ]} + 2.303* RT * NpH
The definitions of the parameters are given above, except Cacetate, the
acetate concentration, mol⋅L−1 and N
pH, the pH value of the supernatant.
2.6. 16S rRNA gene sequencing
Experiment 10: Bacterial (Bac515F and Bac926R) and archaeal (Arch519F and Arch915R) primers were used to perform amplification of the 16S rRNA gene. After six days of incubation, the anaerobic soil samples were collected for microbial diversity determination. Three repetitions were carried out. An Illumina Miseq platform was used for sequencing after the construction of the amplicon library. The OTU taxonomies (from phylum to species) were determined based on the NCBI database. The raw sequencing reads have been deposited in the NCBI SRA (accession numbers SRP151406 and SRP151407 for bacteria and archaea, respectively).
2.7. Statistical analysis
Data are presented as the mean ± standard deviation of triplicate cultures. All statistical analyses were performed using Origin 2016 (Origin Lab Corporation, USA) software. A t-test was used to analyze the significance level, and a p value of less than 0.05 was considered
statistically significant.
3. Results
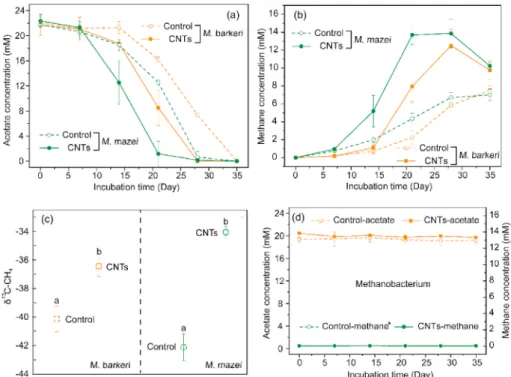
3.1. Effects of carbon nanotubes on methane production in pure cultures We performed pure cultures of Methanosarcina species to test whether CNTs could promote methane production via acetoclastic methanogenesis. Acetate consumption and methane production were accelerated by CNTs for both species (Fig. 1a and b). However, CNTs showed no significant stimulation of the hydrogenotrophic methanogen M. formicicum (Fig. 1d). The absolute δ13C values of the produced methane ranged from − 40.07 ± 0.90‰ to − 36.46 ± 0.66‰ for M. barkeri and from − 42.11 ± 0.93‰ to − 34.08 ± 0.40‰ for M. mazei (Fig. 1c). These values were in the range of that reported for acetoclastic methanogenesis in pure of Methanosaeta concilii, of − 30 to − 40‰ (Penning et al., 2006), thus supporting the occurrence of this pathway.
The δ13C differences between the control and CNTs provided several insights. First, they indicated the existence of at least two mechanisms, namely, CO2 reduction and acetate dismutation, since different mech-anisms usually have different 13C fractionation. Second, the highest δ13C values of − 34.08‰ and − 36.46‰ observed with CNTs implied that CNTs favoured acetate dismutation because CO2 reduction is expected to fractionate more and yield the more negative values (Conrad, 2005). We further compared the amount of methane produced in the experiments and theoretical calculations for acetate dismutation (Fig. S2). Calcula-tions were consistent with experimental data for CNTs but differed in the control assay. These findings revealed a contribution of acetate dis-mutation with CNTs. We also performed incubations with the hydro-genotrophic methanogen M. formicicum to check whether the acceleration of methane production was due to CNT chemical reactivity (Fig. 1d). The results showed the absence of acetate consumption and methane production, thus disclosing the CNTs cannot independently accelerate acetate dismutation. Overall, acetoclastic methanogenesis may be the mechanism explaining methane production with CNTs.
To strengthen the acetoclastic methanogenesis hypothesis we per-formed incubations of M. barkeri with CH3F and 13C-labelled acetate
(Fig. 2). Without CNTs, CH3F inhibited methanogenesis, as expected, as shown by the dotted green and orange bottom lines in Fig. 2a. This in-hibition in the control assay was also confirmed by the low 13C–CH4 abundance below 1.118%, typical of natural abundance, in the presence of highly 13C-labelled acetate (Fig. 2b). The minor methane production observed after 10 days was likely to be due to CO2 reduction. By sharp contrast, the addition of CNTs induced a rapid increase in methane emission after 6 days in the presence of CH3F, as shown by the solid green and orange lines down in Fig. 2a, and the emitted methane was highly 13C-labelled (Fig. 2b). During the incubation of M. barkeri with the addition of CNTs, however, the methane produced in the presence of CH3F (Fig. 2a) was only approximately 3% of that in the absence of CH3F (Fig. 1b), and the acetate was hardly consumed during the whole in-cubation with the addition of CH3F (Fig. 2b). Thus, CNTs could only slightly relieve the inhibition of acetate dismutation. Since this is a pure culture, interspecies electron transfer can be ruled out. These findings indicated the benefits of CNTs on methane production without the need for other electricigen species by promoting direct acetate dismutation (Eq. (1)).
M. barkeri and M. mazei produced methane through unexclusive acetoclastic methanogenesis even though 20 mM acetate was used as the substrate. Otherwise, the δ13C–CH4 should be the same, and the values may be even lower than − 30% (Penning et al., 2006). Supplemental to a previous study (Salvador et al., 2017; Wang et al., 2020), CO2 reduction may be involved in methane accumulation even though the substrate of M. barkeri and M. mazei was a high concentration of acetate.
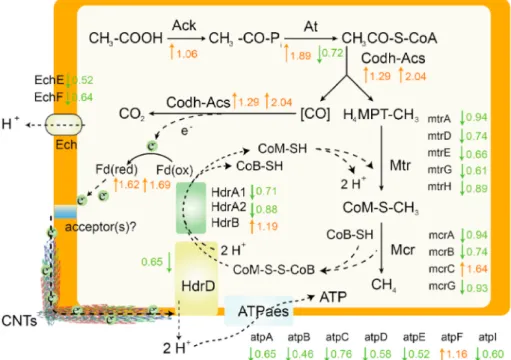
3.2. Proteome analysis
We analyzed the proteome of M. barkeri cultivated with and without CNTs to obtain information on the effect of CNTs on protein expression resulting in an increase in acetoclastic methanogenesis. The abundance of proteins that may be involved in acetoclastic methanogenesis is given in Table S1. The regulation of the expression of proteins and enzymes was modified by the addition of CNTs (Fig. 3). For instance, the en-zymes/proteins that control the oxidation of carboxyl groups, such as Ack and Codh-Acs, were highly up-regulated by 1.06 and 1.29 (orange
Fig. 1. Methanogenesis in pure cultures of Methanosarcina species on acetate substrate with carbon nanotubes (CNTs). a) Acetate concentration for M. barkeri and
M. mazei. b) Methane production for M. barkeri and M. mazei. c) δ13C in ‰ of CH
4 produced by M. barkeri and M. mazei. d) Acetate and methane concentrations in
arrows), thus showing that CNTs favoured acetoclastic methanogenesis. Moreover, the expression of ferredoxin (Fd) was highly increased by 1.62 and 1.69 for the two subunits of ferredoxin. By contrast, CNTs decreased the expression of proteins involved in methyl reduction, such as mcrB, and energy production, such as atpB. These results indicate the bypass of the classical cycle by CNTs. Overall, CNTs had some impact on the expression of proteins involved in acetoclastic methanogenesis, and suggest that CNTs may strengthen carboxyl oxidation and electron transfer.
3.3. Methane production in anaerobic soils amended with carbon nanotubes
We tested whether CNTs enhanced acetoclastic methanogenesis in complex microbial communities of anaerobic soils. The Pmax (maximum methane concentration) values of the control and CNT treatments were 0.297 ± 0.016 and 0.304 ± 0.011 mM, respectively. The lag phase of methane production (λ) was approximately 0.6 days in the vials without CNTs. In the presence of CNTs, λ decreased by approximately 28.3%, with a value of ~0.43 days. Furthermore, CNTs promoted methane production, resulting in an increase in Rmax with a value of 0.102 ± 0.010 mM D−1 compared to the control (0.087 ± 0.014 mM D−1).
For the kinetics of ΔG of these two pathways, values were always negative, suggesting that producing methane with acetate or CO2 as a substrate was feasible (Fig. 4b). The proportion of methane produced by the acetoclastic methanogenic pathway in total methane production remained relatively stable in the range of ~60%–~80% for both treat-ments (Fig. 4c). Direct acetate dismutation contributed more to the net accumulation of methane than did CO2 reduction (Fig. 4d). The pro-portion of this pathway reached its peak on the 3rd day. According to the results shown in Fig. 4e, methane yield occurred primarily due to enhancement of acetoclastic methanogenesis in anaerobic soil. 3.4. Impact of carbon nanotubes on carbon isotopic fractionation
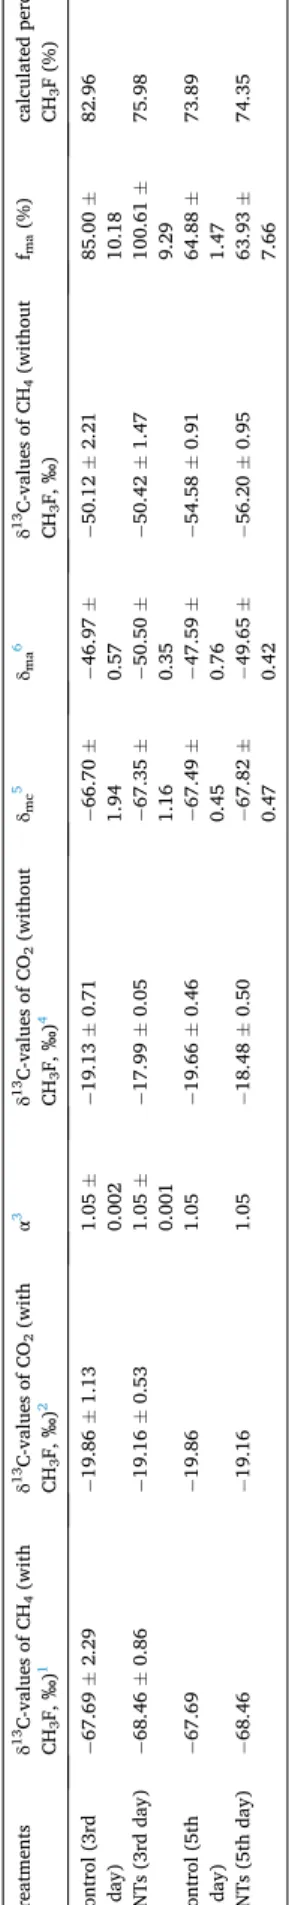
Methane was mainly derived from the reduction of CO2 in the case of the inhibition of acetoclastic methanogenesis, based on isotope results (Table 1). Combining the equations of hydrogenotrophic methano-genesis (Eq. (2)) and isotope fractionation of this reaction (αCO2/CH4 =
δ13CO2+1000
δ13CH4(CO2)+1000), both treatments held the same α value (~1.05). δmc,
which is the δ13C value of methane from CO2 reduction, was not influ-enced by CNTs. In contrast, CNTs changed the value of δma (p < 0.05), which is the δ13C value of methane from acetoclastic methanogenesis.
Fig. 3. Effect of carbon nanotubes (CNTs) on the expression of proteins and enzymes involved in acetoclastic methanogenesis. Up-regulation ratios (orange arrows)
and down regulation ratios (green arrows) were determined by proteome analysis of pure cultures of M. barkeri with and without CNTs. The orange border represents a cell membrane. (For interpretation of the references to colour in this figure legend, the reader is referred to the Web version of this article.)
Fig. 2. Concentration and 13C abundance of
pro-duced methane under artificial abundance of
13CH
3COOH with the presence of CH3F for all
treat-ments. 3% and 5% are 13C versus 12C for the Methyl
C. Methane production and acetate consumption by
M. barkeri under the conditions with CH3F (a). The
bottom four lines are the values of methane concen-trations, and the top four lines was the values of ac-etate concentrations. The 13C abundance of produced
methane (b), which were compared with VPDB (Vienna Peedee belemnite).
According to equation (δ13CH4= fmaδma+ (1 − fma)δmc), the per-centages of the contribution of the acetoclastic methanogenic pathway to the total methane under the two experimental conditions were approximately 85 ± 10.18% and 100 ± 9.29% on the 3rd day. The re-sults of the isotope calculations were basically consistent with the data shown in Fig. 4c. That is, carbon isotopic fractionation experiments show that almost all methane produced with acetate as a direct substrate and CNTs strengthened this pathway in anaerobic soil (Table 1). 3.5. Abundance of bacteria and methanogens responding to carbon nanotubes
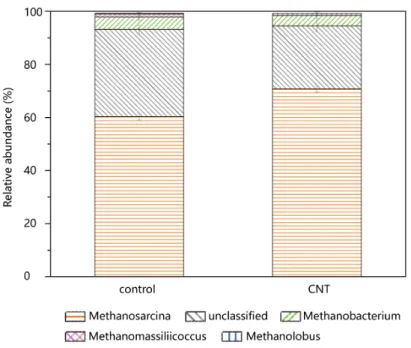
The known exoelectrogenic bacteria, such as Geobacter and Shewa-nella, did not benefit from the presence of CNTs with a p value of 0.21 (Fig. S3a). Methanosarcinaceae, which is the most metabolically ver-satile of the methanogenic archaea, had the highest abundance of methanogens in both treatments (Figs. S3b and S4). The abundance of this kind of methanogen in both treatments exceeded 60%. CNTs significantly increased Methanosarcinaceae abundance (p = 0.00053), indicating that methane may derive from the decomposition of acetate by Methanosarcinaceae in anaerobic soil.
4. Discussion
4.1. Carbon nanotubes contributed to an increase of acetoclastic methanogenesis in pure culture
This work highlights that CNTs were favorable to both M. barkeri and M. mazei (Figs. 1 and 2). The culture systems used was pure culture of methanogens. Therefore, there is no DIET process in which electroactive microorganisms generate electrons for methanogens. Very recently, a direct effect of conductive magnetite on pure culture of Methanosarcina spp rather than the promotion of DIET was proposed (Fu et al., 2019; Wang et al., 2020). But the study of Fu and colleagues did not show any positive function of CNTs on M. barkeri. Combining the experimental results of this study and previous research (Salvador et al., 2017), CNTs accelerating methane production in pure culture of acetotrophic methanogens looks reliable.
In the presence of CH3F, the slight consumption of acetate caused by
the addition of CNTs may be mainly due to the stronger acetoclastic methanogenesis (Fig. 2a). Based on the author’s knowledge of the physiological metabolism of M. barkeri, this kind of methanogenic archaea is basically incapable to oxidizing 13CH3COOH to produce 13CO2. Reported that a small percentage (2.3%) of 13CH3COOH can be converted into 13CO
2 through electron bifurcation when providing a high concentration of ferrihydrite. No ferric iron was added in our research, and additional reducing substances, cysteine and Na2S, were added into the medium. Therefore, it was less likely that methanogenic archaea oxidize acetate through electron bifurcation.
The amount of acetate consumed was approximately 0.01 mmol (Fig. 2a). If the consumed acetate was completely oxidized to CO2 (13CH3COOH→12CO2 +13CO2) without the occurrence of acetoclastic methanogenesis, 3% 13CO2 and 3% 12CO2 should be produced with 3% 13CH
3COOH as the substrate. Therefore, the molar amount of produced 13CO2 was about 3 × 10⁻⁷ mol. We determined the value of 13C/12C of CO2 in the originally mixed gas, which was approximately 1.088%. Fifteen millilitres of nitrogen and CO2 mixed gas (~20% CO2) was added to the upper space of the anaerobic tube, and the molar amount of 12CO2 was about 1.32 × 10⁻⁴ mol. Therefore, the ratio of 13CO
2/12CO2 should be approximately 0.227%. Additionally, 1 M CO2 can be converted into 1 M CH4. Correspondingly, the ratio of 13CH4/12CH4 should be about 0.227% as well. The measured value (~3%) was more than one order of magnitude of the theoretically calculated value. Therefore, this assumption seemed to be untenable (0.227% VS ~3%), not to mention that acetate was almost impossible to be completely oxidized without the occurrence of direct acetate dismutation. With 3% 13CH3COOH as the substrate, 3% 13CH4 and 3% 12CO2 should be produced through acetoclastic methanogenesis. The measured value was consistent with the theoretically calculated value. Conclusively, CNTs may promote methane production via direct acetate dismutation in the presence of CH3F.
4.2. Carbon nanotubes stimulated the synthesis of proteins involved in –COOH oxidation and electron transfer
The synthesis of formylmethanofuran dehydrogenase (Fwd), which is a vital enzyme for the generation of methane via CO2 reduction (Wagner et al., 2016), was significantly down-regulated (Supplementary
Fig. 4. Methane production in anaerobic soils. Effects
of carbon nanotubes (CNTs) on the kinetics of methane production (a). The corresponding ΔG values for CO2 reduction and direct acetate
dis-mutation (b). Methanogenic pathways revealed by CH3F inhibition experiments (c) and isotopic
frac-tionation experiments (e). The ratio of methane pro-duced from acetoclastic methanogenesis to the total amount of methane generated based on CH3F
inhi-bition experiments (d). Background values were ob-tained from a previous report (Whiticar, 1999). Orange: control; olive: treatments with CNTs. (For interpretation of the references to colour in this figure legend, the reader is referred to the Web version of this article.)
Table 2). Consequently, CNTs did not tend to strengthen the CO2 reduction pathway. Subdividing the acetate dismutation for methane production, two half-reactions constitute the overall process: electron donating half-reaction and electron accepting half-reaction (Bethke et al., 2011). In the presence of CNTs, the synthesis of proteins involved in the electron donating half-reaction was basically up-regulated (Fig. 3, Table S2). Producing more electrons also requires more electron me-diators to participate in transport, such as Fd (Kaster et al., 2011; Yan et al., 2017). However, the electron transfer process is not just Fd’s participation. For example, the transfer of electrons in the cell mem-brane may require methanophenazine (Abken et al., 1998). Under the premise that Fd provides more electrons, CNT-mediated electron transfer may accelerate the entire electron transfer chain.
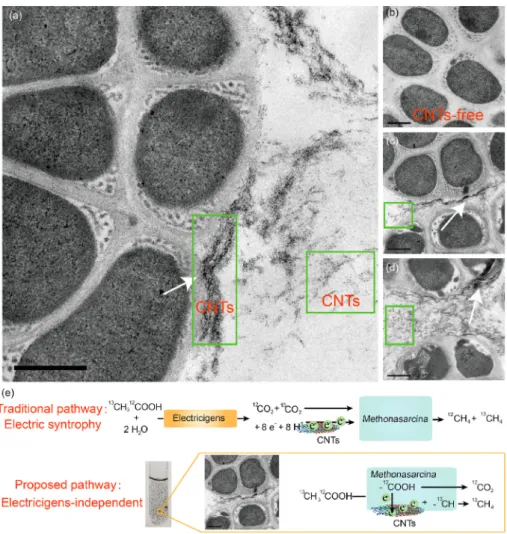
Some CNTs stuck tightly to the cell surface according to experi-mental results from transmission electron microscopy (Fig. 5a, c and d). Black nano-scale tubular material can be seen in the field of view. In contrast, no black materials can be found in the control (Fig. 5b). Conductive nano-Fe3O4 can replace the structure of cytochromatin-like proteins for transporting electrons (Liu et al., 2015). It is considering that CNTs exerted a function as protein and improved Methanosarcina pp. efficiency. Methanogenic archaea tended to reduce the synthesis of proteins involved in the electron accepting half-reaction (Fig. 3, Table S2). With a faster electron supply, the demand for so many en-zymes may be reduced. Decreasing the synthesis of protein can also reduce the energy requirement companied by the dwindling number of ATPase subunits (Fig. 3).
4.3. Carbon nanotubes benefited methane production independently of electroactive bacteria
In anaerobic soil, CNTs improved the performance of anaerobic systems, and methane production was comparable (Fig. 4a). The func-tion of CNTs to promote methane producfunc-tion in sediment and sludge has been observed in some studies (Li et al., 2015; Zhang et al., 2018). But the proposed explanations were that CNTs promoted electron transfer between the electrogenic bacteria and the methanogens to reduce CO2. However, Geobacter spp. are the only bacteria demonstrated to partic-ipate in DIET with methanogens (Van Steendam et al., 2019). But CNTs did not affect the abundance of Geobacter or other canonical elec-tricigens, such as Shewanella, in this study.
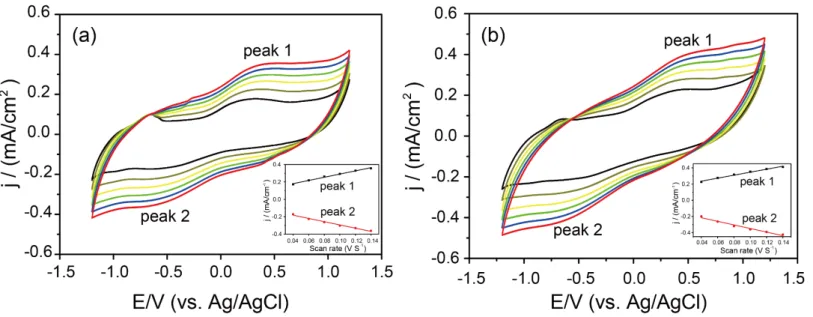
We also analyzed the electron transfer by means of an electro-chemical method. The addition of CNTs did not significantly change the redox peak (Fig. S5), suggesting that the role of CNTs in promoting electron transfer between electromicroorganisms and methanogenic archaea may also be weak. In view of this, the traditional conclusion that conductive materials facilitate DIET between electron-donating bacteria and methanogens to improve CO2 reduction may not fully explain the phenomenon well (Fig. 5e). It is worth noting that the abundance of methanogenic archaea was improved by CNTs (Figs. S3b and S4). Therefore, CNTs may only benefit methanogenic archaea just as pure cultures.
4.4. Acetoclastic methanogenesis contributed to methane accumulation in anaerobic soils
The inhibitor worked (Fig. 4a), and it was feasible to analyze the contribution of different pathways by inhibiting the acetoclastic methanogenic pathway based on isotopic fractionation (Conrad, 2005). It is widely recognized that the δ13C value of methane is more negative when CO2 is used as a substrate than when methane is obtained using acetate as a precursor (Conrad, 2005). With the application of CH3F, the δ13C-values of methane were very negative and in the range of CO2 reduction (Conrad and Casper, 2010; Penning et al., 2006). According to Table 1, increased methane production was mainly due to the ace-toclastic methanogenesis, which was very consistent with the results shown in Fig. 4e. To the best of our knowledge, this is the first time that
Table 1 Isotopic signatures (δ 13C) of CH 4 and CO2 produced in the vials. Treatments δ 13C-values of CH4 (with CH 3 F, ‰ ) 1 δ 13C-values of CO2 (with CH3 F, ‰ ) 2 α 3 δ 13C-values of CO2 (without CH3 F, ‰ ) 4 δmc 5 δma 6 δ 13C-values of CH4 (without CH 3 F, ‰ ) fma (%) calculated percent with CH3 F (%) Control (3rd day) − 67.69 ± 2.29 − 19.86 ± 1.13 1.05 ± 0.002 − 19.13 ± 0.71 − 66.70 ± 1.94 − 46.97 ± 0.57 − 50.12 ± 2.21 85.00 ± 10.18 82.96 CNTs (3rd day) − 68.46 ± 0.86 − 19.16 ± 0.53 1.05 ± 0.001 − 17.99 ± 0.05 − 67.35 ± 1.16 − 50.50 ± 0.35 − 50.42 ± 1.47 100.61 ± 9.29 75.98 Control (5th day) − 67.69 − 19.86 1.05 − 19.66 ± 0.46 − 67.49 ± 0.45 − 47.59 ± 0.76 − 54.58 ± 0.91 64.88 ± 1.47 73.89 CNTs (5th day) − 68.46 − 19.16 1.05 − 18.48 ± 0.50 − 67.82 ± 0.47 − 49.65 ± 0.42 − 56.20 ± 0.95 63.93 ± 7.66 74.35 1δ 13C-values of CH4 produced in incubations of slurry in the presence of CH3 F. The δ 13C values used on the 5th day were the average of those on the 3rd day. 2δ 13C-values of CO2 produced in incubations of slurry in the presence of CH3 F. The δ 13C values used on the 5th day were the average of those on the 3rd day. 3Calculated with the equation ( αCO 2 /CH 4 = δ 13CO 2 + 1000 δ 13CH 4 (CO 2 ) + 1000 ) using δ 13C-values of CH 4 and CO2 in the presence of CH 3 F. 4δ 13C-values of CO2 produced in incubations of slurry without CH3 F. 5Calculated values of δ 13CH 4 using ( 3) and ( 4) according to the equation shown in ( 3). 6According to a previous review 35, the value of δma was calculated by assuming an ε of − 21 ‰ and δma = δ 13Csoc + ε at the exhausted condition.
the capability of carbon nanomaterials to improve direct acetate dis-mutation has been proposed in natural soil. However, this study used only one kind of soil for verification. To make the conclusion more generalizable, it would be better to verify the promotion of carbon nanomaterials on acetoclastic methanogenesis with different charac-teristics of soils.
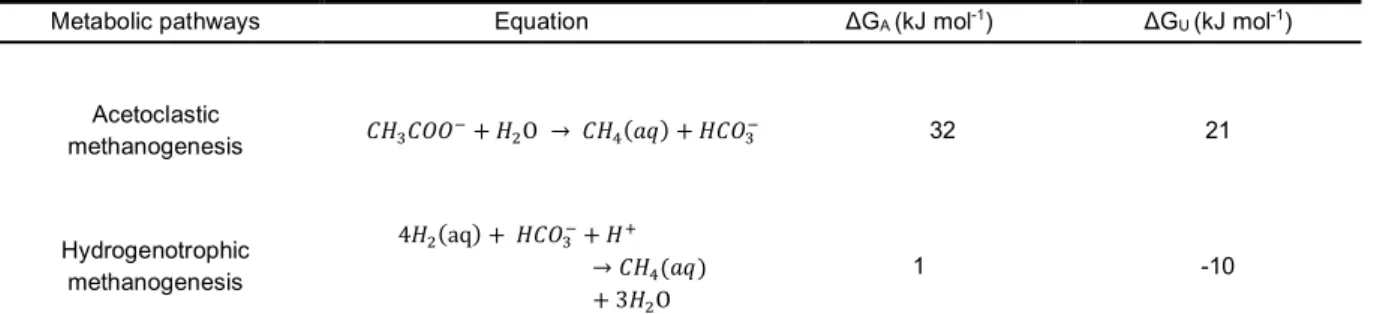
Combined with the energy release of methanogenic archaea, aceto-clastic methanogenesis actually releases more energy than CO2 reduc-tion in a nominal environment (Table S3). The energy, ΔGA, is the free energy liberated by the group’s net reaction. According to the data shown in Table S4, for producing 1 mol of methane, 32 or 1 kJ of energy is available by acetoclastic methanogenesis or hydrogenotrophic meth-anogenesis, respectively, to Methanosarcina (Bethke et al., 2011). Spe-cifically, considering the consumption of ATP during methanogenesis, the useable energy ΔGu is approximately 21 kJ per mole of methane produced for acetoclastic methanogenesis. However, for hydro-genotrophic methanogenesis, this value is approximately − 10 kJ. Thus, the production of 1 mol of methane by this pathway requires an addi-tional source of 10 kJ of energy. Under the premise that CNTs promote both methanogenic pathways (Fig. 4b), energy metabolism may also explain why the proportion of methane production from acetate dis-mutation was much higher than that from CO2 reduction in both pure culture and anaerobic soil.
5. Conclusion
In addition to the stimulation of the electric syntrophy between exoelectrogenic bacteria and methanogens by conductive C/Fe-bearing materials, the findings of this study revealed that carbon nanotubes
directly favoured methane production by promoting a route for aceto-clastic methanogenesis independently of electrogenic microorganisms. Moreover, with accurate substrates and methanogens, multiple tech-nologies are still needed to analyze the diverse methanogenic processes. More importantly, we not only found this phenomenon with pure cul-ture, but also systematically verified it in environmental samples. Reli-able experiments proposed a new model to expand our knowledge of the role of conductive nanomaterials in methanogenic acetate degradation in natural environments.
CRediT authorship contribution statement
Leilei Xiao: Data curation, Formal analysis, Writing - review & editing. Shiling Zheng: Writing - review & editing. Eric Lichtfouse: Writing - review & editing. Min Luo: Writing - review & editing. Yang Tan: Writing - review & editing. Fanghua Liu: Data curation, Formal analysis.
Declaration of competing interest
The authors declare that they have no competing interests. Acknowledgments
This research was financially supported by the National Natural Science Foundation of China (no. 41703075, 91751112 and 41573071), the Natural Science Foundation of Shandong Province (no. JQ201608 and ZR2016DQ12) and the Young Taishan Scholars Program of Shan-dong Province (no. tsqn20161054).
Fig. 5. Surface-associated carbon nanotubes (CNTs)
strengthened acetoclastic methanogenesis of
M. barkeri. Analysis of the distribution of CNTs and
cells by transmission electron microscopy (TEM) for the experimental group (a, c and d) and the control (b). The white arrow indicates that the CNTs were in close contact with the cell surface. Linear CNTs can be clearly seen in the green box. The traditional and proposed pathway based on references and findings in this study (e). (For interpretation of the references to colour in this figure legend, the reader is referred to the Web version of this article.)
9
Appendix A. Supplementary data
Supplementary data to this article can be found online at https://doi. org/10.1016/j.soilbio.2020.107938.
References
Abken, H.J., Tietze, M., Brodersen, J., Bumer, S., Beifuss, U., Deppenmeier, U., 1998. Isolation and characterization of methanophenazine and function of phenazines in membrane-bound electron transport of Methanosarcina mazei Gol. Journal of
Bacteriology 180 (8), 2027–2032.
Bethke, C.M., Sanford, R.A., Kirk, M.F., Jin, Q.S., Flynn, T.M., 2011. The thermodynamic
ladder in geomicrobiology. American Journal of Science 311 (3), 183–210.
Conrad, R., 2005. Quantification of methanogenic pathways using stable carbon isotopic
signatures: a review and a proposal. Organic Geochemistry 36 (5), 739–752.
Conrad, R., Casper, P., 2010. Stable isotope fractionation during the methanogenic degradation of organic matter in the sediment of an acidic bog lake, Lake Grosse
Fuchskuhle. Limnology & Oceanography 55 (5), 1932–1942.
Fu, L., Zhou, T., Wang, J., You, L., Lu, Y., Yu, L., Zhou, S., 2019. NanoFe3O4 as solid electron shuttles to accelerate acetotrophic methanogenesis by Methanosarcina
barkeri. Frontiers in Microbiology 10, 388.
Holmes, D.E., Smith, J.A., 2016. Biologically produced methane as a renewable energy
source. Advances in Applied Microbiology 97, 1–61.
Hutten, T.J., Bongaerts, H.C.M., Drift, C., Vogels, G.D., 1980. Acetate, methanol and carbon-dioxide as substrates for growth of Methanosarcina-barkeri. Antonie Van
Leeuwenhoek Journal of Microbiology 46 (6), 601–610.
Ji, Y., Liu, P., Conrad, R., 2018. Response of fermenting bacterial and methanogenic archaeal communities in paddy soil to progressing rice straw degradation. Soil
Biology and Biochemistry 124, 70–80.
Kaster, A.K., Moll, J., Parey, K., Thauer, R.K., 2011. Coupling of ferredoxin and heterodisulfide reduction via electron bifurcation in hydrogenotrophic methanogenic archaea. Proceedings of the National Academy of Sciences of the
United States of America 108 (7), 2981–2986.
Li, J., Xiao, L., Zheng, S., Zhang, Y., Luo, M., Tong, C., Xu, H., Tan, Y., Liu, J., Wang, O., Liu, F., 2018. A new insight into the strategy for methane production affected by conductive carbon cloth in wetland soil: beneficial to acetoclastic methanogenesis
instead of CO2 reduction. The Science of the Total Environment 643, 1024–1030.
Li, L.L., Tong, Z.H., Fang, C.Y., Chu, J., Yu, H.Q., 2015. Response of anaerobic granular sludge to single-wall carbon nanotube exposure. Advances in Water Resources 70,
1–8.
Li, Q., Li, L., Rejtar, T., Lessner, D., Karger, B., Ferry, J., 2006. Electron transport in the pathway of acetate conversion to methane in the marine archaeon Methanosarcina
acetivorans. Journal of Bacteriology 88 (2), 702–710.
Liu, F., Rotaru, A.E., Shrestha, P.M., Malvankar, N.S., Nevin, K.P., Lovley, D.R., 2012. Promoting direct interspecies electron transfer with activated carbon. Energy &
Environmental Science 5 (10), 8982.
Liu, F.H., Rotaru, A.E., Shrestha, P.M., Malvankar, N.S., Nevin, K.P., Lovley, D.R., 2015. Magnetite compensates for the lack of a pilin-associated c-type cytochrome in
extracellular electron exchange. Environmental Microbiology 17 (3), 648–655.
Liu, P.F., Klose, M., Conrad, R., 2018. Temperature effects on structure and function of the methanogenic microbial communities in two paddy soils and one desert soil. Soil
Biology and Biochemistry 124, 236–244.
Lu, J., Chang, J., Lee, D., 2020. Adding carbon-based materials on anaerobic digestion
performance: a mini-review. Bioresource Technology 300, 122696.
Martins, G., Salvador, A.F., Pereira, L., Alves, M.M., 2018. Methane production and conductive materials: a critical review. Environmental Science and Technology 52
(18), 10241–10253.
Morita, M., Malvankar, N.S., Franks, A.E., Summers, Z.M., Giloteaux, L., Rotaru, A.E., Rotaru, C., Lovley, D.R., 2011. Potential for direct interspecies electron transfer in
methanogenic wastewater digester aggregates. mBio 2, e00159-11.
Penning, H., Claus, P., Casper, P., Conrad, R., 2006. Carbon isotope fractionation during acetoclastic methanogenesis by Methanosaeta concilii in culture and a lake sediment.
Applied and Environmental Microbiology 72 (8), 5648–5652.
Rai, P.K., Kumar, V., Lee, S., Raza, N., Kim, K.H., Ok, Y.S., Tsang, D.C.W., 2018. Nanoparticle-plant interaction: implications in energy, environment, and
agriculture. Environment International 119, 1–19.
Rother, M., Metcalf, W., 2004. Anaerobic growth of Methanosarcina acetivorans C2A on carbon monoxide: an unusual way of life for a methanogenic archaeon. Proceedings of the National Academy of Sciences of the United States of America 101 (48),
16929–16934.
Salvador, A.F., Martins, G., Melle-Franco, M., Serpa, R., Stams, A.J.M., Cavaleiro, A.J., Pereira, M.A., Alves, M.M., 2017. Carbon nanotubes accelerate methane production in pure cultures of methanogens and in a syntrophic coculture. Environmental
Microbiology 19 (7), 2727–2739.
Song, X., Liu, J., Jiang, Q., Zhang, P., Shao, Y., He, W., Feng, Y., 2019. Enhanced electron transfer and methane production from low-strength wastewater using a new granular activated carbon modified with nano-Fe3O4. Chemical Engineering Journal
374, 1344–1352.
Stumm, W., Morgan, J.J., 1996. Aquatic Chemistry: Chemical Equilibria and Rates in
Natural Waters. John Wiley & Sons, Inc., Hoboken.
Usman, M., Farooq, M., Wakeel, A., Nawaz, A., Cheema, S.A., Rehman, H.U., Ashraf, I., Sanaullah, M., 2020. Nanotechnology in agriculture: current status, challenges and
future opportunities. The Science of the Total Environment 721, 137778.
Van Steendam, C., Smets, I., Skerlos, S., Raskin, L., 2019. Improving anaerobic digestion via direct interspecies electron transfer requires development of suitable
characterization methods. Current Opinion in Biotechnology 57, 183–190.
Viggi, C.C., Rossetti, S., Fazi, S., Paiano, P., Majone, M., Aulenta, F., 2014. Magnetite particles triggering a faster and more robust syntrophic pathway of methanogenic propionate degradation. Environmental Science and Technology 48 (13),
7536–7543.
Wagner, T., Ermler, U., Shima, S., 2016. The methanogenic CO2 reducing-and-fixing enzyme is bifunctional and contains 46 [4Fe-4S] clusters. Science 354 (6308),
114–117.
Wang, H., Byrne, J.M., Liu, P.F., Liu, J., Dong, X.Z., Lu, Y.H., 2020. Redox cycling of Fe (II) and Fe (III) in magnetite accelerates aceticlastic methanogenesis by
Methanosarcina mazei. Environmental Microbiology Reports 12, 97–109.
Whiticar, M., 1999. Carbon and hydrogen isotope systematics of bacterial formation and
oxidation of methane. Chemical Geology 161, 291–314.
Xiao, L., Liu, F., Lichtfouse, E., Zhang, P., Feng, D., Li, F., 2020. Methane Production by Acetate Dismutation stimulated by Shewanella oneidensis and carbon materials: as an
alternative to classical CO2 reduction. Chemical Engineering Journal 389, 124469.
Xiao, L., Liu, F., Liu, J., Li, J., Zhang, Y., Yu, J., Wang, O., 2018. Nano-Fe3O4 particles
accelerating electromethanogenesis on an hour-long timescale in wetland soil.
Environmental Sciences: Nano 5 (2), 436–445.
Xiao, L., Liu, F., Xu, H., Feng, D., Liu, J., Han, G., 2019. Biochar promotes methane production at high acetate concentrations in anaerobic soils. Environmental
Chemistry Letters 17, 1347–1352.
Xiao, L., Sun, R., Zhang, P., Zheng, S., Tan, Y., Li, J., Zhang, Y., Liu, F., 2019. Simultaneous intensification of direct acetate cleavage and CO2 reduction to generate methane by bioaugmentation and increased electron transfer. Chemical
Engineering Journal 378, 122229.
Xiao, L., Wei, W., Luo, M., Xu, H., Feng, D., Yu, J., Huang, J., Liu, F., 2019. A potential contribution of a Fe(III)-rich red clay horizon to methane release: biogenetic
magnetite-mediated methanogenesis. Catena 181, 104081.
Xiao, L., Xie, B., Liu, J., Zhang, H., Han, G., Wang, O., Liu, F., 2017. Stimulation of long- term ammonium nitrogen deposition on methanogenesis by Methanocellaceae in a
coastal wetland. The Science of the Total Environment 595, 337–343.
Yan, Z., Wang, M.Y., Ferry, J.G., 2017. A ferredoxin-and F420H2-dependent, electron- bifurcating, heterodisulfide reductase with homologs in the domains bacteria and
archaea. mBio 8 (1), e02285-16.
Zehnder, A.J.B., Wuhrmann, K., 1977. Physiology of a methanobacterium strain az.
Archives of Microbiology 111 (3), 199–205.
Zhang, W., Zhang, J.C., Lu, Y.H., 2018. Stimulation of carbon nanomaterials on syntrophic oxidation of butyrate in sediment enrichments and a defined coculture.
Scientific Reports 8, 12185.
Zhu, Z.K., Ge, T.D., Liu, S.L., Hu, Y.J., Ye, R.Z., Xiao, M.L., Tong, C.L., Kuzyakov, Y., Wu, J.S., 2018. Rice rhizodeposits affect organic matter priming in paddy soil: the role of N fertilization and plant growth for enzyme activities, CO2 and CH4
1
Supplementary material
Carbon nanotubes accelerate acetoclastic methanogenesis: From pure cultures to
anaerobic soils
Preparation of anaerobic slurry
The bottles were flushed with N
2for approximately 30 min and incubated statically at 30°C in a dark
room. After five weeks of incubation, the incubated soil reached a high methane production potential with
a methane concentration of about 100,000 ppm. Then, the incubated soil (5 mL) was dispensed into sterile
11-mL serum vials, which were pre-evacuated, flushed with high-purity N
2, and incubated statically at
30 C.
Samples Preparation and TMT Labeling
Samples of methanogens were lysed by using lysis buffer (300 µL) supplemented with 1 mM PMSF
and sonicated for 3 min. After centrifugation of 15 min (15000 g), we collected the supernatant. Bradford
assay was used to test protein concentration and protein was aliquoted to store at -80°C. For each sample,
100 μg of proteins were mixed with 120 μL reducing buffer (10 mM DTT, 8 M Urea, 100 mM TEAB, pH
8.0) in Amicon® Ultra-0.5 Centrifugal Filter (10 kDa) and incubated at 60°C for 60 min. Then
iodoacetamide was added to the solution with the final concentration of 50 mM and incubated for 40 min
at room temperature in the dark. After centrifugation at 12000 rpm for 20 min, samples were washed three
times with triethylammonium bicarbonate buffer (TEAB) and digested with trypsin (Promega, Madison, WI,
USA) (enzyme to protein ratio 1:50) at 37°C overnight. Digested peptides were labeled with TMT reagents
(Thermo Fisher Scientific) according to the manufacturer’s instructions. For each 6-plex TMT, control
samples were labeled with TMT tags 126, 127, 128 and treatments with CNTs were labeled with TMT tags
129, 130, and 131, respectively. Equal amounts of TMT-labeled peptides were mixed and dried, then
resuspended in buffer A (2% acetonitrile, 98% water with ammonia at pH 10) and fractionated by 1100
HPLC System (Agilent).
Proteomic Analysis by LC-MS/MS
Peptides were redissolved with 0.1% formic acid (FA) and analyzed on a Q-Exactive mass
spectrometer (Thermo Fisher Scientific, Waltham, MA, USA) coupled with a nanospray Flex source
(Thermo, USA). Samples were loaded and separated by a C18 column (15 cm × 75 µm) on an EASY
-nLC
TM1200 system (Thermo, USA) in Qingdao OeBiotech. Co., Ltd. The flow rate was 300 nL/min and
linear gradient was 90 min. The mass spectrometer was operated in the data-dependent mode with
positive polarity at electrospray voltage of 2 kV. Full scan MS spectra (m/z 300–1600) were acquired in
the orbitrap with the resolution as 70 K, the automatic gain control (AGC) target was 1e6 and the maximum
injection time was 80 ms. The top 10 intense ions were isolated for HCD MS/MS fragmentation. In MS2,
the resolution was 17500 and the AGC target was 2e5. Fragmentation was performed with normalized
collision energy (NCE) of 32% and dynamic exclusion duration of 15 s.
Mass spectrometry data analysis
The mass spectrometry (MS) raw data were analyzed with Proteome Discoverer software (version
2.2) using the Sequest search engine to search against the Methanosarcina barkeri database (UniProtKB,
release 2019_03). The following parameters were applied: precursor mass tolerance was 20 ppm;
fragment tolerance was 0.5 Da; the dynamic modifications were oxidation (M); the static modification was
carbamidomethyl (C) and TMT labeling of amines and lysine; a maximum of two missed cleavages were
allowed. Peptides with FDR < 0.01 (based on the target-decoy database algorithm) were used for protein
grouping. Protein groups identified ≥ 1 peptides were considered for further analysis and only unique
peptides were used for protein quantification. The mass spectrometry raw data were deposited to the
iProX (http://iprox.org). URL: https://www.iprox.org/page/PSV023.html;?url=1555463853480QxPM,
Password: CO2T
By analyzing the clustering results, based on the credible data in the results, the fold change value
was obtained by dividing the average value of the CNTs group data by the average value of the control
group data, and the p-value of each group was calculated. It was considered that p-value less than or
equal to 0.05 was regarded as a differential protein. Cluster Profiler package in R language was used to
analyze differential proteins, enrichKEGG function was used to compare differential proteins data in KEGG
database, and DOTPLOT was used to map the results of signal pathway comparison. With p-value equal
to 0.05 as the standard, we used cnetplot function to map the change relationship between genes and
signaling pathways based on the data with significant difference in change, in which the color difference
2
was fold change value.
Electrochemical measurements
A single-chamber three-electrode electrochemical cell was used to conduct CV measurements for
characterizing the electron transfer rate. Three electrodes were reference electrode (Ag/AgCl), graphite
plate electrode (3.0 cm × 2.5 cm × 0.3 cm, working electrode), and platinum electrode (counter electrode).
Incubated soil (~ 70 mL) was poured into the electrochemical cell. CNTs concentration was 0.2g/L as well.
CVs were measured using an electrochemical workstation (CHI660e, Chenhua, China). The working
electrode had a scan voltage between −1.2 and 1.2 V (versus Ag/AgCl), and the scan rates were 40 –140
mV/s.
3
Table 1 Proteins tested by proteome may be involved in acetoclastic methanogenesis.
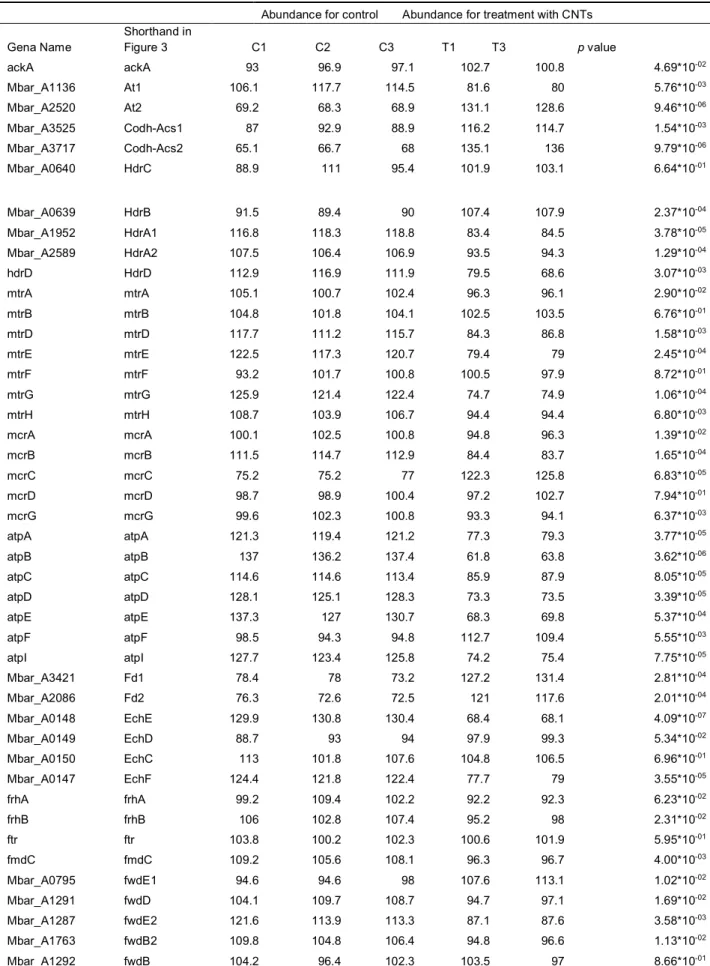
Abundance for control Abundance for treatment with CNTs Gena Name Shorthand in Figure 3 C1 C2 C3 T1 T3 p value ackA ackA 93 96.9 97.1 102.7 100.8 4.69*10-02 Mbar_A1136 At1 106.1 117.7 114.5 81.6 80 5.76*10-03 Mbar_A2520 At2 69.2 68.3 68.9 131.1 128.6 9.46*10-06 Mbar_A3525 Codh-Acs1 87 92.9 88.9 116.2 114.7 1.54*10-03 Mbar_A3717 Codh-Acs2 65.1 66.7 68 135.1 136 9.79*10-06 Mbar_A0640 HdrC 88.9 111 95.4 101.9 103.1 6.64*10-01 Mbar_A0639 HdrB 91.5 89.4 90 107.4 107.9 2.37*10-04 Mbar_A1952 HdrA1 116.8 118.3 118.8 83.4 84.5 3.78*10-05 Mbar_A2589 HdrA2 107.5 106.4 106.9 93.5 94.3 1.29*10-04 hdrD HdrD 112.9 116.9 111.9 79.5 68.6 3.07*10-03 mtrA mtrA 105.1 100.7 102.4 96.3 96.1 2.90*10-02 mtrB mtrB 104.8 101.8 104.1 102.5 103.5 6.76*10-01 mtrD mtrD 117.7 111.2 115.7 84.3 86.8 1.58*10-03 mtrE mtrE 122.5 117.3 120.7 79.4 79 2.45*10-04 mtrF mtrF 93.2 101.7 100.8 100.5 97.9 8.72*10-01 mtrG mtrG 125.9 121.4 122.4 74.7 74.9 1.06*10-04 mtrH mtrH 108.7 103.9 106.7 94.4 94.4 6.80*10-03 mcrA mcrA 100.1 102.5 100.8 94.8 96.3 1.39*10-02 mcrB mcrB 111.5 114.7 112.9 84.4 83.7 1.65*10-04 mcrC mcrC 75.2 75.2 77 122.3 125.8 6.83*10-05 mcrD mcrD 98.7 98.9 100.4 97.2 102.7 7.94*10-01 mcrG mcrG 99.6 102.3 100.8 93.3 94.1 6.37*10-03 atpA atpA 121.3 119.4 121.2 77.3 79.3 3.77*10-05 atpB atpB 137 136.2 137.4 61.8 63.8 3.62*10-06 atpC atpC 114.6 114.6 113.4 85.9 87.9 8.05*10-05 atpD atpD 128.1 125.1 128.3 73.3 73.5 3.39*10-05 atpE atpE 137.3 127 130.7 68.3 69.8 5.37*10-04 atpF atpF 98.5 94.3 94.8 112.7 109.4 5.55*10-03 atpI atpI 127.7 123.4 125.8 74.2 75.4 7.75*10-05 Mbar_A3421 Fd1 78.4 78 73.2 127.2 131.4 2.81*10-04 Mbar_A2086 Fd2 76.3 72.6 72.5 121 117.6 2.01*10-04 Mbar_A0148 EchE 129.9 130.8 130.4 68.4 68.1 4.09*10-07 Mbar_A0149 EchD 88.7 93 94 97.9 99.3 5.34*10-02 Mbar_A0150 EchC 113 101.8 107.6 104.8 106.5 6.96*10-01 Mbar_A0147 EchF 124.4 121.8 122.4 77.7 79 3.55*10-05 frhA frhA 99.2 109.4 102.2 92.2 92.3 6.23*10-02 frhB frhB 106 102.8 107.4 95.2 98 2.31*10-02 ftr ftr 103.8 100.2 102.3 100.6 101.9 5.95*10-01 fmdC fmdC 109.2 105.6 108.1 96.3 96.7 4.00*10-03 Mbar_A0795 fwdE1 94.6 94.6 98 107.6 113.1 1.02*10-02 Mbar_A1291 fwdD 104.1 109.7 108.7 94.7 97.1 1.69*10-02 Mbar_A1287 fwdE2 121.6 113.9 113.3 87.1 87.6 3.58*10-03 Mbar_A1763 fwdB2 109.8 104.8 106.4 94.8 96.6 1.13*10-02 Mbar_A1292 fwdB 104.2 96.4 102.3 103.5 97 8.66*10-01
4
Table 2 Kinetic parameters of the methane production by fitting the modified Gompertz equation.
Treatment Measured value*
Kinetic model parameters
λ (Day) Rmax (mM D-1) Pmax (mM) R2
control 0.282±0.022 0.629 ±0.223 0.087±0.014 0.297 ±0.016 0.999
CNT 0.289±0.027 0.426 ±0.137 0.102±0.010 0.304±0.011 0.999
*Measured maximum concentration of methane at the end of the batch experiments (mM)
Table 3 Electron accepting and donating processes of methane production as defined by free
energy change in a nominal anoxic geochemical environment
aHalf-reactions Metabolic pathways Equation ΔG (kJ mol-1)
Electron donating half-reactions
acetotrophy !"#!$$%+ 4"(O → 2"!$#%+ 9".+ 80% -216
hydrogentrophy 4"((aq) → 8".+ 80% -185
Electron accepting
half-reaction methanogenesis "!$#%+ 9".+ 80%→ !"5+ 3"(O 184
a Related data refer to Bethke et al.5. 25 °C; pH 7; 1 mmol kg-1 Ca2+, CO2(aq) + HCO3-, SO42-, NO3-, Fe2+, and Mn2+; 1 µmol kg-1 CH3COO-, CH4(aq), HS-, and NH4+; 1 nmol kg-1 H2(aq); N2(aq) at atmospheric saturation.
Table 4 Net reactions for two major methanogenesis, the reactions’ available (ΔG
A) and usable
energies (ΔG
U) in a nominal geochemical environment
aMetabolic pathways Equation ΔGA (kJ mol-1) ΔGU (kJ mol-1)
Acetoclastic methanogenesis !"#!$$%+ "(O → !"5(78) + "!$#% 32 21 Hydrogenotrophic methanogenesis 4"((aq) + "!$#%+ ". → !"5(78) + 3"(O 1 -10