HAL Id: hal-00946177
https://hal-agroparistech.archives-ouvertes.fr/hal-00946177v2
Submitted on 4 Jun 2019
HAL is a multi-disciplinary open access
archive for the deposit and dissemination of sci-entific research documents, whether they are pub-lished or not. The documents may come from teaching and research institutions in France or abroad, or from public or private research centers.
L’archive ouverte pluridisciplinaire HAL, est destinée au dépôt et à la diffusion de documents scientifiques de niveau recherche, publiés ou non, émanant des établissements d’enseignement et de recherche français ou étrangers, des laboratoires publics ou privés.
Decomposing Phylodiversity
Eric Marcon, Bruno Herault
To cite this version:
Eric Marcon, Bruno Herault. Decomposing Phylodiversity. Methods in Ecology and Evolution, Wiley, 2015, 6 (3), pp.333-339. �10.1111/2041-210X.12323�. �hal-00946177v2�
DecomposingPhylodiversity
E
RICM
ARCON1,
B
RUNOH
ÉRAULT21
AgroParisTech, UMR EcoFoG, BP 709, F-97310 Kourou, French Guiana. Corresponding author, e-mail: [email protected]
2
A
BSTRACTKeywords:Entropy, Biodiversity, Phylogenetic diversity, Functional diversity.
We unify the definitions of phylogenetic and functional entropy and diversity as a
generalization of HCDT entropy when an ultrametric tree is considered. We derive the
decomposition of phylodiversity and its estimation bias correction to allow its estimation from
real, often undersampled data.Phyloentropy can be transformed into phylodiversity to provide a
measure of true diversity, i.e. an effective number of species or communities.
A
CKNOWLEDGEMENTSThis work has benefited from an "Investissementd’Avenir" grant managed by
Introduction
Diversity partitioning using conventional species-neutral approach (based on Hill
numbers, i.e. the effective number of species) is now being replaced by far more interesting
frameworks taking into account the species relatedness. This is what we call
‘phylodiversity’(Webb, Losos & Agrawal 2006), i.e. how species assemblages are distributed in a
phylogenic tree. When bothrelative abundance and relatednessdegree between species (or
individuals) are quantified, Pielou(1975)suggested that diversity measures should be generalized
integrating taxonomic differences between species. A little later, Rao (1982) proposed that the
average of the species differences can be used as a measure of biodiversity. Despite some
attempts to take into account phylogenic diversity into a generalized species richness
(Vane-Wright, Humphries & Williams 1991), this ‘avant-garde’ ideahas been hardly applied in ecology (e.g. Warwick & Clarke 1995; Crozier 1997).During the last decade, increasing interests into the
evolutionary history of communities (Webb 2000) as well as the need for conservation strategies
taking phylogenetic risks into account (Faith 2008) revived the interest in phylodiversity
partitioning.
Phylogenetic trees are built upon thegenetic similarities and differencesamong various
biological individuals or other superior taxa.In a given local assemblage, phylogenetic diversity
aims to quantify the evolutionary history shared among individuals since the time of the most
recent common ancestor(Chao, Chiu & Jost 2010). All else being equal, an assemblage of
phylogenetically divergent species is often seen as more diverse than a local assemblage of
phylogenetic diversity not only between local communities but also between time periods in
order to elucidate community assembly rules(Pavoine, Love & Bonsall 2009) and investigate
what is commonly called the phylogenetic structure of communities (e.g. Cavender-Bares et al.
2004). For instance, Hardy & Senterre (2007)argued that a proper partitioning of phylodiversity
is a necessary step prior to deciphering phylogenetic clustering (either due to local speciation of
allopatric clades or habitat filtering of phylogenetically conserved traits) fromphylogenetic
overdispersion (allopatric speciation of two ancestral sympatric species, habitat filtering of
phylogenetically convergent traits, competitive exclusion of related species).
Functional trees differ from phylogenetic trees as phylogenetic trees reflect evolutionary
constraints while functional trees also take into account ecological convergence (Herault 2007).
Each time a proper functional tree can be constructed from a functional trait-based distance
matrix (Podani & Schmera 2007), it should be possible to estimate and partition functional
diversity in a mannersimilar to phylogenetic diversity(Petchey & Gaston 2002). Functional
diversity was often defined as the extent of functional differencesamong individuals or species in
a local community (Tilman 2001), animportant determinant of ecosystem processes (Loreau et al.
2001). Functional diversity based on functional trees is a great tool to estimate the
complementarity among individuals’ or species’ trait values by estimating their dispersion in trait
space at all hierarchical scales simultaneously, avoiding discretization of continuous trait
variation into functional groups (Petchey & Gaston 2002). However, functional differences
among species or individuals being assessed by a number of a priori important functional traits,
the degree of similarity among species and, in fine, the functional diversity value itself will both
In this paper, we consider that all individuals or species of a local community take place
in an ultrametric phylogenetic or functional tree. The distance between two species is measured
as the length of the branches between them and their first common node. Chao, Chiu and Jost
(2010) generalized Hill numbers to measure phylogenetic or functional diversity (we will often
write phylodiversity and phyloentropy for short) while Pavoine, Love and Bonsall (2009)
generalized HCDT entropy(Shimatani 2001; Ricotta 2005 had already done it, but for Rao's
quadratic entropy only). We first show here their equivalence: phyloentropy is transformed into
phylodiversity the same way HCDT entropy is transformed into diversity sensustricto. Then, we
derive phylodiversity partitioning as a straightforward generalization of that of HCDT
diversity.Finally, we provide estimation-bias corrections for phyloentropy in order to obtain
bias-corrected measures of phylodiversity.
Partitioning phylodiversity
Tsallis entropy
Tsallis entropy, also known as HCDT entropy (Havrda & Charvát 1967; Daróczy 1970;
Tsallis 1988) has proven to be a powerful tool to measure diversity, generalizing the classical
indices of diversity, including the number of species, Shannon and Simpson indices. The order of
diversity q gives more or less importance to rare species. Entropy can be converted into diversity
sensustricto(Hill 1973; Jost 2006), easy to interpret and compare. Estimators of diversity are
intrinsically biased because of unseen species and also because they are not linear functions of
Holloway & Schwanghart 2013), even if some bias corrections are available for HCDT entropy
estimators (Grassberger 1988; Chao & Shen 2003; Marcon et al. in press).
Neutral diversity
We first recall some features of HCDT diversity partitioning (Marcon et al. in press).
Consider a metacommunity made of several local communities. Abundances of species in each
local community is denoted ��,� (� = 1, 2, … , � is the index of species,�the index of communities). ��is the number of individuals of species � in the metacommunity, �� the number of individuals sampled in local community � and � the total number. The same notations are used for probabilities of occurrence �,� which are unknown but estimated with �,� =��,� . ��
Community weights are �: they may be equal to �� but any positive values summing to 1 are � allowed. Probabilities in the metacommunity depend on these weights: � = � � �,�. Diversity
of the metacommunity is diversity. Diversity of local communities is diversity. The
formalism of deformed logarithms is appropriated: it allows elegant and intuitive algebra. The
logarithm of order is defined as:
lnq =
1− − 1
1− (1)
Its inverse function is the deformed exponential:
� = 1 + 1 − 1−1
(2)
Note that:
� +
Tsallis entropy of the metacommunity, � , can be written as:
� =1− − 1� � =− �lnq �
� (4)
Last, diversity is the deformed exponential of entropy, � = � � , and entropy is the deformed logarithm of diversity: � = lnq � .
Phyloentropy and Phylodiversity
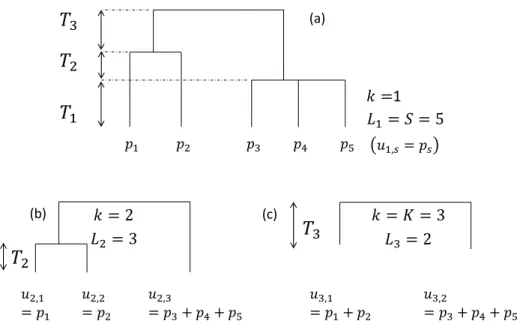
Figure 1: Hypothetical ultrametric tree. (a) The whole tree contains three slices, delimited by two nodes. The length of slices is � . b) Focus on slice 2. The tree without slice 1 is reduced to 3 leaves. Frequencies of collapsed species are � ,. c) Slice 3 only.
Consider a phylogenetic or functional ultrametric tree (Figure 1).The first slice starts at
the bottom of the tree and ends at the first node. In slice ,� leaves are found. The probabilities of occurrence of the species belonging to branches that were below leaf in the original tree are
summed to give the grouped probability� ,.
1 � � � � � � � � � � (a) (b) (c)
We follow Pavoine, Love and Bonsall (2009) to define phyloentropy as the sum of the
entropies in each tree slice, weighted by the slice height. However, we choose to normalize it by
the total tree height, = =1 . We denote it � :
� = �
=1
(5)
�is HCDT entropy inslice . It is calculated as � = − �� ,lnq� ,.
Chao, Chiu and Jost (2010) generalized Hill numbers to phylogenetic diversity, defined
as: � = � , � =1 =1 1 1− (6)
Simple algebra shows that:
� = � � (7)
This relation is exactly the same as the relation between HCDT entropy and diversity. In
other words, phyloentropy is the weighted average of entropy along the tree, and phylodiversity
is its Hill number. Entropy is linear, it can be summed over slices, but diversity is not:
phylodiversity is not the weighted average of diversity along the tree.
Decomposition
Marcon et al. (in press) derived the decomposition of HCDT entropy, generalizing
Shannon entropy partitioning (Rao & Nayak 1985; Marcon et al. 2012), based on Patil and
(Jost 2007) non-additive partitioning when community weights are unequal; see Marcon et al. (in
press) for a full discussion.
� = � + � = � �� �
+ � ��
� (8)
and entropies are the weighted sums of local community entropies �� and ��
� � =− �,� � lnq �,� � � = �,�lnq �,� � � (9)
Since phylogenetic entropy is a linear transformation of generalized entropy, its
decomposition is identical and follows equation (8). Inslice , HCDT entropy is denoted � , and the contributions of local community� to and entropy are �,� and ,�� . This can be summed over slices and rearranged to obtain the decomposition of phyloentropy:
� = � ,�� � + � ,�� � ⇔ � = � �,� � + � �,� � ⇔ � = � �� � + ��� � = � + � (10)
The deformed exponential of equation (8) is the decomposition of phylodiversity:
� = � � ; � = � � ; � = �
�
1+ 1− �
and phylodiversities can be interpreted as an equivalent number of neutral species, that
is to say the number of species equally different from each other (i.e. in an ultrametric tree made
of a single slice) with the same probability of occurrence that would give the same measure of
diversity. phylodiversity is an equivalent number of communities, that is to say the number of
completely distinct neutral communities with the same weight as actual ones, that would yield the
same diversity as the actual metacommunity.
Bias correction
and HCDT entropies can be corrected following Marcon et al. (in press): when q is
low, unsampled species are the main issue that can be corrected according to Chao and Shen
(2003); when q is high, the contribution of rare species to entropy is small so the bias they cause
is little but entropy is less linear with respect to probabilities, requiring the correction of
Grassberger (1988). Bias correction relies on the number of sampled individuals (probabilities are
not enough) and can be computed for positive values of . The unbiased estimators are denoted
� instead of � . Their formulas are in Marcon et al. (in press) and are not repeated here.
Phyloentropy can be corrected by summing the bias-corrected estimators of HCDT
entropy in each slice of the tree.Bias-corrected entropy, � , relies on values of � ,� , the bias-corrected estimators of HCDT entropy inslice in local community�.
� = � �,� �
Since the number of individuals in each leaf � , increases in slices close to the root of the tree, the bias decreases with .
� = ,�� is calculated the same way. phyloentropy is obtained as the
difference between � and � because Grassberger’s correction is not available to allow direct calculation.
Example
We used the tropical forest dataset alreadyinvestigated by Marcon et al. (2012) and
Marcon et al. (in press). Two 1-ha plots were fully inventoried in the Paracou field station in
French Guiana. 1124 individual trees (diameter at breast height over 10 cm) have been sampled
among 229 species. The phylogenetic tree was built introducing a rough taxonomy of the 229
species in the analysis: distance between species of the same genus is set to 1, 2 for different
genera of the same family, and 3 for different families. The functional tree was based onspecies
relatedness using four key functional traits related to one axis of the leaf-height-seed-stem
economic spectra of tropical trees (Baraloto et al. 2010b): seed mass and tree maximum height
(Herault et al. 2011)plusspecific leaf area and wood specific gravity (Baraloto et al. 2010a).The
functional tree was built from a Gower’s similarity matrix agglomerated using Ward’s method (full details in Herault & Honnay 2007). Phylogenicdiversity was calculated with the entropart
package (Marcon & Hérault 2013)under R (R Development Core Team 2014): bias-corrected
entropy was calculated first, summed and finally transformed into diversity. Necessary R codes
We first calculated the neutral, phylogenic and functional diversity of order 1 of the
metacommunity (the two plots) and partitioned it (each plot is considered as a local community,
weights are proportional to the numbers of individuals). The neutral diversity (Hill number of
Shannon entropy) is 134 effective species, partitioned into diversity equal to 92 effective
species (82 and 107 in each plot) and diversity equal to 1.46 equivalent communities.
Phylogenetic and functional diversity values respectively are: 1� =55 and 5.9, � =42 and 5.5 with � =1.29 and 1.06. Considering the taxonomy of Paracou species, phylodiversity is around 2.5 times smaller than neutral diversity. Functional diversity is only 6 equivalent species,
showing an extreme redundancy according to the functional tree (FD is estimated equal to 18 for
297 estimated species).
Figure 2: Graphical representation of the diversity of order 1 in Paracou plots. Transparent rectangles represent neutral diversity, hatched rectangles phylogenetic diversity and shaded rectangles functional diversity. In each case, the horizontal rectangle of height 1 represents diversity (respectively 134, 55 and 6 effective species). The other rectangle has the same area, but its size is diversity by diversity.
0 20 40 60 80 100 120 0 .0 0 .5 1 .0 1 .5 2 .0
/ diversity
d
iv
e
rs
it
y
Since diversity if the product of by , they can be represented as nested rectangles
(Figure 2). The rectangle of size � by � has the same area as that of size � by 1. Plotting neutral and phylodiversity together summarizes the essential information: the reduction
of diversity due to the consideration of species phylogenetic or functional proximity.
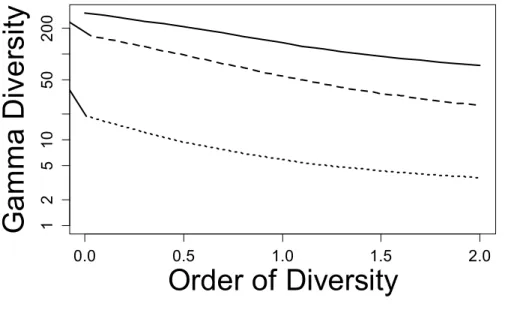
Figure 3: Diversity profile of Paracou plots. Neutral diversity (solid line), phylogenetic diversity (dashed line) and functional diversity (dotted line) are plotted against the order of diversity, between 0 (number of species, PD and FD) and 2 (Simpson diversity
and Rao’s quadratic entropy transformed into diversity), with estimation-bias correction.
Diversity scale is logarithmic for readability.
Profiles (Figure 3) can be drawn for neutral, phylogenetic and functional diversities.
0.0 0.5 1.0 1.5 2.0 1 2 5 10 50 200
Order of Diversity
G
a
m
m
a
D
iv
e
rs
it
y
Discussion and conclusion
Unification of measures of diversity
Phyloentropy generalizes manyprevious indices of diversity. Rao’s (1982) quadratic entropy is phyloentropy of order 2 multiplied by , the tree height. It has been explored in depth and several results obtained here were already known in this special case. It has been partitioned
early by Rao himself, weighting communities according to their number of individuals, as
Villeger and Mouillot (2008) while Hardy and Senterre (2007) or Pavoine et al. (2013) used
equal weights. Hardy and Jost (2008) validated both weightings but a general framework
allowing additive partitioning of Rao’s entropy was missing (Guiasu & Guiasu 2011). We
showed that arbitrary weights are acceptable.
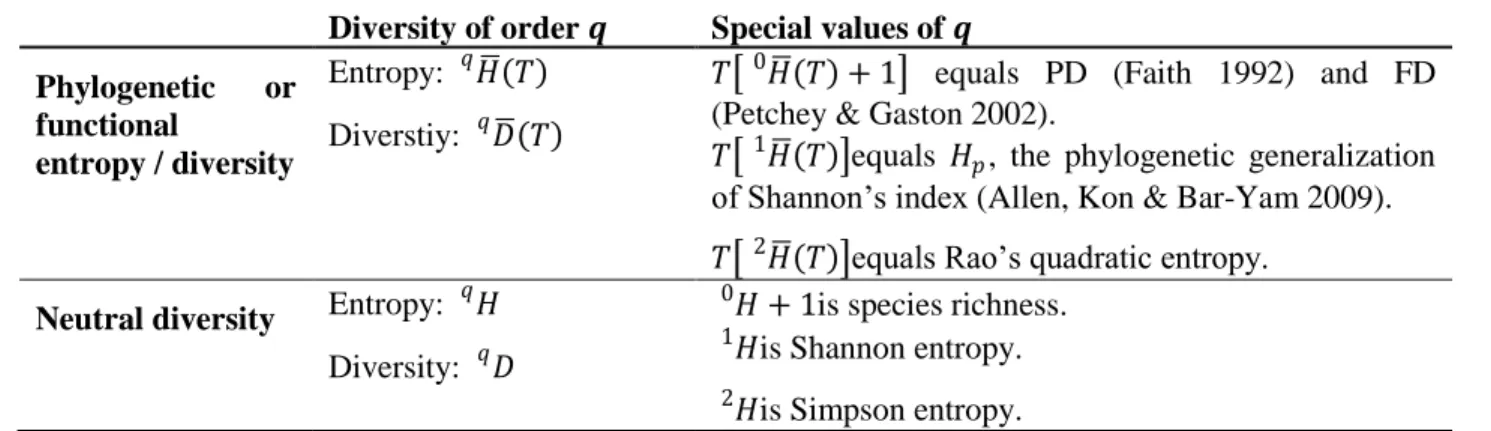
Other indices of diversity can be considered as special cases of phyloentropy. We
summarize them in Table 1.
Table 1: Many usual measures of diversity are special cases of phyloentropy, either reducing it to neutral diversity or limiting it to values of � equal to 0, 1 or 2.
Diversity of order � Special values of � Phylogenetic or
functional
entropy / diversity
Entropy: � Diverstiy: �
� 0 + 1 equals PD (Faith 1992) and FD (Petchey & Gaston 2002).
� 1 equals � , the phylogenetic generalization
of Shannon’s index (Allen, Kon & Bar-Yam 2009). � 2 equals Rao’s quadratic entropy.
Neutral diversity Entropy: �
Diversity: � � + 1 0 is species richness. � 1 is Shannon entropy. � 2 is Simpson entropy.
Conclusion
In this paper, we provide a general, consistent and operational framework to decompose
measures of neutral, phylogenetic or even functional diversity into α (within local communities) and β (between local communities) components. We show that entropy can be calculated and its
estimation bias corrected in each slice of the phylogenetic or functional tree, summed over slices
and finally transformed into diversity. In fact, phylogenetic diversity could be analyzed without
using any species concept (i.e. without categorizing individuals into a set of species) provided
that phylogenetic or functional distance between individuals can be assessed, for example using
molecular data or functional trait measured for each member of a meta community (Paine et al.
2011). Being able to properly partition phylodiversity is a necessary step towards deciphering the
ecological and evolutionary mechanisms that underlie the structure and assembly of
communities. Moreover, diversity partitioning will improve our assessment of human-driven
modifications of ecosystem functioning in conservation studies.
References
Allen, B., Kon, M. & Bar-Yam, Y. (2009) A New Phylogenetic Diversity Measure Generalizing
the Shannon Index and Its Application to Phyllostomid Bats. American Naturalist,174,
236-243.
Baraloto, C., Paine, C.E.T., Patino, S., Bonal, D., Herault, B. & Chave, J. (2010a) Functional trait
variation and sampling strategies in species-rich plant communities. Functional
Baraloto, C., Paine, C.E.T., Poorter, L., Beauchene, J., Bonal, D., Domenach, A.M., Herault, B.,
Patino, S., Roggy, J.C. & Chave, J. (2010b) Decoupled leaf and stem economics in rain
forest trees. Ecology Letters,13, 1338-1347.
Beck, J., Holloway, J.D. & Schwanghart, W. (2013) Undersampling and the measurement of beta
diversity. Methods in Ecology and Evolution,4, 370-382.
Cavender-Bares, J., Ackerly, D.D., Baum, D.A. & Bazzaz, F.A. (2004) Phylogenetic
overdispersion in Floridian oak communities. American Naturalist,163, 823-843.
Chao, A., Chiu, C.-H. & Jost, L. (2010) Phylogenetic diversity measures based on Hill numbers.
Philosophical Transactions of the Royal Society B,365, 3599-3609.
Chao, A. & Shen, T.J. (2003) Nonparametric estimation of Shannon's index of diversity when
there are unseen species in sample. Environmental and Ecological Statistics,10, 429-443.
Crozier, R.H. (1997) Preserving the information content of species: Genetic diversity, phylogeny,
and conservation worth. Annual Review of Ecology and Systematics,28, 243-268.
Daróczy, Z. (1970) Generalized information functions. Information and Control,16, 36-51.
Dauby, G. & Hardy, O.J. (2012) Sampled-based estimation of diversity sensu stricto by
transforming Hurlbert diversities into effective number of species. Ecography,35,
661-672.
Faith, D.P. (1992) Conservation evaluation and phylogenetic diversity. Biological
Conservation,61, 1-10.
Faith, D.P. (2008) Threatened Species and the Potential Loss of Phylogenetic Diversity:
Conservation Scenarios Based on Estimated Extinction Probabilities and Phylogenetic
Risk Analysis. Conservation Biology,22, 1461-1470.
Grassberger, P. (1988) Finite sample corrections to entropy and dimension estimates. Physics
Guiasu, R.C. & Guiasu, S. (2011) The weighted quadratic index of biodiversity for pairs of
species: a generalization of Rao’s index. Natural Science,3, 795-801.
Hardy, O.J. & Jost, L. (2008) Interpreting and estimating measures of community phylogenetic
structuring. Journal of Ecology,96, 849-852.
Hardy, O.J. & Senterre, B. (2007) Characterizing the phylogenetic structure of communities by
an additive partitioning of phylogenetic diversity. Journal of Ecology,95, 493-506.
Havrda, J. & Charvát, F. (1967) Quantification method of classification processes. Concept of
structural -entropy. Kybernetika,3, 30-35.
Herault, B. (2007) Reconciling niche and neutrality through the Emergent Group approach.
Perspectives in Plant Ecology Evolution and Systematics,9, 71-78.
Herault, B., Bachelot, B., Poorter, L., Rossi, V., Bongers, F., Chave, J., Paine, C.E.T., Wagner, F.
& Baraloto, C. (2011) Functional traits shape ontogenetic growth trajectories of rain
forest tree species. Journal of Ecology,99, 1431-1440.
Herault, B. & Honnay, O. (2007) Using life-history traits to achieve a functional classification of
habitats. Applied Vegetation Science,10, 73-80.
Hill, M.O. (1973) Diversity and Evenness: A Unifying Notation and Its Consequences.
Ecology,54, 427-432.
Jost, L. (2006) Entropy and diversity. Oikos,113, 363-375.
Jost, L. (2007) Partitioning diversity into independent alpha and beta components. Ecology,88,
2427-2439.
Loreau, M., Naeem, S., Inchausti, P., Bengtsson, J., Grime, J.P., Hector, A., Hooper, D.U.,
Biodiversity and ecosystem functioning: Current knowledge and future challenges.
Science,294, 804-808.
Marcon, E. & Hérault, B. (2013) entropart, an R package to partition diversity, v. 1.1.1.
http://CRAN.R-project.org/package=entropart.
Marcon, E., Hérault, B., Baraloto, C. & Lang, G. (2012) The Decomposition of Shannon’s
Entropy and a Confidence Interval for Beta Diversity. Oikos,121, 516-522.
Marcon, E., Scotti, I., Herault, B., Rossi, V. & Lang, G. (in press) Generalization of the
partitioning of Shannon diversity. Plos One.
Paine, C.E.T., Baraloto, C., Chave, J. & Herault, B. (2011) Functional traits of individual trees
reveal ecological constraints on community assembly in tropical rain forests. Oikos,120,
720-727.
Patil, G.P. & Taillie, C. (1982) Diversity as a concept and its measurement. Journal of the
American Statistical Association,77, 548-561.
Pavoine, S., Blondel, J., Dufour, A.B., Gasc, A. & Bonsall, M.B. (2013) A New Technique for
Analysing Interacting Factors Affecting Biodiversity Patterns: Crossed-DPCoA. Plos
One,8, e54530.
Pavoine, S., Love, M.S. & Bonsall, M.B. (2009) Hierarchical partitioning of evolutionary and
ecological patterns in the organization of phylogenetically-structured species
assemblages: Application to rockfish (genus: Sebastes) in the Southern California Bight.
Ecology Letters,12, 898-908.
Petchey, O.L. & Gaston, K.J. (2002) Functional diversity (FD), species richness and community
composition. Ecology Letters,5, 402-411.
Podani, J. & Schmera, D. (2007) How should a dendrogram-based measure of functional
diversity function? A rejoinder to Petchey and Gaston. Oikos,116, 1427-1430.
R Development Core Team (2014) R: A Language and Environment for Statistical Computing, v.
3.01. http://www.R-project.org.
Rao, C. & Nayak, T. (1985) Cross entropy, dissimilarity measures, and characterizations of
quadratic entropy. Information Theory, IEEE Transactions on,31, 589-593.
Rao, C.R. (1982) Diversity and dissimilarity coefficients: a unified approach. Theoretical
Population Biology,21, 24-43.
Ricotta, C. (2005) Additive partitioning of Rao's quadratic diversity: a hierarchical approach.
Ecological Modelling,183, 365-371.
Shimatani, K. (2001) On the measurement of species diversity incorporating species differences.
Oikos,93, 135-147.
Tilman, D. (2001) Functional diversity. Encyclopedia of Biodiversity (ed. S.A. Levin).Academic
Press, San Diego.
Tsallis, C. (1988) Possible generalization of Boltzmann-Gibbs statistics. Journal of Statistical
Physics,52, 479-487.
Vane-Wright, R., Humphries, C. & Williams, P. (1991) What to protect: systematics and the
agony of choice. Biological Conservation,55, 235-254.
Vellend, M., Cornwell, W.K., Magnuson-Ford, K. & Mooers, A.O. (2010) Measuring
phylogenetic biodiversity. Biological diversity: frontiers in measurement and assessment
(eds A. Magurran & B. McGill).Oxford University Press, Oxford.
Villeger, S. & Mouillot, D. (2008) Additive partitioning of diversity including species
Warwick, R.M. & Clarke, K.R. (1995) New 'biodiversity' measures reveal a decrease in
taxonomic distinctness with increasing stress. Marine Ecology Progress Series,129,
301-305.
Webb, C.O. (2000) Exploring the phylogenetic structure of ecological communities: An example
for rain forest trees. American Naturalist,156, 145-155.
Webb, C.O., Losos, J.B. & Agrawal, A.A. (2006) Integrating phylogenies into community
ecology. Ecology,87, S1-S2.
Weiher, E., van der Werf, A., Thompson, K., Roderick, M., Garnier, E. & Eriksson, O. (1999)
Challenging Theophrastus: A common core list of plant traits for functional ecology.
Appendix 1: R code of the example
Load the package and the dataset:
library(entropart) data(Paracou618)
Calculate diversity
# Shannon diversity
DivPart(q = 1, Paracou618.MC, Biased = FALSE) # Phylodiversity of order 1 based on the taxonomy
DivPart(q = 1, Paracou618.MC, Biased = FALSE, Tree=Paracou618.Taxonomy) # Functional diversity of order 1
DivPart(q = 1, Paracou618.MC, Biased = FALSE, Tree=Paracou618.Functional) # FD, with bias correction
DivPart(q = 0, Paracou618.MC, Biased = FALSE, Tree=Paracou618.Functional) # Number of species
DivPart(q = 0, Paracou618.MC, Biased = FALSE)
Plotting Fig.2:
data(Paracou618) q <- 1
# Neutral diversity
(Neutral <- DivPart(q, Paracou618.MC, Biased = FALSE)) par(mar = c(5, 5, 2, 2))
plot(c(0, Neutral$GammaDiversity), c(0, Paracou618.MC$Ncommunities), type = "n", xlab = expression(paste(alpha, " / ", gamma, " diversity")), ylab = expression(paste(beta, " diversity")), cex.lab=1.8)
rect(0, 0, Neutral$GammaDiversity, 1, lty=2)
rect(0, 0, Neutral$TotalAlphaDiversity, Neutral$TotalBetaDiversity, lty=2) # Phylogenetic diversity
(Phylo <- DivPart(q, Paracou618.MC, Biased = FALSE, Tree=Paracou618.Taxonomy))
rect(0, 0, Phylo$GammaDiversity, 1, angle=135, density=5)
rect(0, 0, Phylo$TotalAlphaDiversity, Phylo$TotalBetaDiversity, density=5) # Functional diversity
(Functional <- DivPart(q, Paracou618.MC, Biased = FALSE, Tree=Paracou618.Functional))
rect(0, 0, Functional$GammaDiversity, 1, angle=135, density=20)
rect(0, 0, Functional$TotalAlphaDiversity, Functional$TotalBetaDiversity, density=20)
Plotting Fig.3:
Neutral <- DivProfile(seq(0, 2, 0.1), Paracou618.MC, Biased = FALSE)$GammaDiversity
Phylo <- DivProfile(seq(0, 2, 0.1), Paracou618.MC, Tree = Paracou618.Taxonomy, Biased = FALSE)$GammaDiversity
Functional <- DivProfile(seq(0, 2, 0.1), Paracou618.MC, Tree = Paracou618.Functional, Biased = FALSE)$GammaDiversity
par(mar = c(5, 5, 2, 2))
plot(y = Neutral, x = seq(0, 2, 0.1), type = "l", col = "black", lwd = 2, lty=1, xlab = "Order of Diversity", ylab = "Gamma Diversity", ylim = c(1, max(Neutral)), log = "y", cex.lab=1.8, main = "")
lines(y = Phylo, x = seq(0, 2, 0.1), lwd = 2, lty=2) lines(y = Functional, x = seq(0, 2, 0.1), lwd = 2, lty=3)