Publisher’s version / Version de l'éditeur:
Questions? Contact the NRC Publications Archive team at https://publications-cnrc.canada.ca/fra/droits
L’accès à ce site Web et l’utilisation de son contenu sont assujettis aux conditions présentées dans le site LISEZ CES CONDITIONS ATTENTIVEMENT AVANT D’UTILISER CE SITE WEB.
Proceedings of the 2018 Marine Renewables Canada Research Forum,
2018-11-22
READ THESE TERMS AND CONDITIONS CAREFULLY BEFORE USING THIS WEBSITE. https://nrc-publications.canada.ca/eng/copyright
NRC Publications Archive Record / Notice des Archives des publications du CNRC :
https://nrc-publications.canada.ca/eng/view/object/?id=df8ee33e-ecbf-4d21-b9a9-ca5759b6764e
https://publications-cnrc.canada.ca/fra/voir/objet/?id=df8ee33e-ecbf-4d21-b9a9-ca5759b6764e
NRC Publications Archive
Archives des publications du CNRC
This publication could be one of several versions: author’s original, accepted manuscript or the publisher’s version. / La version de cette publication peut être l’une des suivantes : la version prépublication de l’auteur, la version acceptée du manuscrit ou la version de l’éditeur.
Access and use of this website and the material on it are subject to the Terms and Conditions set forth at
Experimental study of the wake produced by single and multiple
hydrokinetic cross-flow turbines
Proceedings of the
2018 Marine Renewables Canada Research Forum
Halifax, Canada, November 20, 2018Copyright ©: Creative Commons CC BY-NC-ND 4.0
EXPERIMENTAL STUDY OF THE WAKE PRODUCED BY SINGLE AND MULTIPLE
HYDROKINETIC CROSS-FLOW TURBINES
MITCHEL PROVAN1, PAUL KNOX2, ANDREW CORNETT3, JULIEN COUSINEAU4
1 National Research Council of Canada, Canada, Mitchel.Provan@nrc.gc.ca 2 National Research Council of Canada, Canada, Paul.Knox@nrc.gc.ca 3 National Research Council of Canada, Canada, Andrew.Cornett@nrc.gc.ca 4 National Research Council of Canada, Canada, Julien.Cousineau@nrc.gc.ca
KEWORDS: Hydrokinetic energy, cross-flow turbines, physical modelling
AREAS OF INTEREST:
Science and Engineering Economics and Finance
☐ Environmental monitoring solutions ☐ Economic costs and benefits
☐ Grid integration ☐ LCOE
☒ Hydrokinetic turbines ☐ Risk mitigation ☐ Marine operations ☐ Financing
☐ Offshore wind ☐
☐ Resource analysis Social
☒ River power ☐ Stakeholder engagement ☐ Subsea geotechnical ☐ Social acceptance ☐ Subsea power systems ☐ Indigenous rights
☐ Tidal power ☐ Supply chain and capacity-building ☐ Wave power ☐ Governance challenges
☐ Small-scale and remote community electrification
Proceedings of the
2018 Marine Renewables Canada Research Forum
Halifax, Canada, November 20, 2018Copyright ©: Creative Commons CC BY-NC-ND 4.0
EXPERIMENTAL STUDY OF THE WAKE PRODUCED BY A SINGLE HYDROKINETIC
CROSS-FLOW TURBINE
KEWORDS: hydrokinetic energy, cross-flow turbines, physical modelling
1 INTRODUCTION
Hydrokinetic energy has the potential to become a viable long-term source of renewable energy, provided that the cost of producing energy can be lowered to competitive levels. Despite considerable efforts and advances in recent years, substantial research and development in many areas is still required to achieve this objective. Deploying multiple turbines in an array is considered the best approach for hydrokinetic project developers to achieve a good business return. However, available information on turbine arrays is limited and there is a need to further learn about the interactions between adjacent turbines, the performance of individual turbines deployed in arrays and the impact of turbine arrays on the flow and surrounding environment. This knowledge will make it possible to optimize turbine array layouts with respect to power generation and environmental footprint by adjusting the turbine configuration, spacing of the turbines and the number and types of turbines deployed.
Scaled experimental model studies have been used to help investigate the wakes produced by a single turbine and multiple turbine placed into an array configuration. Previous studies have used porous plates or discs to represent a simplified turbine or array of turbines without the complexities of a scaled moving turbine. Myers et al. (2010, 2011, 2012) researched the wakes produced by porous discs that were used to represent axial flow turbines, shedding light on various characteristics of the velocity deficits created by these plates for different in-line and in-plane turbine spacings. A similar approach has been applied by Coles et al. (2016) in a study where large turbine arrays were simulated by porous fences where drag forces and velocity distributions downstream of the porous fences were measured. Previous studies have also employed scaled model turbines to characterize the wake of turbine arrays (Stallard et al., 2013 and Mycek et al., 2013; 2014). However, the majority of these studies seem to focus on axial-flow type turbines with a primarily tidal energy application. A study completed by Ordonez-Sanchez et al. (2017) has looked into the wake characteristics of cross-flow turbine arrays where a number of scaled Momentum Reversal and Lift type turbines were used to characterize the flow in three different array layouts. Bachant et al. (2015) measured the downstream wake of a vertical axis, cross-flow type turbine at a relatively large (1:6) scale. This study focused on characterizing the near-field wake and therefore downstream velocity measurements were only taken at 1 turbine diameter downstream.
There exists a knowledge gap in characterizing the far-field downstream wake of a vertical axis cross-flow turbine, which is required in order to efficiently layout these turbines in an array or farm. The current research study being carried out by the authors has the primary goal of providing a set of guidelines that developers can use to layout their hydrokinetic turbine arrays in a riverine environment. The first step of this study is to collect high quality experimental data of the wake characteristics caused by vertical axis cross-flow hydrokinetic turbines that can be used to calibrate and validate a CFD model. The CFD model will be used to study turbine-turbine interactions and the results will be used in a 2D hydrodynamic model to study the turbine array-riverine interactions. The authors have completed a series of tests measuring the downstream wake using porous plates to represent cross-flow turbines (Provan et al., 2018 and Knox et al. 2018). The next phase of the study and the focus of this paper is measuring the downstream wake of scaled rotating model turbines.
2 MODEL SETUP 2.1 Facility
A physical model of a rotating scaled turbine was constructed and installed in NRC-OCRE’s Large Wave Flume (LWF). The dimensions of a typical cross-flow turbine at prototype scale as well as flow speeds were scaled down to a reasonable
2.2 Model Turbine
A model vertical axis cross-flow turbine was designed and fabricated for use in this study. The model turbine was 0.24m high and had a diameter of 0.3m, which produced a blockage ratio of 0.051. Three blades with a NACA 63-021 profile were connected to a vertical shaft by two support arms that were shaped with a NACA-12 profile. The turbine blades and support arms both had a chord length of 0.023m and the length of each blade is 0.24m. The turbine blades and support arms were 3D printed out of nylon to provide a lightweight yet sturdy material which was able to be shaped into the specified blade profile. The turbine shaft was a 0.02m stainless steel rod and was fixed at both the top and bottom to reduce vibrations during operation. The bottom of the shaft was mounted in a marine bearing which was fixed to a load cell mounted on the flume floor. The top of the shaft was connected to a servomotor which was also attached to a load cell. The top load cell was mounted to a steel beam which spanned across the width of the flume. A sketch showing the details of the installed is shown in Figure 1 (left) and the installed turbine is shown in Figure 1 (right).
Figure 1. Left – sketch of the model turbine in the LWF; Right – model turbine installed in the LWF.
2.3 Instrumentation
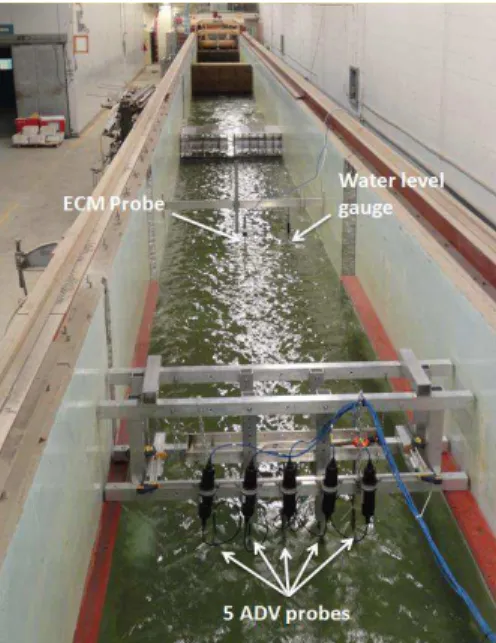
The main goal of the physical model was to measure and map the velocity field downstream of the turbine. Two different types of instruments were used to measure velocities within the model; one 2-axis electromagnetic current meter (ECM) and five 3-axis acoustic Doppler velocimeters (ADV). The single ECM was mounted approximately 25D upstream (where D=0.3m, one turbine diameter) and was used as a reference velocity measurement throughout the entire testing program. The five ADV probes were mounted to an instrumentation rack that was able to move in all 3 dimensions (up/down, left/right, forward/backward) at a 0.1m resolution. In addition to the velocity probes, a capacitance water level gauge was installed near the ECM and was used to measure and track the water level throughout the test program. An overview of the probe placement within the model is shown in Figure 2. Additional instrumentation was used on the model turbine itself. The top of the turbine shaft was connected to a servomotor which provided the additional power required to turn the model turbine at the specified speed while simultaneously recording the RPM and torque of the turbine. Two load cells were installed in the model to measure the drag force acting on the turbine. One load cell was attached to the top of the servomotor and the second load cell was located between the bottom of the shaft and the flume floor. The right image in Figure 1 illustrates the location of the servomotor and the two load cells.
Figure 2. Instrumentation layout in the LWF (looking upstream).
3 RESULTS
The first phase of the study, which involved mapping the downstream wake produced by porous plates, consisted of seven tests which included mapping the free-stream velocities (i.e. no porous plates or turbines present in the flume) throughout the testing section and characterizing the wake downstream of a single porous plate and two adjacent porous plates at two ambient turbulence intensities of 3% and 12%. Further information and results of the porous plate tests can be found in Knox et al. (2018) and Provan et al. (2018). The present study built upon the porous plate tests with an additional two tests involving a scaled model turbine:
Mapping the velocities downstream of a single model turbine with an ambient turbulence intensity of 3%; Mapping the velocities downstream of a single model turbine with an ambient turbulence intensity of 12%; Due to space limitations in this extended abstract, only the results from the single model turbine with an ambient turbulence intensity of 3% will be presented. The presentation will present the results from the two model turbine test series. 3.1 Model turbine with 3% ambient turbulence intensity
This test series consisted of measuring the velocities upstream and downstream of a single model turbine located in the center of the flume. The turbine was installed at the center of the flume at the 0D location with the middle of the turbine installed at a 0.45m depth (z=0.45m). Velocity measurements were taken with all five velocity probes at three different locations in the water column; z=0.25m, z=0.45m and z=0.65m. Measurements in the stream wise direction were taken at every D (i.e. every 0.3m) between 2D-10D and at every 2.5D until 20D downstream of the turbine. A total of 195 individual measurement points were collected throughout this test series.
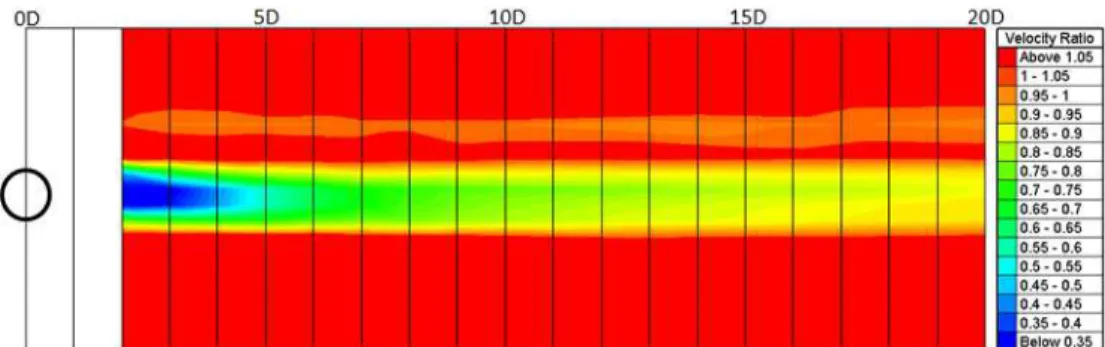
A velocity ratio, which represents the ratio of the velocity with the turbine in the flow compared to the free stream (i.e. no turbine) velocity, was calculated for all 195 individual velocity measurements. This parameter provides an indication of how the turbine influences the downstream velocities. These velocity ratios were used to create a velocity deficit map, shown in Figure 3, by applying linear interpolation between each of the measured points. As seen in Figure 3, the velocities reduce to 30% of the free stream velocity immediately downstream of the turbine due to the turbine removing energy from the flow. This velocity deficit recovers to 60% of the free stream velocity by approximately 5D downstream and to 90% of the free stream velocity by approximately 20D. It should be noted that velocity measurements could not be taken closer than 0.3m to the flume walls. Therefore for the purpose of plotting the wake in Figure 3 the velocity measurement taken closest to the flume walls was also used at the wall.
Figure 3. Velocity deficit downstream of a single turbine at z=0.45m; vertical black lines represent one turbine diameter in distance (i.e. 0.3m).
4 CONCLUSIONS
The second phase of this multi-phase study provided valuable results that can be used to calibrate and validate a CFD model. The wake generated by a scaled model vertical axis cross-flow turbine was mapped by measuring the velocities downstream of the turbine(s). The wake generate by a single turbine is most severe along the horizontal plane at the centerline of the turbine and reduces the velocity to 30% of the free stream velocity up to approximately 4D downstream. The velocity deficit recovers to 90% of the free stream velocity at approximately 20D downstream of the turbine. This gives an approximate location where a second row of turbines could be placed if they were to be placed in-line with the first row of turbines. Future work will include conducted a similar series of tests, but for two cross-flow turbines side by side. The full presentation will provide the results for a single turbine case and preliminary results for the multiple turbine case. In addition, comparison between the results obtained from the scaled model turbine and the results from previously conducted porous plate tests will be made to examine the ability of porous plates to produce a similar downstream wake when compared to scaled model turbines.
ACKNOWLEDGEMENT
The authors would like to thank Natural Resources Canada for funding this study. REFERENCES
Bachant, P. and Wosnik, M., 2015. Characterizing the near-wake of a cross-flow turbine, Journal of Turbulence, 16, 392-410.
Coles, D.S., Blunden, L.S. and Bahaj, A.S., 2016. Experimental validation of the distributed drag method for simulating large marine current turbine arrays using porous fences, International Journal of Marine Energy, 16, 298-316.
Knox, P., Provan, M., Cornett, A., Murphy, E. and Cousineau, J., 2018. Experimental study of velocity deficit and wake due to single and multiple rectangular porous plates in steady flow, Coastlab 2018, Santander, Spain.
Mycek, P., Gaurier, B., Germain, G., Pinon, G. and Rivoalen, R., 2013. Numerical and experimental study of the interaction between two marine current turbines, International Journal of Marine Energy, 1, 70-83.
Mycek, P., Gaurier, B., Germain, G., Pinon, G. and Rivoalen, E., 2014. Experimental study of the turbulence intensity effects on marine current turbines behaviour. Part II: Two interacting turbines, Renewable Energy, 68, 876-892.
Myers, L.E. and Bahaj, A.S., 2010. Experimental analysis of the flow field around horizontal axis tidal turbines by use of scale mesh disk rotor simulators, Ocean Engineering, 37, 218-227.
Myers, L.E., Keogh, B. and Bahaj, A.S., 2011. Experimental investigation of inter-array wake properties in early tidal turbine arrays, Oceans’11 MTS, Waikola, USA.
Myers, L.E. and Bahaj, A.S., 2012. An experimental investigation simulating flow effects in first generation marine current energy converter arrays, Renewable Energy, 37, 28-36.
Ordonez-Sanchez, S., Sutherland, D., Payne, G., Bruce, T., Gebreslassie, M., Belmont, M. and Moon, I., 2017. Experimental evaluation of the wake characteristics of cross flow turbine arrays, Ocean Engineering, 141, 215-226.
Provan, M., Knox, P., Cornett, A. and Cousineau, J., 2018. Experimental study of the wake produced by single and multiple rectangular porous plates, Marine Energy Technology Symposium 2018, Washington, USA.