Update on Ozone-Depleting Substances (ODSs) and
Other Gases of Interest to the Montreal Protocol
Lead Authors: L.J. Carpenter S. Reimann Coauthors: J.B. Burkholder C. Clerbaux B.D. Hall R. Hossaini J.C. Laube S.A. Yvon-Lewis Contributors: D.R. Blake M. Dorf G.S. Dutton P.J. Fraser L. Froidevaux F. Hendrick J. Hu A. Jones P.B. Krummel L.J.M. Kuijpers M.J. Kurylo Q. Liang E. Mahieu J. Mühle S. O'Doherty K. Ohnishi V.L. Orkin K. Pfeilsticker M. Rigby I.J. Simpson Y. Yokouchi Chapter Editors: A. Engel S.A. Montzka[Formatted for double-sided printing.]
From:
WMO (World Meteorological Organization), Scientific Assessment of Ozone Depletion: 2014, Global Ozone Research and Monitoring Project – Report No. 55, 416 pp., Geneva, Switzerland, 2014. This chapter should be cited as:
L.J. Carpenter and S. Reimann (Lead Authors), J.B. Burkholder, C. Clerbaux, B.D. Hall, R. Hossaini, J.C. Laube, and S.A. Yvon-Lewis, Ozone-Depleting Substances (ODSs) and Other Gases of Interest to the Montreal Protocol, Chapter 1 in Scientific Assessment of Ozone Depletion: 2014, Global Ozone Research and Monitoring Project – Report No. 55, World Meteorological Organization, Geneva, Switzerland, 2014.
UPDATE ON OZONE-DEPLETING SUBSTANCES (ODSs)
AND OTHER GASES OF INTEREST TO THE MONTREAL PROTOCOL
Contents
SCIENTIFIC SUMMARY ... 1
1.1 SUMMARY OF THE PREVIOUS OZONE ASSESSMENT ... 5
1.2 LONGER-LIVED HALOGENATED SOURCE GASES ... 5
1.2.1 Updated Observations, Lifetimes, and Emissions ... 5
1.2.1.1 Chlorofluorocarbons (CFCs) ... 6 1.2.1.2 Halons ... 21 1.2.1.3 Carbon Tetrachloride (CCl4) ... 22 1.2.1.4 Methyl Chloroform (CH3CCl3) ... 24 1.2.1.5 Hydrochlorofluorocarbons (HCFCs) ... 24 1.2.1.6 Methyl Chloride (CH3Cl) ... 27 1.2.1.7 Methyl Bromide (CH3Br) ... 28
1.3 VERY SHORT-LIVED HALOGENATED SUBSTANCES (VSLS) ... 31
1.3.1 Abundance, Trends, and Emissions of Very Short-Lived Source Gases ... 37
1.3.1.1 Chlorine-Containing Very Short-Lived Source Gases ... 37
1.3.1.2 Bromine-Containing Very Short-Lived Source Gases ... 38
1.3.1.3 Iodine-Containing Very Short-Lived Source Gases ... 41
1.3.2 Dynamics and Transport of VSLS ... 42
1.3.2.1 Source Gas Injection (SGI) ... 43
1.3.2.2 Product Gas Injection (PGI) ... 46
1.3.2.3 Total VSLS Halogen Input into the Stratosphere ... 47
1.3.3 Potential Influence of VSLS on Ozone ... 50
1.3.4 New Anthropogenic VSLS ... 50
1.4 CHANGES IN ATMOSPHERIC HALOGENS ... 53
1.4.1 Tropospheric and Stratospheric Chlorine Changes ... 53
1.4.1.1 Tropospheric Chlorine Changes ... 53
1.4.1.2 Stratospheric Chlorine Changes ... 55
1.4.2 Tropospheric and Stratospheric Bromine Changes ... 57
1.4.2.1 Tropospheric Bromine Changes ... 57
1.4.2.2 Stratospheric Bromine Changes ... 58
1.4.3 Tropospheric and Stratospheric Iodine Changes ... 60
1.4.3.1 Tropospheric Iodine Changes ... 60
1.4.3.2 Stratospheric Iodine Changes ... 60
1.4.4 Changes in Ozone-Depleting Halogen Abundance in the Stratosphere Based Upon Long-Lived Source Gas Measurements: Equivalent Chlorine (ECl) and Equivalent Effective Stratospheric Chlorine (EESC) ... 60
1.4.5 Fluorine in the Troposphere and Stratosphere ... 62
1.5 CHANGES IN OTHER TRACE GASES THAT INFLUENCE STRATOSPHERIC OZONE AND CLIMATE ... 63
1.5.1 Updates to Mole Fractions, Budgets, Lifetimes, and Observations ... 63
1.5.1.4 COS, SO2 ... 73
1.6 POLICY-RELEVANT INFORMATION HIGHLIGHTS ... 74
1.6.1 HCFCs Becoming a Larger Fraction of Tropospheric Chlorine; Bromine from Halons Now Decreasing ... 74
1.6.2 VSLS Chlorinated Compounds Become More Relevant for Stratospheric Ozone ... 75
1.6.3 Radiative Forcing of ODSs and ODS Replacement Compounds ... 75
1.6.4 GWP-Weighted Emissions of ODS and ODS Replacement Compounds ... 76
1.6.5 Ongoing Mismatch between Estimated Sources of CCl4 from Measurements and from Inventories ... 77
1.6.6 Quarantine and Pre-Shipment (QPS) Consumption of CH3Br Has Exceeded Non-QPS Consumption ... 78
SCIENTIFIC SUMMARY
Changes in the global atmospheric abundance of a substance are determined by the balance between its emissions and removal. Declines observed for ozone-depleting substances (ODSs) controlled under the Montreal Protocol are due to global emission reductions that have made emissions smaller than removals. Most ODSs are potent greenhouse gases. As the majority of ODSs have been phased out, demand for hydrochlorofluorocarbon (HCFC) and hydrofluorocarbon (HFC) substitutes for the substances controlled under the Montreal Protocol has increased; these are also greenhouse gases. HCFCs deplete much less ozone per kilogram emitted than chlorofluorocarbons (CFCs), while HFCs essentially deplete no ozone. The amended and adjusted Montreal Protocol has continued to reduce emissions and atmospheric abundances of most controlled ozone-depleting substances. By 2012, the total combined abundance of anthropogenic ODSs in the troposphere (measured as Equivalent Chlorine) had decreased by nearly 10% from its peak value in 1994.
The contributions to the overall decline in tropospheric chlorine (Cl) and bromine (Br) from substances and groups of substances controlled and not controlled under the Montreal Protocol have changed since the previous Assessment. The observed declines in total tropospheric Cl and Br
from controlled substances during the 5-year period 2008–2012 were 13.4 ± 0.9 parts per trillion (ppt) yr-1
and 0.14 ± 0.02 ppt yr-1, respectively.1
Substances controlled under the Montreal Protocol
• −13.5 ± 0.5 ppt Cl yr-1 from chlorofluorocarbons (CFCs) • −4.1 ± 0.2 ppt Cl yr-1 from methyl chloroform (CH3CCl3)
• −4.9 ± 0.7 ppt Cl yr-1 from carbon tetrachloride (CCl4)
• −0.07 ± 0.01 ppt Cl yr-1 from halon-1211
• +9.2 ± 0.3 ppt Cl yr-1 from hydrochlorofluorocarbons (HCFCs) • −0.06 ± 0.02 ppt Br yr-1 from halons
• −0.08 ± 0.02 ppt Br yr-1 from methyl bromide (CH3Br)
Substances not controlled under the Montreal Protocol • −1.7 ± 1.3 ppt Cl yr-1 from methyl chloride (CH3Cl)
• +1.3 ± 0.2 ppt Cl yr-1 from very short-lived chlorine compounds (predominantly dichloromethane, CH2Cl2)
Tropospheric Chlorine
Total tropospheric chlorine from ODSs continued to decrease between 2009 and 2012 to 3300 parts per trillion (ppt) in 2012. The observed decline in controlled substances of 13.4 ± 0.9 ppt Cl yr-1 during
2008–2012 was in line with the A1 (baseline) scenario of the 2010 Assessment.
Of total tropospheric Cl in 2012:
• CFCs, consisting primarily of CFC-11, -12, and -113, accounted for 2024 ± 5 ppt (about 61%)
and are declining. Their relative contribution is essentially unchanged from the 2010 Assessment
(62% in 2008).
• CCl4 accounted for 339 ± 5 ppt (about 10%). While our current understanding of the budget of CCl4 is incomplete, mole fractions of CCl4 declined largely as projected based on prior observations
and the A1 scenario of the 2010 Assessment during 2009–2012.
• HCFCs accounted for 286 ± 4 ppt (8.7%). In total, the rate of increase for the sum of HCFCs has slowed by 25% since 2008 and has been lower than projected in the 2010 Assessment.
• CH3CCl3, the largest contributor to the decrease in total tropospheric chlorine until around 2005, accounted for only 16 ± 1 ppt (0.5%). This is 50% less than in 2008 (32 ppt) and a 95%
reduction from its mean contribution to the total Cl decline during the 1980s. The fraction is declining in line with the A1 scenario of the 2010 Assessment.
• CH3Cl accounted for 540 ± 5 ppt (about 16%) and has remained essentially constant since 2008. This gas is emitted predominantly from natural sources.
• Very short-lived compounds (VSLS) contribute approximately 3%.
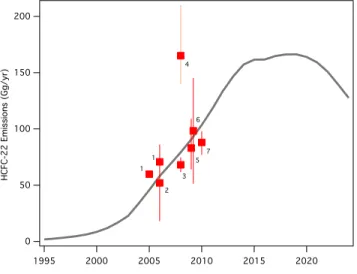
Global emissions of HCFCs remain substantial, but relative emissions of individual constituents have changed notably since the last Assessment. Emissions of HCFC-22 have stabilized since 2008 at
around 370 gigagrams per year (Gg yr-1). HCFC-142b emissions decreased in the same period. In contrast
emissions of HCFC-141b have increased since the last Assessment, in parallel with reported production and consumption in Article 5 Parties.
Estimated sources and sinks of CCl4 remain inconsistent with observations of its abundance. The estimate of the total global lifetime (26 years) combined with the observed CCl4 trend in the atmosphere
(−1.1 to −1.4 ppt yr-1 in 2011–2012) implies emissions of 57 (40–74) Gg yr-1, which cannot be reconciled
with estimated emissions from net reported production. New evidence indicates that other poorly quantified sources, unrelated to reported production, could contribute to the currently unaccounted emissions.
Three CFCs (CFC-112, -112a, -113a) and one HCFC (HCFC-133a) have recently been detected in the atmosphere. These four chlorine-containing compounds are listed in the Montreal Protocol and
contribute about 4 ppt or ~ 0.1% toward current levels of total chlorine, currently adding less than 0.5 ppt Cl yr-1. Abundances of CFC-112 and CFC-112a are declining and those of CFC-113a and HCFC-133a are increasing. The sources of these chemicals are not known.
Stratospheric Inorganic Chlorine and Fluorine
Hydrogen chloride (HCl) is the major reservoir of inorganic chlorine (Cly) in the mid- to upper strat-osphere. Satellite-derived measurements of HCl (50°N–50°S) in the mid- to upper stratosphere show a mean decline of 0.6% ± 0.1% yr-1 between 1997 and 2012. This is consistent with the measured
changes in controlled chlorinated source gases. Variability in this decline is observed over shorter time
periods based on column measurements above some ground-based sites, likely due to dynamic variability.
Measured abundances of stratospheric fluorine product gases (HF, COF2, COClF) increased by about 1% yr-1 between 2008 and 2012. This is consistent with increases in measured abundances of
fluorinated compounds and their degradation products. The increase was smaller than in the beginning of the 1990s, when the concentrations of fluorine-containing ODSs were increasing more rapidly.
Tropospheric Bromine
Total organic bromine from controlled ODSs continued to decrease in the troposphere and by 2012 was 15.2 ± 0.2 ppt, approximately 2 ppt below peak levels observed in 1998. This decrease was close to
that expected in the A1 scenario of the 2010 Assessment and was primarily driven by declines in methyl bromide (CH3Br), with some recent contribution from an overall decrease in halons. Total bromine from
halons had stopped increasing at the time of the last Assessment, and a decrease is now observable.
CH3Br mole fractions continued to decline during 2008–2012, and by 2012 had decreased to 7.0 ± 0.1 ppt, a reduction of 2.2 ppt from peak levels measured during 1996–1998. These atmospheric
declines are driven primarily by continued decreases in total reported consumption of CH3Br from
fumigation. As of 2009, reported consumption for quarantine and pre-shipment (QPS) uses, which are exempted uses (not controlled) under the Montreal Protocol, surpassed consumption for controlled
(non-QPS) uses. As a result of the decrease in atmospheric CH3Br, the natural oceanic source is now
comparable to the oceanic sink.
Stratospheric Inorganic Bromine
Total inorganic stratospheric bromine (Bry), derived from observations of bromine monoxide (BrO), was 20 (16–23) ppt in 2011, and had decreased at ~0.6 ± 0.1% yr-1 between peak levels observed in 2000–2001 and 2012. This decline is consistent with the decrease in total tropospheric
organic Br based on measurements of CH3Br and the halons.
Equivalent Effective Stratospheric Chlorine (EESC)
EESC is a sum of chlorine and bromine derived from ODS tropospheric abundances weighted to reflect their expected depletion of stratospheric ozone. The growth and decline in EESC depends on a given tropospheric abundance propagating to the stratosphere with varying time lags (on the order of years) associated with transport. Therefore the EESC abundance, its peak timing, and its rate of decline, are different in different regions of the stratosphere.
By 2012, EESC had declined by about 10% in polar regions and about 15% in midlatitudes from their peak values, with CH3CCl3, CH3Br, and CFCs contributing approximately equally to these declines. This drop is about 40% of the decrease required for EESC in midlatitudes to return to the 1980 benchmark level, and about 20% of the decrease required for EESC in polar regions to return to the 1980 benchmark level.
Very Short-Lived Halogenated Substances (VSLS)
VSLS are defined as trace gases whose local lifetimes are comparable to, or shorter than, interhemispheric transport timescales and that have non-uniform tropospheric abundances. These local lifetimes typically vary substantially over time and space. As in prior Assessments, we consider species with annual mean lifetimes less than approximately 6 months to be VSLS. Of the VSLS identified in the current atmosphere, brominated and iodinated species are predominantly of oceanic origin, while the chlorinated species have significant industrial sources. These compounds will release their halogen atoms nearly immediately once they enter the stratosphere. The current contribution of chlorinated VSLS to Equivalent Chlorine (ECl) is about one-third as large as the contribution of VSLS brominated gases. Iodine from VSLS likely makes a minor contribution to ECl.
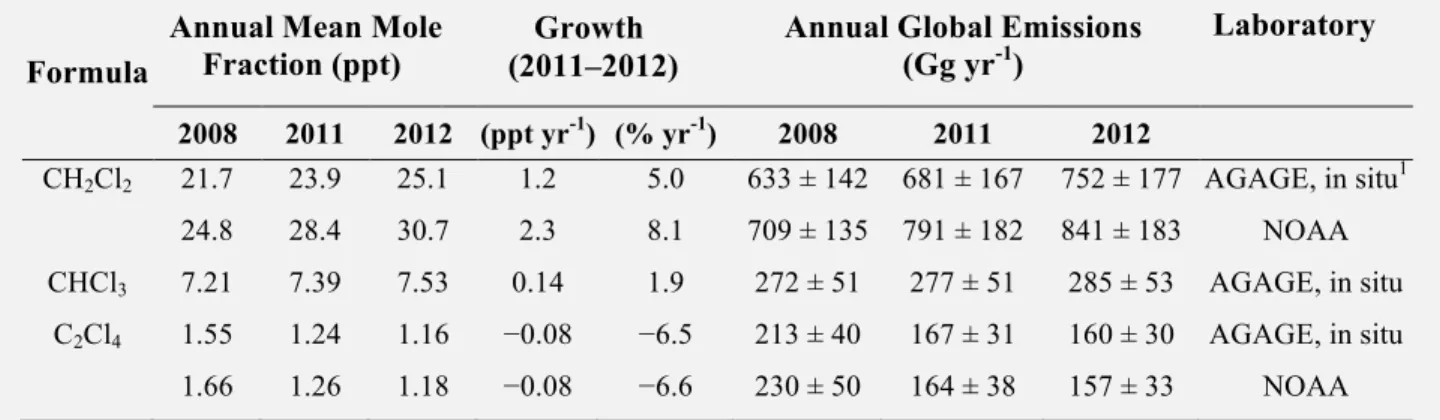
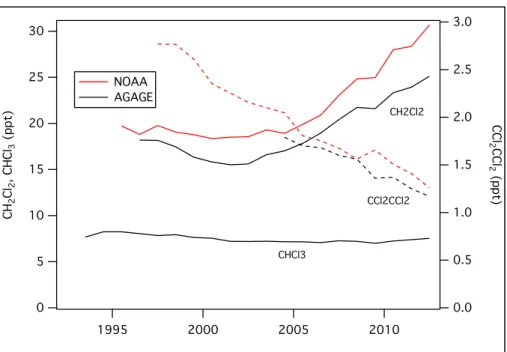
Total chlorinated VSLS source gases increased from 84 (70–117) ppt in 2008 to 91 (76–125) ppt in 2012 in the lower troposphere. Dichloromethane (CH2Cl2), a VSLS that has predominantly
anthro-pogenic sources, accounted for the majority of this change, with an increase of ~60% over the last decade.
The estimated contribution of chlorinated VSLS to total stratospheric chlorine remains small. A
lack of data on their concentrations in the tropical tropopause layer (TTL) limits our ability to quantify their contribution to the inorganic chlorine loading in the lower stratosphere. Current tropospheric concentrations of chlorinated VSLS imply a source gas injection of 72 (50–95) ppt, with 64 ppt from anthropogenic emissions (e.g., CH2Cl2, CHCl3, 1,2 dichloroethane (CH2ClCH2Cl), tetrachloroethene
(CCl2CCl2)). The product gases are estimated to contribute 0–50 ppt giving a total of ~ 95 ppt (50–145
ppt) against a total of 3300 ppt of chlorine from long-lived ODSs entering the stratosphere.
There is further evidence that VSLS contribute ~5 (2–8) ppt to a total of ~20 ppt of stratospheric bromine. Estimates of this contribution from two independent approaches are in agreement. New data
suggest that previous estimates of stratospheric Bry derived from BrO observations may in some cases
have been overestimated, and imply a contribution of ~5 (2–8) ppt of bromine from VSLS. The second approach sums the quantities of observed, very short-lived source gases around the tropical tropopause with improved modeled estimates of VSLS product gas injection into the stratosphere, also giving a total contribution of VSLS to stratospheric bromine of ~5 (2–8) ppt.
Updated Lifetime Estimates
The uncertainties of estimated lifetimes for key long-lived ozone-depleting and related substances are better quantified following the SPARC Lifetimes Assessment (Stratosphere-troposphere Processes And their Role in Climate, 2013). Of note is the change in the estimated lifetime of CFC-11
(revised from 45 yr to 52 yr). The estimate of the total global lifetime of CCl4 (26 yr) remains unchanged
from the previous Assessment, although estimates of the relative importance of the multiple loss processes have been revised.
Other Trace Gases That Directly Affect Ozone and Climate
The emissions of CFCs, HCFCs, and HFCs in terms of their influence on climate (as measured by gigatonnes of carbon dioxide (CO2)-equivalent emissions) were roughly equal in 2012. However, the emissions of HFCs are increasing rapidly, while the emissions of CFCs are going down and those of HCFCs are essentially unchanged. The 100-year GWP-weighted emissions for the sum of CFC, HCFC,
and HFC emissions was 2.2 Gt CO2-equivalent in 2012. The sum of GWP-weighted emissions of CFCs
was 0.73 ± 0.25 Gt CO2-equivalent yr-1 in 2012 and has decreased on average by 11.0 ± 1.2% yr-1 from
2008 to 2012. The sum of HCFC emissions was 0.76 ± 0.12 Gt CO2-equivalent yr-1 in 2012 and has been
essentially unchanged between 2008 and 2012. Finally, the sum of HFC emissions was 0.69 ± 0.12 Gt CO2-equivalent yr-1 in 2012 and has increased on average by 6.8 ± 0.9% yr-1 from 2008 to 2012. The HFC
increase partially offsets the decrease by CFCs. Current emissions of HFCs are, however, are less than 10% of peak CFC emissions in the early 1990s (>8 Gt CO2-equivalent yr-1).
From 2008 to 2012 the global mean mole fraction of nitrous oxide (N2O), which leads to ozone depletion in the stratosphere, increased by 3.4 parts per billion (ppb), to 325 ppb. With the
atmospheric burden of CFC-12 decreasing, N2O is currently the third most important long-lived
greenhouse gas contributing to radiative forcing (after CO2 and methane (CH4)).
Methane (CH4) is an important greenhouse gas and influences stratospheric ozone. In 2012 the average background global mole fraction of CH4 was 1808 ppb, with a growth rate of 5–6 ppb yr-1 from 2008 to 2012. This is comparable to the 2006–2008 period when the CH4 growth rate began increasing again after
several years of near-zero growth. The renewed increase is thought to result from a combination of increased CH4 emissions from tropical and high-latitude wetlands together with increasing anthropogenic
(fossil fuel) emissions, though the relative contribution of the wetlands and fossil fuel sources is uncertain.
Hydrofluorocarbons (HFCs) used as ODS substitutes are increasing in the global atmosphere. The
most abundant HFC, HFC-134a, reached a mole fraction of nearly 68 ppt in 2012 with an increase of 5 ppt yr-1 (7.6%) in 2011–2012. HFC-125, -143a, and -32 have similar or even higher relative growth rates
than HFC-134a, but their current abundances are considerably lower.
Worldwide emissions of HFC-23, a potent greenhouse gas and by-product of HCFC-22 production, reached a maximum of ~15 Gg in 2006, decreased to ~9 Gg in 2009, and then increased again to reach ~13 Gg yr-1 in 2012. While efforts in non-Article 5 Parties mitigated an increasing portion of HFC-23 emis-sions through 2004, the temporary decrease in emisemis-sions after 2006 is consistent with destruction of HFC-23 in Article 5 Parties owing to the Clean Development Mechanism (CDM) of the Kyoto Protocol. The average global mole fraction of HFC-23 reached 25 ppt in 2012, with an increase of nearly 1 ppt yr-1 in recent years.
Mole fractions of sulfur hexafluoride (SF6), nitrogen trifluoride (NF3), and sulfuryl fluoride (SO2F2) increased in recent years. Global averaged mole fractions of SF6 reached 7.6 ppt in 2012, with an annual
increase of 0.3 ppt yr-1 (4% yr-1). Global averaged mole fractions of NF
3 reached 0.86 ppt in 2011, with an
annual increase of 0.1 ppt yr-1 (12% yr-1). Global averaged mole fractions of SO2F2 reached 1.8 ppt in
2012, with an annual increase of 0.1 ppt yr-1 (5% yr-1). The considerable increases for these entirely
1.1 SUMMARY OF THE PREVIOUS OZONE ASSESSMENT
Chapter 1 of the 2010 Assessment report (Montzka and Reimann et al., 2011) provided evidence of continued reductions of the atmospheric abundance of most ozone-depleting substances (ODSs), resulting from phase-out of controlled ODS production and consumption under the Montreal Protocol. Total tropospheric chlorine and bromine from long-lived chemicals continued to decrease between 2005 and 2008. The atmospheric reservoir for methyl chloroform (CH3CCl3) had reduced to the point that its
contribution to the chlorine decline was surpassed by the chlorofluorocarbons (CFCs). Mole fractions of CFC-12, the single largest contributor to the atmospheric chlorine loading, declined for the first time in this period. The total tropospheric chlorine decline was however slower than expected because the sum of the CFC mole fractions did not drop as rapidly as projected and increases in hydrochlorofluorocarbons (HCFCs) were larger than anticipated. The stratospheric chlorine burden declined in accordance with the tropospheric decrease, within expected uncertainties. Chlorine-containing very short-lived substances (VSLS) and their degradation products contributed approximately 80 ppt (parts per trillion) of chlorine to the stratosphere, which was about 2% of the contribution from the longer-lived ODSs.
Chapter 1 of the 2010 Assessment documented the continued discrepancy between emissions of car-bon tetrachloride (CCl4) inferred from observed global trends with the much lower and more variable emissions
derived from data reported to the United Nations Environment Programme (UNEP). These differences could not solely be explained by scaling the atmospheric lifetime. For other important ODSs (e.g., CFC-11), there was evidence that atmospheric lifetimes might be longer than reported in previous Assessments.
Tropospheric mole fractions of hydrofluorocarbons (HFCs), used as non-ozone-depleting ODS substitutes, continued to increase, which was reflected by an increase in column abundances of hydrogen fluoride (HF), one of their major degradation products. In total the sum of HFC emissions used as ODS replacements, weighted by direct, 100-year Global Warming Potentials (GWPs), increased by nearly 10% yr-1 from 2004 to 2008. In addition, emissions of the very potent greenhouse gas HFC-23 (CHF
3), which
was mainly released from the production of HCFC-22 and therefore not labeled as an ODS replacement, had increased despite efforts to curb HFC-23 emissions.
The only regulated bromine compound still not decreasing in 2008 was halon-1301. The total tropospheric bromine levels from long-lived ODSs, however, continued to decrease because of the declining abundance of methyl bromide (CH3Br) and because the sum of halons had stopped increasing. For the first
time, measurements of stratospheric bromine showed a slight decrease over this period. Slightly more than 50% of the atmospheric bromine stemmed from sources not controlled by the Montreal Protocol (i.e., from natural sources and from quarantine and pre-shipment (QPS) uses of CH3Br). The contribution from mostly
natural short-lived compounds such as dibromomethane (CH2Br2) and tribromomethane (CHBr3) and their
degradation products to stratospheric bromine was estimated to be 1–8 ppt, which contributed substantially to the estimated total of 22.5 ppt of bromine in the stratosphere in 2008.
Equivalent Effective Stratospheric Chlorine (EESC) represents the overall influence on stratospheric ozone levels from the sum of the tropospheric abundances of chlorine and bromine ODSs. A discussion of the EESC concept can be found in Box 8-1 of the 2006 Assessment (Daniel and Velders, 2007). By the end of 2008, the EESC abundance in the midlatitude stratosphere had decreased by about 11% from its peak value in 1997. This represented 28% of the decrease required for EESC in the midlatitude stratosphere to return to the 1980 benchmark level. In the polar stratosphere, EESC had decreased by about 5% from its peak value in 2002, which is 10% of the decrease required for EESC in polar regions to return to the 1980 benchmark level.
1.2 LONGER-LIVED HALOGENATED SOURCE GASES
1.2.1 Updated Observations, Lifetimes, and Emissions
Global tropospheric observations of ODSs have been performed and updated by independent groups using both in situ and flask measurements as early as the late 1970s (Figure 1-1, Table 1-1). Data
from networks with global coverage (AGAGE: Advanced Global Atmospheric Gases Experiment; NOAA: National Oceanic and Atmospheric Administration; UCI: University of California, Irvine) are discussed primarily, except for substances where data from only one global network are available. For some ODSs, surface observations have been complemented with trends of total column measurements using satellite- and ground-based remote sensing techniques (Table 1-2).
Global steady-state lifetime estimates of the main ODSs and related substances appear in Table 1-3. Most are taken directly from SPARC (2013) and were derived from a weighted average of the lifetimes using different methods. Global steady-state lifetimes are derived from a combination of partial lifetimes for tropospheric hydroxyl radical (OH) reactive loss, stratospheric loss, and ocean and soil loss. Furthermore, updates to atmospheric budgets (emissions and sinks) of ODSs are discussed. Global mean mole fractions, trends, and emissions were calculated by combining the global network data with a two-dimensional model (Rigby et al., 2013, 2014).
1.2.1.1 CHLOROFLUOROCARBONS (CFCS)
Observations
The global surface mean dry air mole fractions of the three most abundant chlorofluorocarbons (CFC-12 (CCl2F2), CFC-11 (CCl3F), and CFC-113 (CCl2FCClF2)) continued to decline since the last
Assessment (Figure 1-1 and Table 1-1). Between 2008 and 2012 the trends observed for these three ODSs are consistent (within uncertainties) with those anticipated in the A1-2010 scenario (Daniel and Velders et al., 2011). For these three ODSs, differences in global abundances estimated by the three global networks in Table 1-1 were less than 1% in 2011–2012. This is comparable to differences of 1–2% for the measurement of these substances evaluated within the International Halocarbons in Air Comparison Experiment (IHALACE) (Hall et al., 2014). Differences between the global networks are used not only for estimating the uncertainty of the measurement data themselves, but also for assessing the accuracy and reliability of global emission estimates, which make use of these data.
Recent changes in the Northern Hemisphere abundances of CFC-11, CFC-12, and CFC-113 measured by ground-based infrared solar absorption spectroscopy (e.g., Zander et al., 2008) and space-based instruments (Brown et al., 2011; Kellmann et al., 2012) are largely consistent (within uncertainties) with those measured at the surface between 2004 and 2010 (Figure 1-2 and Table 1-2). Only CFC-113 from Atmospheric Chemistry Experiment-Fourier Transform Spectrometer (ACE-FTS) (Brown et al., 2011) shows a faster decrease than the ground-based measurements, which could be caused by measurement issues in the space-based instrument for this compound.
Global mole fractions of both CFC-114 (CClF2CClF2) and CFC-115 (CClF2CF3) have remained
nearly constant since 2008 (Table 1-1). Measurements of CFC-114 include a fraction due to CFC-114a (CCl2FCF3), which is estimated to be around 10%, based on measurements in the 1990s (Oram, 1999).
Furthermore, CFC-112(CCl2FCCl2F), -112a (CClF2CCl3), -113a (CCl3CF3), and HCFC-133a (CH2ClCF3)
(Section 1.2.1.5) were recently determined to be present in the atmosphere, with mole fractions of less than 1 ppt in 2010 (Laube et al., 2014). Abundances of CFC-112 and CFC-112a are declining but those of CFC-113a (and HCFC-133a) are increasing. These newly detected ODSs are listed in the Montreal Protocol and contribute about 4 ppt or ~ 0.1% toward current levels of total chlorine, currently adding less than 0.5 ppt Cl yr-1.
Lifetimes and emissions
For CFC-11, a longer steady-state lifetime of 52 (43–67) years was recommended by SPARC (2013) compared with the 45-year lifetime used in the previous Assessments. Since the SPARC (2013) evaluation, a new CFC-11 UV absorption spectrum data set was reported by McGillen et al. (2013) that significantly reduced the overall estimated uncertainty in the CFC-11 spectrum from ~20%, as reported in SPARC (2013), to ~4%. This leads to a substantially reduced contribution to the CFC-11 lifetime uncertainty due to uncertainties in CFC-11 photolysis. The recommended CFC-11 steady-state lifetime of SPARC (2013) and its estimated uncertainty range, however, do not change significantly as a result. In
SPARC (2013) the lifetime and its range were primarily determined by the differences between observational data and various 3-D model calculations.
Another notable change discussed in SPARC (2013) was for CFC-115, for which the total lifetime was revised from 1020 to 540 years based on new O(1D) + CFC-115 reaction rate data from Baasandorj et al. (2013).
Results since SPARC (2013) include a suggested revision of the CFC-113a lifetime from ~45 to 59 (31–305) years by Laube et al. (2014), although uncertainties of the new estimate include the old number.
Global top-down emissions of CFC-11 derived from atmospheric observations, considering its new lifetime of 52 years, have been declining slowly over the past decade and are estimated to have been 57 (46–68) Gg in 2012 (Figure 1-3). Bottom-up estimated emissions are only available until 2003 and averaged 73 Gg yr-1 in the period 2000–2003 (UNEP, 2006). This was 19 Gg yr-1 smaller than estimated
emissions using measurement-based top-down methods and a 52-year lifetime (Figure 1-3). The increase of the lifetime estimate from 45 years to 52 years considerably reduces the gap for CFC-11 emission estimates by the two methods from the previous Assessment (Montzka and Reimann et al., 2011).
Global CFC-12 emissions have been declining more rapidly than those of CFC-11. Top-down estimates (Figure 1-3) indicate emissions of CFC-12 were decreasing at a rate of ~7 Gg yr-1 in recent
years to 40 (26–54) Gg in 2012. Global CFC-113 emissions have been consistently lower than 5 Gg yr-1
over recent years.
Emissions of the newly detected CFC-113a were estimated at 2 Gg in 2012 (Figure 1-3) and they could be caused by its usage as an intermediate in agrochemical production (Laube et al., 2014) or as a feedstock for HFC-125 (CHF2CF3) and HFC-134a (CH2FCF3) production (UNEP, 2013a). Although
global production numbers for these HFCs are not available, the rapid increases in mole fractions and global emissions of HFC-125 and HFC-134a in the atmosphere (Figures 1-24, 1-25, and Table 1-14) indicate the potential for increasing releases of CFC-113a.
Measurements within specific regions and meteorological models are used to estimate emissions of ODSs and other halocarbons on regional scales. These regional source estimates are prone to considerable uncertainties due to inaccuracies in meteorological data, transport models, and in some instances, seasonal variations of emission. The summed effect of the errors in these parameters and their extrapolations can lead to large uncertainties for estimated regional emissions (see, e.g., Figure 1-4). When studied regions are substantially different from national scales, additional errors can be introduced by extrapolation of the regional estimates to national scales, which are often compared to national inventory-based estimates. Regional emissions of CFC-11, -12, and -113 were predominantly estimated to be from East Asia in recent years, due to the phase-out of these compounds in important Article 5 countries in 2010. In Figure 1-4 historical and projected bottom-up emissions in China (Wan et al., 2009) are compared with top-down regional emissions derived from atmospheric measurements (Palmer et al., 2003; Vollmer et al., 2009; Kim et al., 2010; An et al., 2012; Fang et al., 2012). The concurrent decline of emissions seen by both independent methods (top-down and bottom-up) shows the success of the Montreal Protocol in substantially decreasing CFC emissions in China. In 2000 CFC-12 top-down emission estimates were more than a factor of two higher than inventory-based estimates, but both estimates compare better in most recent years. Whereas CFC-11 emissions are still substantial but also declining, both top-down and bottom-up emissions of CFC-113, which was mostly used as a solvent, were found to be consistently small in recent years. However, measurements of these CFCs in urban environments in China, for example in the Pearl River Delta (Shao et al., 2011; Wu et al., 2014), still show mole fraction enhancements above background levels, indicating ongoing emissions from in-use equipment.
Recent estimates of emissions of CFC-11 and CFC-12 in the U.S. and Europe (Millet et al., 2009; Miller et al., 2012; Keller et al., 2012) were still comparable to those in China, although new production of CFCs for use was restricted in the U.S. and Europe in 1996/1995 (i.e., 14/15 years ahead of restrictions in China). For CFC-113, enhancements above background levels were not detected in the U.S. by Gentner et al. (2010) or Millet et al. (2009), suggesting very low emissions in this region of the world. In a source-specific study, Hodson et al. (2010) found that landfills were only small sources of CFC-11, CFC-12, and CFC-113 in the U.S. and in the United Kingdom.
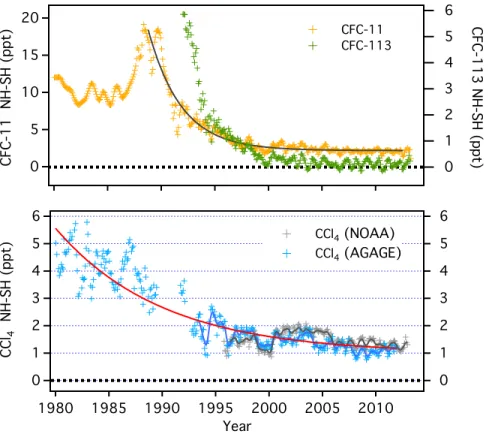
Figure 1-1. Mean global surface mole fractions (expressed as dry air mole fractions in parts per trillion or ppt) of ozone-depleting substances from independent sampling networks and from scenario A1 of the previous Ozone Assessments (Daniel and Velders et al., 2007, 2011) over the past 22 years (1990–2012). Measured global surface annual means are shown as red lines (NOAA data), black lines (AGAGE data), and blue lines (University of East Anglia (UEA) Southern Hemisphere (S.H.) data, (continued next page)
(Figure 1-1, continued) using Cape Grim archived air). Mole fractions from scenario A1 from the previous assessment (green lines) were derived to match observations in years before 2009 (Daniel and Velders et al., 2011). The scenario A1-2010 results shown in years after 2008 are projections made for 2009. Mole fractions from scenario A1 from the 2006 Assessment (green-dashed lines) were derived to match observations in years before 2005 (Daniel and Velders et al., 2007). The scenario A1-2006 results shown in years after 2004 are projections made in 2005.
Table 1-1. Measured mole fractions and changes of ozone-depleting gases from ground-based sampling networks. Chemical Formula Common or Industrial Name Annual Mean Mole Fraction (ppt) 2008 2011 2012 Change (2011–2012) (ppt yr-1) (% yr-1) Network, Method CFCs CCl3F CFC-11 243.4 237.6 235.5 −2.1 −0.9 AGAGE, in situ 1
244.8 238.6 236.3 −2.3 −1.0 NOAA, flask & in situ
244.2 237.9 235.3 −2.6 −1.1 UCI, flask
CCl2F2 CFC-12 537.5 530.4 527.5 −2.9 −0.5 AGAGE, in situ
535.3 527.2 524.4 −2.9 −0.5 NOAA, flask & in situ
532.6 525.3 522.5 −2.8 −0.5 UCI, flask
CCl2FCCl2F CFC-112 0.45 0.45 0.44 −0.01 −2 UEA, flask (Cape Grim)
CCl3CClF2 CFC-112a 0.065 0.066 0.064 −0.002 −3 UEA, flask (Cape Grim)
CCl2FCClF2 CFC-113 76.7 74.4 73.6 −0.8 −1.1 AGAGE, in situ
76.5 74.5 73.8 −0.6 −0.8 NOAA, flask & in situ
77.1 74.9 74.2 −0.7 −0.9 UCI, flask
CCl3CF3 CFC-113a 0.39 0.44 0.48 0.04 10 UEA, flask (Cape Grim)
CClF2CClF2 CFC-114 2 16.46 16.37 16.33 −0.04 −0.2 AGAGE, in situ
15.95 15.77 15.75 −0.02 −0.1 NIES, in situ (Japan)
CClF2CF3 CFC-115 8.38 8.39 8.40 0.01 0.2 AGAGE, in situ
8.32 8.44 8.48 0.04 0.5 NIES, in situ (Japan) HCFCs
CHClF2 HCFC-22 191.8 214.2 219.8 5.6 2.6 AGAGE, in situ
190.9 212.7 218.0 5.3 2.5 NOAA, flask
188.3 209.0 214.5 5.5 2.6 UCI, flask
CHClFCF3 HCFC-124 1.48 1.34 1.30 −0.04 −3 AGAGE, in situ
CH2ClCF3 HCFC-133a 0.275 0.313 0.365 0.052 17 UEA, flask (Cape Grim)
CH3CCl2F HCFC-141b 19.5 21.4 22.5 1.1 5.1 AGAGE, in situ 19.3 21.3 22.3 1.0 4.4 NOAA, flask 18.8 20.8 21.8 1.0 4.8 UCI, flask CH3CClF2 HCFC-142b 19.0 21.5 22.0 0.5 2.4 AGAGE, in situ 18.5 20.9 21.3 0.4 2.0 NOAA, flask 18.0 21.0 21.8 0.8 3.8 UCI, flask Halons
CBr2F2 halon-1202 0.026 0.020 0.019 −0.001 −5 UEA, flask (Cape Grim)
Chemical Formula Common or Industrial Name Annual Mean Mole Fraction (ppt) 2008 2011 2012 Change (2011–2012) (ppt yr-1) (% yr-1) Network, Method Table 1-1, continued.
CBrClF2 halon-1211 4.29 4.09 4.01 −0.08 −2.0 AGAGE, in situ
4.20 4.00 3.92 −0.08 −2.0 NOAA, flask 3
4.25 4.03 3.96 −0.07 −1.7 NOAA, in situ
4.24 4.18 4.14 −0.04 −1.0 UCI, flask
CBrF3 halon-1301 3.20 3.27 3.30 0.03 0.9 AGAGE, in situ
3.12 3.18 3.22 0.04 1.1 NOAA, flask
CBrF2CBrF2 halon-2402 0.47 0.45 0.44 −0.01 −1.3 AGAGE, in situ 4
0.47 0.45 0.44 −0.01 −1.4 NOAA, flask
0.41 0.394 0.387 −0.007 −2 UEA, flask (Cape Grim) Chlorocarbons
CH3Cl methyl chloride 544.2 530.3 537.1 6.8 1.3 AGAGE, in situ
546.6 537.1 542.2 5.0 0.9 NOAA, flask
546 - - - - NOAA, in situ
CCl4 carbon
tetrachloride
88.6 85.2 84.2 −1.1 −1.2 AGAGE, in situ
90.5 86.4 85.1 −1.4 −1.6 NOAA, flask & in situ
91.5 87.8 86.7 −1.1 −1.3 UCI, flask CH3CCl3 methyl chloroform 10.6 6.26 5.20 −1.06 −17 AGAGE, in situ 10.8 6.31 5.25 −1.06 −17 NOAA, flask 11.5 6.8 5.7 −1.1 −16 UCI, flask Bromocarbons
CH3Br methyl bromide 7.47 7.14 7.07 −0.11 −1.0 AGAGE, in situ
7.33 7.07 6.95 −0.12 −1.7 NOAA, flask
Mole fractions in this table represent independent estimates measured by different groups for the years indicated. Results in bold text are estimates of global surface mean mole fractions. Regional data from relatively unpolluted sites are shown (in italics) where global estimates are not available, where global estimates are available from only one network, or where data from global networks do not represent independent calibration scales (e.g., halon-2402). Absolute changes (ppt yr-1) are calculated as the
difference in annual means; relative changes (% yr-1) are the same difference relative to the 2011 value. Small differences between values from previous Assessments are due to changes in calibration scale and methods for estimating global mean mole fractions from a limited number of sampling sites.
These observations are updated from the following sources: Rowland et al. (1982); Butler et al. (1998); Fraser et al. (1999); Montzka et al. (1999); Oram (1999); Montzka et al. (2000); Prinn et al. (2000); Montzka et al. (2003); O’Doherty et al. (2004); Yokouchi et al. (2006); Simpson et al. (2007); Miller et al. (2008); Montzka et al. (2009); Newland et al. (2013); Laube et al. (2014). AGAGE, Advanced Global Atmospheric Gases Experiment (http://agage.eas.gatech.edu/); NOAA, National Oceanic and Atmospheric Administration, U.S. (http://www.esrl.noaa.gov/gmd/dv/site/); UEA, University of East Anglia, United Kingdom (http://www.uea.ac.uk/environmental-sciences/research/marine-and-atmospheric-sciences-group); UCI, University of California, Irvine, U.S. (http://ps.uci.edu/~rowlandblake/research_atmos.html); NIES, National Institute for Environmental Studies, Japan (http://db.cger.nies.go.jp/gem/moni-e/warm/Ground/st01.html). Cape Grim: Cape Grim Baseline Air Pollution Station, Australia. Notes: 1Global mean estimates from AGAGE are calculated using atmospheric data and a 12-box model (Cunnold et al., 1983;
Rigby et al., 2013). AGAGE calibrations as specified in CDIAC (2014) and related primary publications. 2Measurements of CFC-114 are a combination of CFC-114 and the CFC-114a isomer, with an assumed relative contribution of 10% CFC-114a (Oram, 1999). 3The NOAA halon-1211 data have been updated following an instrument change in 2009. 4AGAGE halon-2402
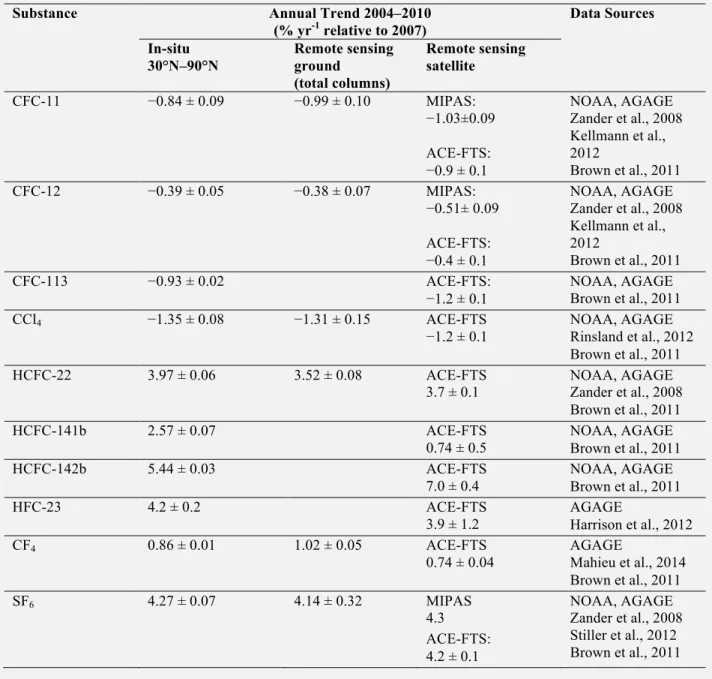
Table 1-2. Comparison of annual trends of ODSs, HFC-23, CF4, and SF6 from in-situ measure-ments vs. remote sensing measuremeasure-ments. Relative trends in ODSs and halogenated greenhouse gases for the common 2004–2010 time period (except when specified) derived from in-situ surface measurements and remote sensing observations from the ground and from space. Surface trends were derived from monthly mean mole fractions, weighted by surface area in the region 30°N–90°N. Shown are the average and standard deviation of trends derived independently from NOAA and AGAGE data (% yr-1 relative to 2007 annual mean). For CF4 and HFC-23, only AGAGE data were used, and the uncertainty
was derived from uncertainties (one standard deviation) in the slope and 2007 annual mean. For HFC-23, global mean data were used from 2007 through 2010, supplemented with data from Miller et al. (2010) for 2004–2007. Ground-based remote sensing trends were derived from daily mean total column measure-ments performed at Jungfraujoch (46.5ºN). The ACE-FTS trends were determined using tropical occulta-tions (30ºN–30ºS), after averaging the mixing ratios in molecule-dependent altitude ranges (Brown et al., 2011). For HFC-23, the 40ºN–40ºS occultations were considered in the 10–25 km altitude range. For MIPAS CFC-11 and -12, mean rates of change for the 20ºN–20ºS and 10–15 km altitude range are pro-vided, including observations between 2002 and 2011 (Kellmann et al., 2012). For SF6, the trend
charac-terizes the 2006–2009 time period between 17.5ºN–17.5ºS latitude and 9–15 km altitude (Stiller et al., 2012).
Substance Annual Trend 2004–2010
(% yr-1 relative to 2007) Data Sources In-situ 30°N–90°N Remote sensing ground (total columns) Remote sensing satellite CFC-11 −0.84 ± 0.09 −0.99 ± 0.10 MIPAS: −1.03±0.09 ACE-FTS: −0.9 ± 0.1 NOAA, AGAGE Zander et al., 2008 Kellmann et al., 2012 Brown et al., 2011 CFC-12 −0.39 ± 0.05 −0.38 ± 0.07 MIPAS: −0.51± 0.09 ACE-FTS: −0.4 ± 0.1 NOAA, AGAGE Zander et al., 2008 Kellmann et al., 2012 Brown et al., 2011 CFC-113 −0.93 ± 0.02 ACE-FTS: −1.2 ± 0.1 NOAA, AGAGE Brown et al., 2011 CCl4 −1.35 ± 0.08 −1.31 ± 0.15 ACE-FTS −1.2 ± 0.1 NOAA, AGAGE Rinsland et al., 2012 Brown et al., 2011 HCFC-22 3.97 ± 0.06 3.52 ± 0.08 ACE-FTS 3.7 ± 0.1 NOAA, AGAGE Zander et al., 2008 Brown et al., 2011 HCFC-141b 2.57 ± 0.07 ACE-FTS 0.74 ± 0.5 NOAA, AGAGE Brown et al., 2011 HCFC-142b 5.44 ± 0.03 ACE-FTS 7.0 ± 0.4 NOAA, AGAGE Brown et al., 2011 HFC-23 4.2 ± 0.2 ACE-FTS 3.9 ± 1.2 AGAGE Harrison et al., 2012 CF4 0.86 ± 0.01 1.02 ± 0.05 ACE-FTS 0.74 ± 0.04 AGAGE Mahieu et al., 2014 Brown et al., 2011 SF6 4.27 ± 0.07 4.14 ± 0.32 MIPAS 4.3 ACE-FTS: 4.2 ± 0.1 NOAA, AGAGE Zander et al., 2008 Stiller et al., 2012 Brown et al., 2011
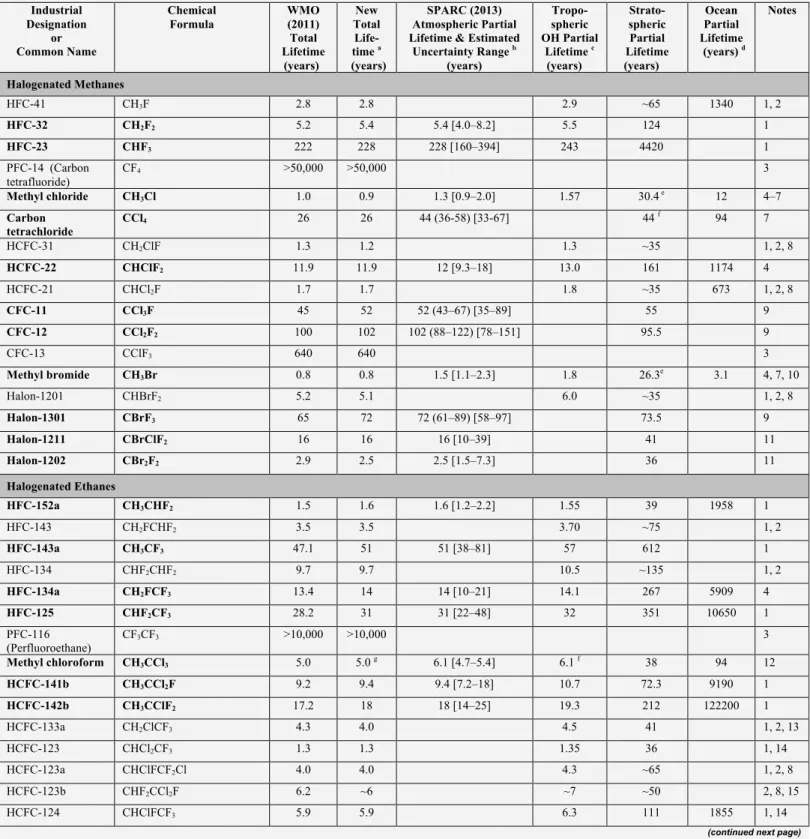
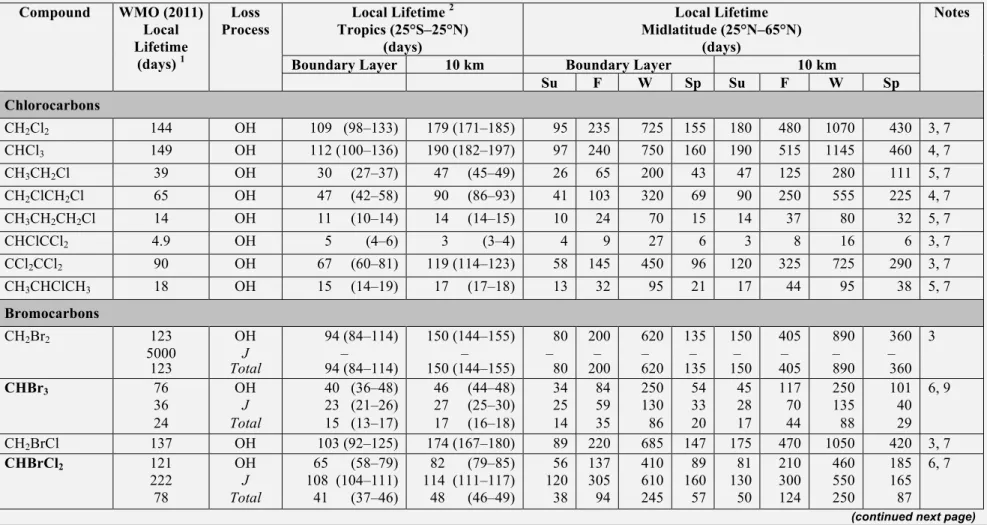
Table 1-3. Steady-state lifetimes for selected long-lived halocarbons (total lifetimes greater than 0.5 years). Total and partial lifetimes are defined in Box 1-1. Compounds included in the SPARC (2013) lifetime report are given in bold with the total lifetimes calculated using the SPARC (2013) atmospheric partial lifetime recommendation and the ocean and soil partial lifetimes reported here; stratospheric partial lifetimes for these compounds were taken from the SPARC (2013) model-mean unless noted otherwise. The footnotes contain specific details for each compound in the table. See Table 1-5 in Section 1.3 for local lifetime estimates for very short-lived substances (VSLS) and Table 1-11 in Section 1.3 for lifetimes of potential ODS replacement compounds.
Industrial Designation or Common Name Chemical Formula WMO (2011) Total Lifetime (years) New Total Life-time a (years) SPARC (2013) Atmospheric Partial Lifetime & Estimated
Uncertainty Range b (years) Tropo-spheric OH Partial Lifetime c (years) Strato-spheric Partial Lifetime (years) Ocean Partial Lifetime (years) d Notes Halogenated Methanes HFC-41 CH3F 2.8 2.8 2.9 ~65 1340 1, 2 HFC-32 CH2F2 5.2 5.4 5.4 [4.0–8.2] 5.5 124 1 HFC-23 CHF3 222 228 228 [160–394] 243 4420 1 PFC-14 (Carbon tetrafluoride) CF4 >50,000 >50,000 3 Methyl chloride CH3Cl 1.0 0.9 1.3 [0.9–2.0] 1.57 30.4 e 12 4–7 Carbon tetrachloride CCl4 26 26 44 (36-58) [33-67] 44 f 94 7 HCFC-31 CH2ClF 1.3 1.2 1.3 ~35 1, 2, 8 HCFC-22 CHClF2 11.9 11.9 12 [9.3–18] 13.0 161 1174 4 HCFC-21 CHCl2F 1.7 1.7 1.8 ~35 673 1, 2, 8 CFC-11 CCl3F 45 52 52 (43–67) [35–89] 55 9 CFC-12 CCl2F2 100 102 102 (88–122) [78–151] 95.5 9 CFC-13 CClF3 640 640 3 Methyl bromide CH3Br 0.8 0.8 1.5 [1.1–2.3] 1.8 26.3e 3.1 4, 7, 10 Halon-1201 CHBrF2 5.2 5.1 6.0 ~35 1, 2, 8 Halon-1301 CBrF3 65 72 72 (61–89) [58–97] 73.5 9 Halon-1211 CBrClF2 16 16 16 [10–39] 41 11 Halon-1202 CBr2F2 2.9 2.5 2.5 [1.5–7.3] 36 11 Halogenated Ethanes HFC-152a CH3CHF2 1.5 1.6 1.6 [1.2–2.2] 1.55 39 1958 1 HFC-143 CH2FCHF2 3.5 3.5 3.70 ~75 1, 2 HFC-143a CH3CF3 47.1 51 51 [38–81] 57 612 1 HFC-134 CHF2CHF2 9.7 9.7 10.5 ~135 1, 2 HFC-134a CH2FCF3 13.4 14 14 [10–21] 14.1 267 5909 4 HFC-125 CHF2CF3 28.2 31 31 [22–48] 32 351 10650 1 PFC-116 (Perfluoroethane) CF3CF3 >10,000 >10,000 3 Methyl chloroform CH3CCl3 5.0 5.0 g 6.1 [4.7–5.4] 6.1 f 38 94 12 HCFC-141b CH3CCl2F 9.2 9.4 9.4 [7.2–18] 10.7 72.3 9190 1 HCFC-142b CH3CClF2 17.2 18 18 [14–25] 19.3 212 122200 1 HCFC-133a CH2ClCF3 4.3 4.0 4.5 41 1, 2, 13 HCFC-123 CHCl2CF3 1.3 1.3 1.35 36 1, 14 HCFC-123a CHClFCF2Cl 4.0 4.0 4.3 ~65 1, 2, 8 HCFC-123b CHF2CCl2F 6.2 ~6 ~7 ~50 2, 8, 15 HCFC-124 CHClFCF3 5.9 5.9 6.3 111 1855 1, 14
Industrial Designation or Common Name Chemical Formula WMO (2011) Total Lifetime (years) New Total Life-time a (years) SPARC (2013) Atmospheric Partial Lifetime & Estimated
Uncertainty Range b (years) Tropo-spheric OH Partial Lifetime c (years) Strato-spheric Partial Lifetime (years) Ocean Partial Lifetime (years) d Notes HCFC-124a CHF2CClF2 9.1 ~9.2 ~10 ~120 2, 16 CFC-112 CCl2FCCl2F 59 59 13 CFC-112a CClF2CCl3 51 51 13 CFC-113 CCl2FCClF2 85 93 93 (82–109) [69–138] 88.4 9, 17 CFC-113a CCl3CF3 ~45 59 59 13 CFC-114 CClF2CClF2 190 189 189 [153–247] 191 9, 17 CFC-114a CCl2FCF3 ~100 ~100 ~100 18 CFC-115 CClF2CF3 1020 540 540 [404–813] 664 19 Halon-2311 (Halothane) CHBrClCF3 1.0 1.0 1.1 ~16 1, 2, 8 Halon-2402 CBrF2CBrF2 20 28 28 [20–45] 41 11 Halogenated Propanes HFC-263fb CH3CH2CF3 1.2 1.1 1.16 ~40 1, 2 HFC-245ca CH2FCF2CHF2 6.5 6.5 6.9 ~105 1, 2 HFC-245ea CHF2CHFCHF2 3.2 3.2 3.4 ~70 1, 2 HFC-245eb CH2FCHFCF3 3.1 3.2 3.3 ~70 1, 2 HFC-245fa CHF2CH2CF3 7.7 7.9 7.9 [5.5–14] 8.2 149 1 HFC-236cb CH2FCF2CF3 13.1 ~13 ~14 ~240 20 HFC-236ea CHF2CHFCF3 11.0 11.0 11.9 ~145 1, 2 HFC-236fa CF3CH2CF3 242 222 253 ~1800 1, 21 HFC-227ea CF3CHFCF3 38.9 36 36 [25–61] 37.5 673 4, 22 PFC-218 (Perfluoropropane) CF3CF2CF3 2,600 ~7,000 23 PFC-c216 (Perfluorocyclo-propane) c-C3F6 ~3,000 ~4,000 23 HCFC-243cc CH3CF2CCl2F 19.5 19.5 27.1 ~70 1, 2, 8 HCFC-234fb CF3CH2CCl2F 49 ~45 98 ~85 1, 2, 8 HCFC-225ca CHCl2CF2CF3 1.9 1.9 2.0 44 1, 14 HCFC-225cb CHClFCF2CClF2 5.9 5.9 6.3 101 1, 14
Halogenated Higher Alkanes
HFC-365mfc CH3CF2CH2CF3 8.7 8.7 9.3 ~125 1, 2 HFC-356mcf CH2FCH2CF2CF3 1.3 1.2 1.26 ~40 1, 2 HFC-356mff CF3CH2CH2CF3 8.3 8.3 8.9 ~120 1, 2 HFC-338pcc CHF2CF2CF2CHF2 12.9 12.9 14.0 ~160 1, 2 HFC-329p CHF2CF2CF2CF3 28.4 ~30 ~34 ~260 2, 24 PFC-C318 (Perfluorocyclo-butane) c-C4F8 3,200 3,200 3 PFC-31-10 (Perfluorobutane) C4F10 2,600 ~5,000 23 (E)-R316c ((E)-1,2- dichlorohexafluoro-cyclobutane) (E)-1,2-c-C4F6Cl2 75 76 9, 25 (Z)-R316c ((Z)-1,2- dichlorohexafluoro-cyclobutane) (Z)-1,2-c-C4F6Cl2 114 115 9, 25
Industrial Designation or Common Name Chemical Formula WMO (2011) Total Lifetime (years) New Total Life-time a (years) SPARC (2013) Atmospheric Partial Lifetime & Estimated
Uncertainty Range b (years) Tropo-spheric OH Partial Lifetime c (years) Strato-spheric Partial Lifetime (years) Ocean Partial Lifetime (years) d Notes HFC-43-10mee CF3CHFCHFCF2CF3 16.1 16.1 17.9 157 1, 14 HFC-458mfcf CF3CH2CF2CH2CF3 22.9 22.9 25.5 ~225 1, 2 PFC-41-12 (Perfluoropentane) C5F12 4,100 4,100 3 HFC-55-10mcff CF3CF2CH2CH2CF2CF3 7.5 7.5 8.0 ~115 1, 2 HFC-52-13p CHF2CF2CF2CF2CF2CF3 32.2 32.7 37.0 ~280 2, 26 PFC-51-14 (Perfluorohexane) C6F14 3,100 3,100 3 PFC-61-16 (Perfluoroheptane) C7F16 ~3,000 ~3,000 23 PFC-71-18 (Perfluorooctane) C8F18 ~3,000 23
Perfluorodecalin C10F18, (E)- and (Z)-isomers ~2,000 ~2,000 23
Fluorinated Alcohols 1,1,1,3,3,3-hexa-fluoroisopropanol (CF3)2CHOH 1.9 1.9 2.0 ~50 1, 2 Halogenated Ethers HFE-143a CH3OCF3 4.8 4.8 5.1 ~90 1, 2 HFE-134 CHF2OCHF2 24.4 25.4 28.4 ~240 1, 2 HFE-125 CHF2OCF3 119 119 147 ~620 1, 2 HFE-227ea CF3OCHFCF3 51.6 46.7 54 ~345 1, 2 HCFE-235da2 (Isoflurane) CHF2OCHClCF3 3.5 3.5 3.7 ~55 1, 2, 27 HFE-236ea2 (Desflurane) CHF2OCHFCF3 10.8 10.8 11.7 ~145 1, 2 HFE-236fa CF3OCH2CF3 7.5 ~7.5 ~8 ~115 2, 28 HFE-245fa1 CF3OCH2CHF2 6.6 ~6.6 ~7 ~105 2, 29 HFE-245fa2 CHF2OCH2CF3 5.5 5.5 5.8 ~95 1, 2 HFE-245cb2 CH3OCF2CF3 4.9 5.0 5.24 ~90 1, 2 HFE-254cb2 CH3OCF2CHF2 2.5 2.5 2.62 ~60 1, 2 HFE-236ca CHF2OCF2CHF2 20.8 20.8 23.1 ~210 1, 2 HFE-235ca2 (Enflurane) CHF2OCF2CHFCl 4.3 4.3 4.62 ~70 2, 8, 30 HFE–329mcc2 CF3CF2OCF2CHF2 22.5 ~25 23–34 ~220 2, 31 HFE–338mcf2 CF3CF2OCH2CF3 7.5 ~7.5 ~8 ~130 2, 32 HFE–347mcc3 CH3OCF2CF2CF3 5.0 5.0 5.3 ~90 1, 2 HFE–347mcf2 CF3CF2OCH2CHF2 6.6 ~6.6 ~7 ~105 2, 33 HFC-347mcf CHF2OCH2CF2CF3 5.7 5.6 6.0 ~95 1, 2 HFE-347pcf2 CF3CH2OCF2CHF2 6.0 5.9 6.3 ~100 1, 2 HFE–356mec3 CH3OCF2CHFCF3 ~3 ~3 ~3 ~65 2, 34 HFE–356pcc3 CH3OCF2CF2CHF2 ~3 ~3 ~3 ~65 2, 34 HFE–356pcf2 CHF2CH2OCF2CHF2 5.7 ~6 ~6 ~95 2, 35 HFE–356pcf3 CHF2OCH2CF2CHF2 3.5 3.5 3.7 ~75 1, 2 HFE-347mmz1 (Sevoflurane) (CF3)2CHOCH2F 2.2 ~2 ~2 ~50 2, 36 HFE-338mmz1 (CF3)2CHOCHF2 21.2 21.2 23.5 ~215 1, 2
Industrial Designation or Common Name Chemical Formula WMO (2011) Total Lifetime (years) New Total Life-time a (years) SPARC (2013) Atmospheric Partial Lifetime & Estimated
Uncertainty Range b (years) Tropo-spheric OH Partial Lifetime c (years) Strato-spheric Partial Lifetime (years) Ocean Partial Lifetime (years) d Notes Perfluoroisopropyl methyl ether (CF3)2CFOCH3 3.7 3.6 3.8 ~75 1, 2 HFE-7100 CH3O(CF2)3CF3 4.7 4.7 5.0 ~85 1, 2 HFE-54-11mecf CF3CHFCF2OCH2CF2CF3 8.8 8.8 9.5 ~125 2, 37 HFE-569sf2 CH3CH2O(CF2)3CF3 0.8 ~0.8 ~0.8 ~30 2, 38
HFE–236ca12 CHF2OCF2OCHF2 25.0 25.0 28.0 235 1, 2
HFE–338pcc13 CHF2OCF2CF2OCHF2 12.9 12.9 14.0 ~160 1, 2
HFE–43–10pccc CHF2OCF2OCF2CF2OCHF2 13.5 13.5 14.7 ~165 1, 2
Trifluoromethyl formate CF3OC(O)H <3.5 <3.5 3.7 ~75 2, 39, 40 Perfluoroethyl formate C2F5OC(O)H <3.5 <3.5 3.7 ~75 2, 40, 41 Perfluoro-n-propyl formate n-C3F7OC(O)H <2.6 <2.6 2.7 ~60 2, 40, 41
Other Fluorinated Compounds
Trifluoromethyl-sulfurpentafluoride SF5CF3 650–950 650–950 42 Sulfur hexafluoride SF6 3,200 3,200 3 Nitrogen trifluoride NF3 500 569 740 43 Sulfuryl fluoride SO2F2 36 36 >300 630 40 44
a Total lifetime includes tropospheric OH and Cl atom reaction and photolysis loss, stratospheric loss due to reaction (OH and O(1D)) and photolysis, and ocean and soil uptake as noted in the table.
b The lifetimes given in parenthesis () represent the “most likely” lifetime range, while the lifetimes given in brackets [] represent the “possible” lifetime range, see SPARC (2013).
c Lifetime for tropospheric loss due to reaction with OH calculated relative to the lifetime for CH
3CCl3, (6.1 years) and a temperature of 272 K (see Box 1-1). d Ocean lifetimes were taken from Yvon-Lewis and Butler (2002) unless noted otherwise.
e Stratospheric lifetime from Chapter 5 of SPARC (2013).
f Stratospheric lifetime from SPARC (2013) was based on both tracer (40 years) and model-mean (49 years) derived lifetimes. g The value of τ
OH of 6.1 years for methyl chloroform was derived from its measured overall lifetime of 5.0 years (Prinn et al., 2005; Clerbaux and Cunnold et al., 2007), taking into account an ocean partial lifetime of 94 years and stratospheric partial lifetime of 38 years.
Notes
1. OH rate coefficient data taken from Sander et al. (2011).
2. Stratospheric reactive loss (O(1D) and OH) partial lifetime estimate was based on an empirical correlation derived from data reported in Naik et al. (2000); log(Stratospheric reactive partial lifetime) = 1.537 + 0.5788*log(Tropospheric OH partial lifetime). This correlation was used in WMO (2011).
3. Total lifetime is a best estimate taken from Ravishankara et al. (1993) that includes mesospheric loss due to Lyman-α (121.567 nm) photolysis. 4. OH rate coefficient data taken from SPARC (2013) Chapter 3.
5. Lifetime due to reaction with Cl atom of 259 years taken from the SPARC (2013) Chapter 5 model-mean. 6. Ocean lifetime taken from Hu et al. (2013).
7. Total lifetime also includes soil uptake partial lifetimes: 4.2 years for CH3Cl (Hu, 2012), 195 years for CCl4 (Montzka and Reimann et al., 2011), and 3.35 years for CH3Br (Montzka and Reimann et al., 2011).
8. Stratospheric photolysis lifetime was estimated using the empirical relationship given in Orkin et al. (2013a).
9. Tropospheric UV photolysis partial lifetime: 1870 years for CFC-11, 11600 years for CFC-12, 4490 years for halon-1301, 7620 years for CFC-113, 19600 years for CFC-114, 3600 years for (E)-R316c, and 10570 years for (Z)-R316c.
10. Ocean lifetime taken from Hu et al. (2012).
11. Lifetimes from 2-D model calculations using cross section data from Papanastasiou et al. (2013). The total lifetime includes a tropospheric photolysis partial lifetimes: 27.2 years for halon-1211, 2.74 years for halon-1202, and 85.5 years for halon-2402.
12. Tropospheric OH partial lifetime calculated from an overall lifetime of 5.0 years derived from the AGAGE and NOAA networks using a stratospheric partial lifetime of 38 years and an ocean partial lifetime of 94 years (Prinn et al., 2005).
13. Stratospheric partial lifetime of 51 (27–264) years taken from Laube et al. (2014) and scaled to a CFC-11 lifetime of 52 years. 14. Stratospheric partial lifetime taken from Naik et al. (2000).
15. Tropospheric OH partial lifetime estimated from that for CHF2CF3 taking into account the effects of chlorine substitution on the rate coefficients for CH3CF3 and CH3CFCl2.
16. Tropospheric OH partial lifetime estimated from that for CHF2CF3 taking into account the effects of chlorine substitution on the rate coefficients for CH3CF3 and CH3CF2Cl; stratospheric photolysis estimated to be the same as for CF3CF2Cl of 1590 years from SPARC (2013) Chapter 5 model mean.
17. The revised O(1D) rate coefficient recommended in SPARC (2013) Chapter 3 would decrease the model calculated stratospheric partial lifetime slightly. 18. UV photolysis is the expected predominant stratospheric loss process, however, no UV absorption spectrum data are available. Lifetimes assumed to be similar to
19. Stratospheric partial lifetime from 2-D model calculations using O(1D) rate coefficient data from Baasandorj et al. (2013). The total lifetime includes mesospheric loss due to Lyman-α (121.567 nm) photolysis.
20. Lifetimes estimated to be similar to that of HFC-134a (CH2FCF3).
21. Stratospheric partial lifetime estimated based on a reactivity comparison with CH2F2 and CF3CHFCF3.
22. Stratospheric partial lifetime calculated using 2-D model with OH and O(1D) rate coefficients recommended in SPARC (2013) Chapter 3.
23. Total lifetime estimated based on the increase in Lyman-α (121.567 nm) cross section with increasing number of –CF2– groups in the perfluorocarbon. 24. OH rate coefficient from Young et al. (2009) and an assumed temperature dependence the same as for CHF2CF3.
25. Lifetimes taken from the 2-D model calculations in Papadimitriou et al. (2013b). 26. OH rate coefficient data taken from Atkinson et al. (2008).
27. Stratospheric partial lifetime assumed to be the same as for HCFC-133a (CH2ClCF3).
28. Tropospheric OH partial lifetime estimated from that for CF3CH2OCF2CHF2 by adjusting for the reactivity contribution of –CF2CHF2 determined from the reactivity of CF3CF2OCF2CHF2.
29. Tropospheric OH partial lifetime estimated from those for CF3OCH3 and CHF2CH2CF3. 30. OH rate coefficient taken from Tokuhashi et al. (1999).
31. Tropospheric OH partial lifetime estimated as being greater than that of CHF2CF2OCHF2 and less than that of CHF2CF2CF2CF3. 32. Tropospheric OH partial lifetime assumed to be the same as that of CF3OCH2CF3.
33. Tropospheric OH partial lifetime assumed to be the same as for CHF2CH2OCF3. 34. Tropospheric OH partial lifetime assumed to be approximately that of CH3OCF2CHF2.
35. Tropospheric OH partial lifetime estimated from the sum of the OH reaction loss of CF3CF2OCF2CHF2 and CF3CF2OCH2CHF2. 36. OH rate coefficient from the 298 K studies of Langbein et al. (1999) and Sulbaek Andersen et al. (2012) and an assumed E/R of 1500 K. 37. OH rate coefficient from Chen et al. (2005a).
38. OH rate coefficient from the 295 K study of Christensen et al. (1998) and an assumed E/R of 1000 K. 39. OH rate coefficient taken from Chen et al. (2004b).
40. Ocean loss for perfluoro esters has been estimated from hydrolysis and solubility data for non-fluorinated and partially fluorinated esters by Kutsuna et al. (2005). These authors suggest that the ocean sink can be comparable to the tropospheric reaction sink for perfluoro esters, thereby reducing the total lifetimes given in this table by as much as a factor of 2.
41. OH rate coefficient from Chen et al. (2004a).
42. Total lifetime taken from Table 1-4 in Clerbaux and Cunnold et al. (2007).
43. Lifetimes calculated based on 2-D model from Papadimitriou et al. (2013a); total lifetime includes tropospheric (84150 years) and mesospheric (2531 years) partial lifetimes.
44. From Papadimitriou et al. (2008) and Mühle et al. (2009).
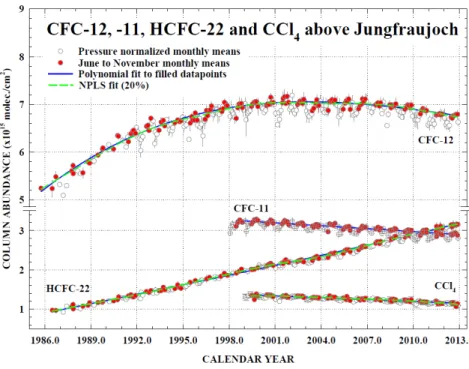
Figure 1-2. Time evolution of monthly-mean total vertical column abundances (in molecules per square centimeter) for CFC-12, CFC-11, CCl4, and HCFC-22 above the Jungfraujoch station, Switzerland,
through 2012 (updated from Zander et al. (2008), using the bootstrap resampling tool described by Gardiner et al. (2008) for the trend evaluations and Rinsland et al. (2012)). Note the discontinuity in the vertical scale. Solid blue lines show polynomial fits to the columns measured in June to November only so as to mitigate the influence of variability caused by atmospheric transport and tropopause subsidence during winter and spring (open circles) on derived trends. Dashed green lines show nonparametric least-squares fits (NPLS) to the June to November data.
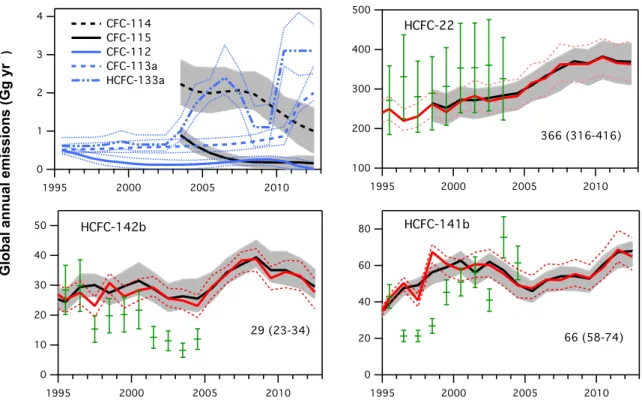
Figure 1-3. Top-down and bottom-up global emissions estimates (Gg yr-1) for ozone-depleting substances. Top-down emissions from AGAGE (black) and NOAA (red) atmospheric data were calculated using a global 12-box model (Cunnold et al., 1983; Rigby et al., 2013). (continued next page)
(Figure 1-3, continued) Additionally, for CFC-112, CFC-113a, HCFC-133a, and halons the emissions were calculated using UEA data from the Southern Hemisphere (S.H.) (Cape Grim archived air (blue); Laube et al., 2014). Lifetimes and ranges were taken from Newland et al. (2013), Laube et al. (2014), and SPARC (2013). Shaded bands indicate overall uncertainties derived from uncertainties in measurement, lifetimes, and prior emissions estimates. Mean values given in the text, and shown in figures for 2012, were calculated as the mean of AGAGE and NOAA estimates (when available). Ranges were taken from AGAGE data as shown in this figure unless AGAGE and NOAA ranges differed by more than 10%, in which case an average range was reported (e.g., CFC-113). CFC-11 emissions were also calculated using an older lifetime estimate of 45 years instead of 52 years (dashed violet line). Bottom-up estimates include UNEP (2006) (green) and UNEP (2011b) (violet). Note the x-axis ranges are not the same for all panels.
Figure 1-4. Regional emission estimates of CFC-11, CFC-12, and CFC-113 from China. Top-down estimates in years indicated were taken from 1Palmer et al. (2003),
2Vollmer et al. (2009), 3Kim et al.
(2010), 4An et al. (2012), and 5Fang et al. (2012). Bottom-up estimates (solid and dashed lines) are from Wan et al. (2009).
Box 1-1. Lifetimes and Removal Processes
The total lifetime (τTotal) of a trace species is defined as the ratio of its global atmospheric burden (CGlobal)
to its total global loss rate (LTotal)
where LTotal is the sum of the loss rates for various removal processes
LAtm represents the loss rate for processes occurring in the atmosphere (gas-phase reaction and photolysis), LSoil
is the loss rate due to soil uptake, and LOcean is the rate for loss to the oceans (additional loss rates are
represented by LX). Lifetimes are not constant values because they depend on the abundance of a chemical
relative to the distribution of its sinks (and hence can vary with emission magnitude and location). Steady-state lifetimes refer to a lifetime when the emission and removal rates of a species are equal. A discussion of lifetimes and methods for defining their uncertainties is given in SPARC (2013).
Loss rates are associated with partial lifetimes such that
where
The atmospheric lifetime can also be separated into partial troposphere, stratosphere, and mesosphere lifetimes using the total global atmospheric burden and the loss rate integrated over the different atmospheric regions such that
Species with total lifetimes greater than ~0.5 years are well-mixed in the troposphere and, for the
purposes of this Assessment, are considered long-lived. In this case, τTotal is considered to be independent of
the location of emission, and is considered to be a global lifetime that represents the compound’s persistence in the Earth’s atmosphere. The lifetime of a long-lived species due to reaction with tropospheric OH radicals is
estimated relative to the corresponding tropospheric OH partial lifetime of methyl chloroform (CH3CCl3,
MCF) such that
where is the OH partial lifetime for compound RH, kRH(272 K) and kMCF(272 K) are the rate coefficients
for the reactions of OH with RH and MCF at 272 K, respectively, and = 6.1 years (see Table 1-3).
Very short-lived substances (VSLS) (i.e., compounds with atmospheric lifetimes less than ~0.5 years) typically have non-uniform tropospheric distributions, because this time period is comparable to or shorter than the characteristic time of mixing processes in the troposphere. Local atmospheric lifetimes of VSLS, therefore, depend on where and when the compound is emitted, as well as local atmospheric conditions (Table 1-5, page 1.35). The concept of a single global lifetime, an Ozone Depletion Potential (ODP), or a Global Warming Potential (GWP) is inappropriate for VSLS, as discussed in Chapter 5.
Since the last Assessment, SPARC (Stratosphere-Troposphere Processes And their Role in Climate)—a core project of the World Climate Research Programme (WCRP)—initiated a study of the “Lifetimes of Stratospheric Ozone-Depleting Substances, Their Replacements, and Related Species” (SPARC, 2013). The study included 27 long-lived key ozone-depleting substances (ODSs), replacement compounds, and green-house gases (see Table 1-3). Including CFC-11 was of particular importance since it is the reference species used in defining the ODPs of other ODSs. The lifetime evaluation was warranted because of advancements in