Controlling Properties of Functional Oxides by Tuning Oxygen
Defect Chemistry
By Qiyang Lu
Bachelor of Science, Materials Science and Engineering, Tsinghua University, China, 2012
Submitted to the Department of Materials Science and Engineering in partial fulfillment of the requirements for the degree of
DOCTOR OF PHILOSOPHY IN MATERIALS SCIENCE AND ENGINEERING AT THE MASSACHUSETTS INSTITUTE OF TECHNOLOGY
FEBRUARY 2018
2018 Massachusetts Institute of Technology. All rights reserved
Signature redacted
Signature of Author:.Certified by:
Department of Materials Science and Engineering January 8th, 2018
Signature redacted
V V \ Bilge Yildiz
Associate Professor of Materials Science and Engineering Associate Professor of Nuclear Science and Engineering Thesis Supervisor
Accepted
by:_Signature
redacted
Donald Sadoway John F. Elli Professor of Materials Chemistry Chair, Departme ommittee on Graduate Student
ARCHIVES
MAS9XC 1S S 'NS AIVOTEOF TECHNOLOGY
MAR
0)
2048
Controlling the Properties of Functional Oxides by Tuning the
Oxygen Defect Chemistry
By
Qiyang Lu
Submitted to the Department of Materials Science and Engineering on Jan. 8th, 2018 in
Partial Fulfillment of the Requirements for the Degree of Doctor of Philosophy in Materials Science and Engineering
Abstract
Oxygen defects are essential building blocks for properties and functionalities of oxides, including electrical conductivity, magnetism, ferroelectricity as well as catalytic and electrocatalytic activity. Therefore, fundamental understanding of how to tune the oxygen defect chemistry is essential for advancing applications based on these defect sensitive properties. This thesis investigated pathways to controlling the concentration and structure of oxygen defects on selected case studies with model oxide systems. Three novel effects were assessed and shown to be operative for obtaining a large impact on the oxygen defect chemistry equilibria. These are heterogeneous chemical doping of the surface for improving surface electrocatalytic activity and stability, electrochemical bias to control phase with drastic changes obtained in electronic and phonon transport properties, as well as strain engineering to alter the oxygen interstitial capacity and oxygen exchange kinetics. Surface chemical modifications were applied to the near-surface regions of Lao.8Sro.2CoO 3
(LSC) by replacing the Co cations locally with less reducible cations, such as Hf and Ti.
This strategy was shown to effectively stabilize the LSC surfaces and suppress surface segregation of Sr at elevated temperatures. This introduced surface stability by local chemical doping greatly enhanced the long-term electrochemical performance of LSC electrode, which provides a new route for improving the efficiency of solid oxide fuel and electrolysis cells.
Applying electrical bias was investigated as another effective method to tune the oxygen stoichiometry, exemplified by the case studies on SrCoOx (SCO). In situ X-ray diffraction was used to investigate the topotactic phase transition between brownmillerite phase
SrCoO2.5 (BM-SCO) and perovskite phase SrCoO36 (P-SCO) triggered electrochemically at elevated temperatures. An electrical bias of merely 30 mV was shown sufficient to trigger the BM-P phase transition. This is much more feasible than chemically induced phase transition, which requires high pressure (> 1 bar) and specialized pressurized apparatus. Moreover, the evolution of electronic structure during the BM4P phase transition was probed in operando by using ambient-pressure X-ray photoelectron and absorption spectroscopy (AP-XPS/XAS).
The similar experimental scheme, which combines in operando surface characterizations and electrochemical controlling of oxygen stoichiometry, was extended to oxide systems beyond perovskites. This allows us to investigate the defect chemistry of oxides in a much broader range of effective oxygen partial pressure than what conventional methods can achieve. Firstly, we showed that the surface defect chemistry equilibrium of fluorite-structured Pro.iCeo.902-6 (PCO) strongly deviated from the bulk counterpart, due to the possibly enhanced defect-defect interactions or lattice strain effect at surfaces. Secondly, we found a novel metal-insulator transition triggered electrochemically in VO, by changing the phase between the metallic dioxide V02 and the insulating pentoxide V205. Lastly, we lowered the operation temperature of this electrochemical control of oxygen stoichiometry down to room temperature by using ionic liquid or ion gels as the electrolyte. We achieved tuning of thermal conductivity in SrCoOx with a range of more than one order of magnitude, by using electrochemically triggered phase transitions at room temperature. We also investigated the effect of lattice strain on oxygen defect formation energy in Ruddlesden-Popper (RP) phase oxide Nd2NiO4+6 (NNO). We found that tensile strain along the c-axis of NNO lattice effectively reduced the formation enthalpy of oxygen interstitials, which can provide a new route for designing the defect chemistry of RP phase oxide for electrocatalytic applications.
Thesis Supervisor: Bilge Yildiz
Associate Professor of Materials Science and Engineering Associate Professor of Nuclear Science and Engineering
Acknowledgements
I want to express my deepest appreciations to those who helped me during my years at
MIT. Without them, this thesis would not be possible for me to accomplish.
Firstly, I would like to thank my advisor, Prof. Bilge Yildiz. Her persistent pursuing of important scientific questions, keen eyes on important details as well as always positive and optimistic attitude really inspired me. Her guidance is indispensable in the process of nurturing me to become an independent researcher. I am also grateful to my thesis committee, Prof. Harry Tuller and Prof. Caroline Ross, for their valuable advice and support during my PhD years.
I would not be able to finish a single chapter in this thesis without the help and support
from my colleagues and collaborators. I am truly grateful to everyone who used to be or still at the Yildiz group. Lixin, I feel really lucky to have you joining the group in the same year with me. Thanks for all the discussions, for all the things I learned from you, and for listening me complaining about different things. Yan, Wen and Will, thanks for teaching me all the important stuff about experiments and research. I really learned a lot from you guys. Nikolai, thanks for being a true "comrade" and I will not forget all the beamtime we have been through. Aravind, Mostafa and Yue, I always enjoyed discussing my questions with you and was deeply impressed by your knowledge and your kindness. I also want to thank the students and post docs who joined our group after me, Jing, Christian, Roland, Max, Gulin and Will, who really enriched me both in work and in life.
This thesis would not be possible without the resources from several synchrotron facilities. Therefore, I really appreciate the help from the beamline scientists and staff for their support. I am grateful to the help from Dr. Ethan Crumlin and Dr. Hendrik Bluhm from
ALS, LBNL and Dr. Ira Waluyo from NSLS-II, BNL.
Lastly, I want to thank my parents for their support and understanding during all these years when I was studying abroad. Thanks for making me who I am today and I really, really hope that I have had spent more time with you.
Table of Contents
Abstract 3
A cknow ledgem ents... 5
T able of C ontents ... 6
L ist of F igures ... 10
C hapter 1. Introduction ... 24
1.1. M otivation ... 24
1.2. Toolbox for Tuning Oxygen Defect Chemistry... 26
1.3. Thesis O verview ... 31
Chapter 2. Key Experimental Techniques... 34
2.1. Pulsed Laser Deposition (PLD)... 34
2.2. X-ray diffraction (XRD)... 35
2.3. Ambient Pressure X-ray Photoelectron/Absorption Spectroscopy (AP-X P S/(AP-X A S) ... 37
2.3.1. Bring surface science techniques to ambient pressure conditions.. 37
2.3.2. Ambient pressure X-ray photoelectron spectroscopy (AP-XPS).... 40
2.3.3. Ambient-pressure X-ray absorption spectroscopy (AP-XAS)... 42
2.3.4. Resonant photoelectron spectroscopy (RESPES)... 44
Chapter 3. Tuning the Surface Oxygen Defect Chemistry of (Lao.8Sro.2)CoO 3 via Selective D oping ... 45
3.1. Introduction ... 45
3.2. Electrochemical performance of LSC with surface chemical m odifications ... 47
3.3. Evolution of surface chemical composition... 48
3.4. Electronic structure and vacancy concentration on LSC-Me surfaces relative to L SC ... 50
3.5. Bonding environment of the surface additive cations... 53
3.6. General effect of the surface additive cations on the Sr segregation and O R R kinetics... 55
3.7. C onclusion ... 57
Chapter 4. Electrochemically Triggered Topotactic Phase Transition in SrCoOx ... 58
4.1. Introduction ... 58
4.2. Structural and surface morphology characterizations of SrCoO2.5 thin film ... . 6 1 4.3. High temperature X-ray diffraction (HTXRD) on SrCoOx thin film ... 62
4.4. In situ X-ray diffraction of SrCoOx thin films ... 64
4.5. C onclusion ... 72
Chapter 5. Electronic Structure Evolution of SrCoOx Probed in situ during Electrochemically Triggered Topotactic Phase Transition... 74
5.1. Introduction ... 74
5.2. Fermi level shift revealed by X-ray core level photoelectron spectra.. 75
5.3. Evolution of unoccupied states and the oxygen non-stoichiometry at the
on-set of phase transition... 81
5.4. Evolution of the valence band structure... 86
5.5. Kinetics of SCO phase transition deduced by X-ray absorption near 0
K-ed g e ... . . 8 8
5.6 . C onclusion ... 9 1
Chapter 6. Electrochemically Triggered Metal-insulator Transition in VOx ... 93
6.1. Introduction and Motivation ... 93 6.2. Resolving the structure and phase of VOx by AP-XAS... 96 6.3. Change of electronic structure and electrochemical activity upon phase transition ... . . 99 6.4. Stability and cyclability of V02 and V205phases ... 101
6.5. Cyclability and kinetics of phase transition probed by dynamic X-ray absorption measurements...102
6.6. Electrochemically triggered metal-insulator transition at room
temperature...105 6.7. Conclusion...107
Chapter 7. Surface Defect Chemistry of (Pr,Ce)02.6 in a Wide Oxygen Partial Pressure Range... 108 7.1. Introduction... 108 7.2. Quantifying Pr oxidation state by in operando X-ray absorption spectra
... 1 10 7.3. Surface and bulk defect chemistry of PCO... 112 7.4. Surface electronic structure probed by resonant photoelectron spectra
... 1 15
7.5. Conclusion ... 118
Chapter 8. Comparing Electrochemical Effect and Strain Effect in Tuning Oxygen Defect Chemistry: The Case of Nd2NO4+6... 119
8.1. Introduction... 119 8.2. In operando X-ray absorption spectra of strained Nd2NiO4+6 thin films ... 12 1
8.3. The effect of lattice strain on oxygen non-stoichiometry ... 124 8.4. Conclusions... 127
Chapter 9. Bi-Directional Tuning of Thermal Transport in SrCoOx with Electrochemically Induced Phase Transitions ... 128 9.1. Introduction... 128 9.2. Results and Discussion ... 131 9.2.1. Electrochemically induced phase transition in SrCoOx via ionic liquid
or ion gel g ating ... 13 1
9.2.2. The effect of hydrogenation on the thermal transport property of S rC oO 2.5 ... 13 6
9 .3 . C onclusion ... 140
Chapter 10. Conclusions and Perspectives ... 142
10.1. T hesis Sum m ary... 142
10 .2 . O utlook ... 14 3 Appendix: Extra Details on Experimental Methods and Results... 146
A. Details on experimental methods and extra results for Chapter 3 ... 146
B. Details on experimental methods for Chapter 4... 151
C. Details on experimental methods for Chapter 5... 152
D. Details on experimental methods and extra results for Chapter 6 ... 153
E. Details on experimental methods for Chapter 7 ... 157
F. Details on experimental methods and extra results for Chapter 8 ... 159
G. Details on experimental methods for Chapter 9... 161
References 164
List of Figures
Figure 1-1 Examples of the influence of point defects (oxygen non-stoichiometry) on the physical, chemical properties and functionalities of oxides. (a) The generalization of the famed Fiebig-Spaldin diagram by adding another dimension considering the concentration of ionic species, illustrating that the physics of multiferroics can be drastically altered when the concentration of ionic species are changed. Reprinted with permission from Ref. 17. (b) The role of point defects in memristor devices relying on the valence change mechanism, revealed by local probing of electronic structure. Reprinted with permission from Ref. 18. (c) Oxygen defect enabled ionic transport, exemplified by the simulated oxide ion diffusion pathway in Ruddlesden-Popper phase oxides. Reprinted with permission from Ref. 19. (d) Solid-state high-temperature actuators consisting of non-stoichiometric (Pr,Ce)02s as the active material, utilizing the chemical expansion induced by the change of oxygen vacancy concentration in the structure. Reprinted with permission from Ref. 20.
Figure 1-2 The toolbox for tuning oxygen defect chemistry. (a) "Extrinsic" effects, including changing oxygen defect concentrations by chemical doping and using lattice strains. Figures reprinted with permissions from Ref. 27 and 24. (b) Electrostatic effects introduced by the creation of higher order defects including
ID defects (dislocations) and 2D defects (interfaces). Figures reprinted with
permissions from Ref. 28 and 29. (c) Electrochemical effect introduced by applying electrochemical potentials onto a functional oxide in contact with solid oxide electrolyte. Reprinted with permission from Ref. 30.
Figure 1-3 Profiles of chemical and electrochemical potential of oxygen ionic defects (exemplified by oxygen vacancies) in two scenarios. (a) Electrostatic effect introduced by a charged core (e.g. extended defects such as dislocations or grain boundaries). (b) Electrochemical potential applied by using a solid electrolyte (for example yittria stablized zirconia, YSZ). WE and CE denote for working and counter electrode, respectively.
Figure 2-1 Photo showing the configuration of in situ HRXRD set up on Bruker D8 diffractometer. The center stage has a polyester ether ketone (PEEK) dome which is semi-transparent for X-ray. Electrical leads are installed for in situ electrochemical measurements (see Chapter 4).
Figure 2-2 Photoelectron spectrometers for ambient-pressure photoelectron spectroscopy (APPES). (a) The typical configuration of state-of-art high-pressure electron analyzer with three differential pumping stages. Adopted from Ref. 58. (b) A photo of the endstation at beamline 11.0.2 of Advanced Light
Source (ALS), Lawrence Berkeley National Laboratory (LBNL). The photoelectron spectrometer is in the red circle.
Figure 2-3 Schematic illustrating three different X-ray spectroscopic techniques: XPS (a), XAS (b) and RESPES (c). See text for details about each technique. Co 2p is used to exemplify core levels. Abbreviations are hv = photons with certain energy, VB = valence band, Ei, = kinetic energy, Evac = vacuum level, EF =
Fermi level, on/off-res = on/off-resonance for a certain core level.
Figure 3-1 Surface oxygen exchange kinetics and stability on LSC dense thin film cathodes. (a) The oxygen surface exchange coefficient, kr', quantified from
electrochemical impedance spectroscopy measurements over time at 530 'C in air, for the LSC and LSC-Me films. (b) Atomic force microscopy images on the
LSC, LSC-V12, LSC-Nbl9, LSC-Til5, LSC-Hfl6, and LSC-A115 films that
were electrochemically tested as shown in (a).
Figure 3-2 Surface chemical stability on LSC dense thin films. (a) [Sr]TotalI/([La]+[Sr]),
(b) [Sr]Non-Iattice/([La]+[Sr]), and (c) [Sr]iattice/[Co] ratios at the surface of the LSC and LSC-Me thin films measured in situ at different temperature and oxygen partial pressures by AP-XPS. (d) Ex situ atomic force microscopy images of the
LSC and LSC-Me films after the AP-XPS measurements in (a).
Figure 3-3 Oxidation state of Co based on Co L_23-edge XAS on LSC dense thin films. (a) Co L2,3-edge X-ray absorption spectra on LSC-Hfl6 at different temperatures and oxygen partial pressures. The line marks the Co L3-edge main peak at 300
'C and 0.76 Torr as a reference, to monitor the relative changes in Co oxidation state. (b) The Co L3-edge peak positions at 300 'C, 0.76 Torr for LSC, LSC-Ti3, LSC-Til5, and LSC-Hfl6 are shown by the solid symbols. The arrow under the x-axis shows the direction of decreasing Co oxidation state, i.e. increasing oxygen vacancy concentration. The open symbols represent the oxygen vacancy formation enthalpy for binary oxides HfO293, TiO2
90 and also LSC94. The dashed arrows in (b) are a guide to the eye and do not imply a quantitative linearity. Figure 3-4 Oxidation state on LSC based on valence band and 0 K-edge. (a, b)
Evolution of the valence band structure from X-ray photoelectron spectra measured in situ on (a) LSC and (b) LSC-Hfl6. The arrow indicates the low energy peak which reflects the hybridization of Co t2g states with the O 2p orbital. The greater the intensity of this peak, the more electrons in the t2g states of Co. (c, d) 0 K-edge spectra of (c) LSC and (d) LSC-Hfl6 films at different temperatures and oxygen partial pressures. The dashed lines in each plot mark the position of the 0 2p ligand hole peak. The presence of this peak indicates p-type doping and therefore an increased Co oxidation state, as seen on LSC-Til 5 and LSC-Hfl6.
Figure 3-5 Coordination environment of Ti on LSC-Til5. Ti L2,3-edge X-ray absorption spectra under different measurement conditions. The dashed lines mark the separation of t2g and eg peaks in both the L2 and the L3 edges. Schematic
representation of the evolution of the Ti coordination at the LSC surface, from disordered at 300 'C to perovskite coordination of Ti atoms at the B-site of LSC at 450-550 'C (visualized using the VESTA software' 09).
Figure 3-6 Dependence of oxygen surface exchange kinetics on the reducibility of the
LSC surface. The oxygen surface exchange kinetics of LSC-Me, represented by
the kinetic coefficient kq, exhibit a volcano-like dependence on the enthalpy of oxygen vacancy formation (AHfV) in the binary oxides, MeOx. The x-axis is the difference between the AHf V of the binary oxides (i.e. V205 (a-phase,
orthorhombic) 89, Nb205 (a-phase, orthorhombic)92, TiO2 (rutile phase)89 9 1, ZrO2
(monoclinic phase)"0, HfO2 (monoclinic phase)" , and A1203 (u-phase,
hexagonal)90) and that of LSC. The y-axis shows the oxygen exchange coefficient, kq, on LSC-Me, where the surface Me concentrations are within
12-19%, measured after 27 hours of testing at 550'C in air. The dashed line is a guide for the eye only.
Figure 4-1 (a) Schematic (not to-scale) of the BM-SCO thin film on YSZ substrate with a GDC buffer layer. (b) The high-resolution X-ray diffraction data of 20-0 scan, (c) X-ray Reflectivity data, and (d) the AFM image showing the surface morphology on the as-deposited SCO thin film.
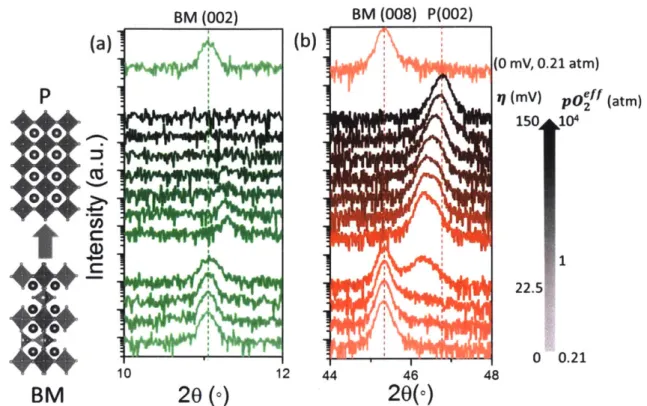
Figure 4-2 In situ XRD results on SCO thin film sample at 500 'C as a function of oxygen gas pressure, p02. BM phase (002) peak and (008) peak are shown marked by dashed lines. Upon phase transition from BM-SCO to P-SCO, the BM
(008) peak is transformed to the P (002) peak and the BM (002) peak disappears.
Figure 4-3 In situ XRD results on SCO thin film when different electrochemical potentials were applied at 773 K and 0.21 atm of p02. The changes in two diffraction peaks, (a) the SCO (002) peak (half-order peak) and (b) the
BM-SCO (008) or P-BM-SCO (002) peak are shown as a function of applied
electrochemical potential, 71, at the SCO electrode. The effective oxygen pressure, p02eff, was calculated based on the electrochemical potential at the
SCO electrode according to the Nernst equation.
Figure 4-4 Electrochemical impedance spectroscopy (EIS) measurement on the
SCO/GDC/YSZ/Ag electrochemical cell measured at 5000 C in air. The EIS
measurement was performed between each consecutive XRD measurement at the same conditions. The intercept is attributed to the resistance of YSZ, while the semicircle arcs at intermediate and low frequencies correspond to the resistance of the Ag counter electrode and the SCO working electrode, respectively. It could be estimated that Rsco/( Rsco+Rysz +RAg) ~ 0.75, which means that about 75% of the applied electrical bias can be converted to the electrochemical potential applied on SCO. The inset shows the equivalent circuit used for fitting the EIS data, which consists of a resistance for YSZ and two
parallel connected resistance and constant phase element (CPE) for Ag CE and
SCO WE.
Figure 4-5 Out-of-plane lattice parameters of BM-SCO and P-SCO extracted from in situ XRD data shown in Figure 4-3, as a function of electrochemical potential at the SCO electrode, collected at 500 'C in air.
Figure 4-6 In situ reciprocal space maps (RSM) collected for (a) BM-SCO, without bias applied and (b) P-SCO upon phase transition from BM to P with 4V applied bias. q, and q, are the in-plane and out-of-plane reciprocal lattice spacings, respectively. The BM(1012) peak was measured at 300 'C with no bias applied. The P(103) peak was measured when a bias of 4V was applied to the electrochemical cell. The vertical dashed line shows that the in-plane lattice. (c) RSM combining both the P(103) and the BM(1012) diffraction spots, which were observed one at a time, as indicated in (a) and (b). The dashed line indicates that the in-plane lattice parameter is essentially the same for BM and P phases before and after the phase transition.
Figure 4-7 (a) Current-Time (I-t) curves under electrochemical potential from 7.5 mV to 75 mV applied on the SCO electrode, measured at 500 'C in air. (b) Normalized Current-Time (I-t) curves. The normalization is calculated using initial current L and final equilibrium current If (saturation current), the normalized current Int = (It - If)(Ii - If). The time axis is zoomed in to the
earlier stages of the relaxation in order to highlight the shape change of the I-t curves with increasing electrochemical potential. (c) Change of oxygen non-stoichiometry, i.e. A6, as a function of applied electrochemical potential. A6 is defined to represent the change of the oxygen concentration as a function of bias in the SCO lattice starting from the BM phase, i.e. change from SrCoO2.5 to SrCoO2.5+A6 The vertical line marks the electrochemical potential at the on-set of the BM-P phase transition in SCO (-26 mV, which corresponds to a
pO2effof 1 atm, as shown in Figure 4-3). The connecting lines are a guide for
the eye. (d) Semi-log plot of saturated current, If, as a function of the electrochemical potential on SCO. The vertical line marks the BM-* P transition
potential, same as in (c). Notice the slope change around the phase transition potential.
Figure 4-8 Example I-t curve under 75 mV applied electrochemical potential, showing the procedure of calculating number of transferred charges, measured at 500 0C
in air. Saturated current If was obtained when stable current density was reached, then a flat straight line was fitting to the curve. The shaded part was then integrated to yield the number of transferred charges.
Figure 5-1 (a)-(b) X-ray photoemission spectra evolution as a function of applied external bias at 300 'C, 760 mTorr pO2 (a) Sr 3d, (b) Valence band (VB) and (c)
Co 2p. Sr 3d spectra envelope is fitted with two groups of Sr 3d doublets, one to
represent the Sr 3dlattice shown in light blue and one for Sr 3d_surface shown in dark blue. The arrows indicate a shift to lower binding energy (BE) with increasing bias (The rigid shift in the BE has been subtracted according to the biases applied). (d) The BE shift as a function of applied bias summarized together for Sr 3d (both lattice and surface species), VB, 0 Is and Co 2p. All the core level and VB spectra BE positions were lowered by roughly the same amount while increasing the bias (within an error bar of 0.1eV).
Figure 5-2 In situ XRD data on SCO collected at T = 300 'C, P0 2 = 10-3 atm, as a function of electrical bias from 1 V to 4 V. Two SCO diffraction peaks, i.e. BM(002) (shown in (a)) and BM(008)/P(002) (shown in (b)), are shown to indicate the SCO phase under each bias applied. When BM->P transition occurs, the BM(002) peak is suppressed and BM(008) peak moves to higher 20 angle and forms P(002) peak. The phase of SCO under each bias (0-1 V: BM, 2-4 V: P) has been indicated in the figure.
Figure 5-3 0 K-edge and Co L2,3-edge X-ray absorption spectra as a function of applied electrical bias. (a) 0 K-edge spectra measured under different bias conditions at 300 'C, 760 mTorr p02 The three peaks observed corresponds to 0
2p states hybridized with Co 3d, Sr 4d and Co 4sp states, respectively. (b) The
pre-edge peak in 0 K-edge XAS spectra, showing the evolution of the peak with
0 2p-Co 3d characteristics. (c) Co L2,3-edge X-ray absorption spectra without
bias applied and with 4 V bias applied. The difference between the peak positions
of Co L3-edge peaks in the two spectra was -0.3 eV.
Figure 5-4 FY-XAS spectra of 0 K-edge (shown in a and b) and Co L-edge (c). The sharp peak at -531 eV in 0 K-edge FY-XAS spectra is from the absorption of the 02 gas molecules in the analysis chamber. The PEY- and FY- data collected
under a bias of 4 V was compared in b and c. The dash lines in b and c show that there is no photon energy different between FY and PEY for 0 K-edge pre-edge peak and Co L3-edge peak.
Figure 5-5 The branching ratio (BR) of Co L-edge XAS spectra by using two detection modes, partial-electron-yield (PEY) and fluorescence-yield (FY), as a function of applied bias. BR is defined as the intensity ratio of L3-edge vs. the summation of both L3- and L2-edge.
Figure 5-6 Resonant photoelectron spectroscopy (RESPES) on valence band of SCO. (a) Co L-edge XAS under no bias applied. The arrows indicate the position of the photon energy hv used for measuring the VB spectra in b and c; hv = 780 eV
for on-resonance, "on-res", and hv = 776 eV for off-resonance, "off-res". (b)
Comparing the VB spectra excited with hv = 776eV ("off res") and hv = 780eV ("on res"), as well as the difference between two spectra. The core level XPS peak at -19 eV, which contains 0 2s and Sr 4p levels, was used to align the intensity of two VB spectra. The enhancement of intensity at "on-res" measurement can be clearly seen, which is partially due to the Co L3VV Auger
peak indicated by the arrow. (c) The evolution of the resonant (on-res) VB spectra as a function of applied bias. The blue lines showed the difference spectra with respect to the spectrum with no bias applied.
Figure 5-7 Probing the kinetics of SCO phase transition. Data were collected at T = 300 'C, PO2 = 760 mTorr (a) 0 K-edge XAS spectra with no bias and with 4 V
bias applied. The dashed line indicates the position of the selected photon energy
(hv = 527.9 eV) for the measurement. The large difference in X-ray absorption
coefficient for BM and P-SCO is the premise for the dynamic measurement. (b) An example showing the dynamic measurement of the intensity at hv = 527.9
eV. When the bias was turned on (off), the intensity increased (decreased) following the phase transition process. (c) Evolution of the dynamic measurement, depicted as intensity difference vs. time curves as a funciton of bias. The dots are the normalized data while the solid lines are fitting curves using (5-1) and (5-2).
Figure 5-8 Fitting parameters, including time constants i and T2 (a), relative weight of two expoential terms al (b) and Avrami exponent n2 (c), obtained from the kinetic data shown in Figure 4(c). The solid lines and dashed arrows are guides for the eyes, representing the trend for the change of each fitting parameter. Figure 6-1 (a) Schematic illustration of the Ambient Pressure X-ray Absorption
Spectroscopy and X-ray Photoelectron Spectroscopy (AP-XAS, AP-XPS) measurements. Electrical bias was applied onto the VO, electrode while the absorption and photoelectron spectra were measured in operando.
Electrochemical pumping of oxygen out of the film transforms it from V205 to V02, and electrochemical pumping of oxygen into the film transforms V02 to
V205. (b) AP-XAS data as a function of electrical bias applied to the VOx/YSZ/Pt
electrochemical cell at T = 300 'C, PO2 = 200 mTorr. The dashed lines are guides to the eyes that mark changes in the spectral lines in the V L2,3-edge and 0 K-edge designated peaks. The black and red dashed lines mark the V205 and V02
features, respectively. A cathodic bias of -0.25V triggers the V205->VO2 transition under these conditions.
Figure 6-2 a) Valence band spectra on V02 (at an electrical bias of -2 V) and V205 (at an electrical bias of 0 V) at T = 300 'C, PO2 = 200 mTorr. Note that V02 is in its metallic rutile phase at the measurement temperature. Ef denotes the position of zero binding energy in the spectrum. b) The current relaxation (I-t curve) when an electrical bias step from 0 to -2 V was applied to V205 at time = 0 s,
transforming it to V02. Notice the increase in the current magnitude as a function of time, opposite to the expected decrease of the current magnitude in this oxygen coulometric titration configuration.
Figure 6-3 X-ray absorption spectra as a function of applied electrical bias and time obtained from the VOx/YSZ/Pt electrochemical cell maintained at T = 300 'C, PO2 = 200 mTorr. The progression of the experiment indicated by the upward arrows shows the stability and cyclability of the electrochemically triggered phase transition in VOx. From bottom to top: a) The V02 phase was obtained at -2 V, and remained stable after removing the bias and keeping the cell at open circuit potential (OCP) condition. b) As soon as the V02 top electrode was shorted to the bottom Pt electrode (setting the electrochemical cell bias to 0 V), the V02 changed to the V205 phase. c) V205 remained stable after removal of
the bias (remained unchanged for the 30 minutes of the measurement); d) An electrical bias of -2 V again switched the V205 back to V02.
Figure 6-4 Dynamic X-ray absorption measurements. a) The V L2,3-edge and 0 K-edge regions of the X-ray absorption spectra at 0 V and -2 V obtained from the VOx layer as part of the VOxIYSZ/Pt electrochemical cell operating at T = 300
'C, PO2 = 200 mTorr. V205 is stabilized at 0 V and V02 at -2 V. The dashed lines mark the two photon energies (517.7 eV and 529.2 eV) where large changes in the X-ray absorption intensity exist when switching from one phase to the other.
(b) Applied sine wave electrical bias (green dashed line) with a frequency of 10
mHz, and the corresponding periodic changes of X-ray absorption intensity at the two selected photon energies in the V L3-edge region at 517.7 eV (red data points) and in the 0 K-edge region at 529.2 eV (blue data points). Note that the two curves are approximately180 degrees out of phase. (c) Frequency-dependency of the dynamic X-ray absorption intensity at hv = 517.7 eV in the V
L3-edge region, measured during cycling of the electrical bias applied to the VOx/YSZ/Pt electrochemical cell at several frequencies (5, 10, 25 and 100 mHz) with a peak-to-peak variation of 2 V as in (b). At 5 mHz the absorption intensity reached plateaus both under 0 and -2 V applied bias, with the amplitude of X-ray absorption intensity gradually decreasing with increasing frequency.
Figure 6-5 X-ray photoelectron spectra of (a) V 2p and (b) valence band (VB) before and after ionic liquid (IL) gating, compared with AP-XPS results. 1) & 3) In situ
AP-XPS measurements under applied electrical biases of -2 V and 25 mV, which
corresponds to V02 and V205 phases, respectively. 2) Ex situ XPS on VO, sample after applying -2 V electrical bias at 300 'C and cooling it to room temperature. The XPS data at this state was similar to the in situ AP-XPS data on V02. 4) After ionic liquid gating at 4 V. The V 2p peak was similar to the in situ AP-XPS spectrum under 25 mV, while the V 3d states at 0 eV binding energy disappeared, confirming the transformation to the insulating V205 phase. The
dashed lines in (a) are the XPS peak fitting results showing the contribution of different oxidation states (V5' and V4,). While the V 2
p3/2 spectra in 3) and 4) can be fitted with a single peak, indicating the fully oxidized V5, chemical state, the spectra in 1) and 2) consist of two peaks, corresponding to the mixed V5+ and
V4+ states.
Figure 7-1 In operando Pr M4,5-edge measured at T = 450 'C and PO2 = 200 mTorr,
as a function of applied electrochemical potential on (Pr,Ce)02 electrode. (a) Two end-member spectra under 0.5 V and XAS spectrum under 0 V bias, which shows that the 0 V spectrum is a superposition of two end-member spectra. The dashed lines indicate the peak position of Pr3+ and Pr4' oxidation states. (b) Pr
M4,5-edge spectra in the bias range of -0.5 V-0.5V. The lines are the linear
combination of spectra under -0.5 V and 0.5 V by choosing the proper [Pr 4
] concentration to reconstruct the data. Dash lines are guides to the eyes to point out the change of the line shapes as a function of applied bias.
Figure 7-2 In operando X-ray photoelectron spectra of Ce 3d at 0.5 V and -0.5 V applied electrical biases. The line shapes were almost identical, while the peak shift is due to the shift of Fermi level induced by applied electrochemical potential (i.e., electronic shift rather than chemical shift).
Figure 7-3 (a) Pr 4 fraction, i.e. [Pr 4 ]/([Pr3+]+[Pr4+]), as a function of applied bias. The data points were extracted from spectra reconstruction results shown in
Figure 2. (b) Reduced Pr cation concentration (i.e, [Pr3+]/([Pr]+[Ce]), shown in
Kriger-Vink notation PrPr ) as a function of effective PO2 (pO2,eff, calculated
from applied bias using Nernst Equation). The blue dots are literature data reported by Chen et al.16 on bulk thin film PCO.
Figure 7-4 In operando resonant photoelectron spectra (RESPES) on PCO. (a) Photon energies selected for RESPES. The off-resonance (off-res) valence band (VB) spectra were collected at an exciatation energy before the Pr M4,5-edge, while the on-resonance (on-res) VB spectra were measured at photon energies which correspond to the positions of Pr3+ and Pr4' XAS peaks. (b) Representative RESPES VB spectra at off-resonance and on-resonance photon energies, under applied biases of -0.5 V, 0 V and 0.5 V. The VB spectra were normalized by 0
2s peak at -20 eV. (c) On-resonance VB spectra measured at an excitation energy
of 932.6 eV (the maximum XAS peak of Pr 4 ). The binding energy was shifted
to align the Fermi edge, allowing for the comparison of the line shapes. The arrow shows the direction from negative bias to positive bias (reducing ->
oxidizing). (d) Valence band maxima (VBM) extracted from the RESPES VB spectra, as a function of applied bias. (e) Schematic showing the electronic structure of PCO. The measued 1.3 eV difference represents the distance from 0
2p band to Pr 4f band.
Figure 8-1 X-ray diffraction results on strained NNO thin films on YSZ of different orientations. The black dash lines indicate the expected peak positions for NNO
(101) and NNO (200) without the presence of lattice strain.
Figure 8-2 Ni L2,3-edge X-ray absorption spectra of Nd2NiO4+5 (NNO) thin films under (a) compressive (grown on YSZ (110)) and (b) tensile strain (grown on YSZ (111)) collected at T = 450 'C, PO2 = 1x10⁻³
atm and applied biases of
-0.75 V--0.75 V. The shoulder peak of L3-edge was observed to be higher for
tensile strained NNO, indicating a higher concentration of Ni3
+ oxidation state, as indicated by the green dashed line.
Figure 8-3 0 K-edge X-ray absorption spectra of Nd2NiO4+a (NNO) thin films under (a) compressive (grown on YSZ (110)) and (b) tensile strain (grown on YSZ
(111)) collected at T = 450 'C, p02 = 1x10⁻³ atm and applied biases of -0.75 V-0.75 V. The strong dip at -530 eV, as well as irregular shape at -538 eV and
-541 eV are due to the absorption caused by oxygen molecules in the analysis chamber2 21
Figure 8-4 Quantified (a) Ni3+ peak area (represented as the weight ratio in the total
intensity of Ni peak) and 0 K-edge pre-edge peak area plotted as a function of applied biases.
Figure 8-5 Ni3+ peak area extracted from Ni L2,3-edge spectra (Figure 4(a)) plotted
against 0 K-edge pre-edge peak area (Figure 4(b)) to show the correlation between the concentrations of holes in Ni 3d and 0 2p states. The dashed diagonal line acts as guide to the eyes.
Figure 9-1 Ionic liquid and ion gel gating on the Brownmillerite (BM) phase SrCoO2.5
(SCO) and the effect on thermal transport property. (a) Schematic showing the ionic liquid gating of SrCoO2.5. (b) X-ray diffraction showing BM-SCO(008) diffraction peak, hydrogenated SrCoO2.5 (H-SCO) (008) peak after -4 V ionic liquid gating as well as oxygenated perovskite SrCoO3 (P-SCO) after +3 V gating. The shoulder peak in H-SCO at higher 20 position is due to the non-switched part of the sample under the silver electrode used. (c) Schematic showing the ion gel gating of SrCoO2.5. (d) Estimated overpotential distribution
in SCO thin film sample before the hydrogenation reaction. The overpotential decreases with positions further away from the contact due the ohmic loss from the resistance of SCO thin film. The dashed lines matches the position in the overpotential gradient with the positions in the optical picture of the sample (inset).
Figure 9-2 (a) X-ray diffraction data showing the SCO (002) diffraction peak of
P-SCO obtained by using either ion gels (denoted as gel) or ionic liquid (denoted
as liq.) gating. The diffraction peak at lower 20 angle in the data of P-SCO (gel) was due to the part that was not covered with ion gels and thus not switched to
P-SCO. (b, c) X-ray absorption spectra of Co L2,3-edge (b) and 0 K-edge (c)
measured on P-SCO (gel) and P-SCO (liq.).
Figure 9-3 (a) Raw TDTR data (circle markers) and best fits (lines) for H-SCO (orange), BM-SCO (blue) and P-SCO (green). The H-SCO and P-SCO were gated by using ionic liquid. (b) Thermal conductivity of BM-SCO, H-SCO and P-SCO (gated by either ionic liquid (denoted as liq.) or ion gel (denoted as gel)
measured by time-domain thermoreflectance measurements. Also, the thermal conductivity of an SCO thin film which was subjected to a BM-P->BM cycle was measured (marked as rev.). The error bars are from variations between several measurement spots.
Figure 9-4 (a) Thermal conductivity of SrCoOx plotted as a function of applied electrical bias (anodic) at 300 'C. (b) XRD results on SrCoOx after applying electrochemical potentials at 300 'C. The gradual transition from mixed BM+P phases to single P phase was observed. (c) Expected correlation between thermal conductivity k and the average oxygen stoichiometry x in SrCoOx. The blue symbols indicate the data points in (a) and (b) obtained by applying electrical biases at 300 'C, while the P-SCO (gel) and P-SCO (liq.) are also plotted in the figure for comparison.
Figure 9-5 X-ray absorption spectra collected using partial-fluorescence-yield (PFY) mode on hydrogenated SrCoO2.5 thin film by using ion gels. (a-b) 0 K-edge (a) and Co L-edge (b) spectra measured at different positions of the sample. Numbers 1-6 indicate the measurement spots, i.e. 1 is as-grown BM-SCO part, while going from spot 2 to spot 6, the concentration of protons decreases. The shaded part in (a) shows the pre-edge peak area where appreciable changes were observed. The blue dashed line in (a) and orange dashed line in (b) indicate the photon energies used for line scans in (d) and (e). The black dashed line in (b) indicates the maximum intensity position of Co L3-edge in BM-SCO. (c) The positions of measurement spot 1-6, with estimated overpotential distribution in the SCO thin film (see Figure 9-1(d)). (d, e) Line scans at fixed photon energy of 529.4 eV (d, in the range of 0 K-edge pre-edge peak, indicated by the blue dashed line in (a)) and 779.4 eV (e, in the range of Co L3-edge, indicated by the orange dashed line in (b)).
Figure 9-6 The effect of H+ concentration on thermal transport property of SCO. (a) Co L2,3-edge XAS spectra fitted with linear combinations of spectra measured at spot 1 and 2. The symbols are measured data while the lines are the fittings. (b) Thermal conductivity (in red symbols) of ion gel hydrogenated SCO measured along the H' concentration gradient. In the same plot, the relative H+ concentrations deduced from the spectra fitting results in (a) were plotted in square symbols, referenced to the spectrum measured at spot 2.
Figure 10-1 Schematic showing the summary of this thesis, which includes the main approaches taken for tuning of oxygen defect chemistry of functional oxides.
Chapter 1. Introduction
1.1. Motivation
Point defects (OD defects) are essential building blocks for a variety of important properties
and functionalities of oxides. Among the ionic defect species, oxygen defects (usually in the form of oxygen vacancies, though oxygen interstitials can also be majority defects in some unique structures) are of particular importance due to the high mobility at relatively low temperatures (compared with cation defects). Therefore, oxygen defects can be easily engineered to tune the physical and chemical properties of functional oxides, including but not limited to electronic structures', lattice constants2, oxygen diffusivity3, magnetic properties4, thermal transport property5 and superconductivity' 7. Therefore, the concentration and structure (e.g. ordering) of oxygen defects can directly determine the functionality and performance of oxides in technologically relevant applications, ranging from solid oxide electrochemical cells8, thermochemical fuel production9, electrocatalysis'1 to memristive devices" and multiferroics . Some of these examples are summarized in Figure 1-1. Therefore, in order to maximize the figures of merit for each individual application, one needs to first gain a fundamental understanding of the mechanisms for tuning the oxygen defect chemistry. Although defect engineering is a subject in materials science with a long history, and for most oxide systems defect chemistry models have been successfully constructed14, new challenges and opportunities emerge when the dimensions of functional oxides are greatly reduced down to nanoscale (nanoionics)'. Moreover, with the ever shrinking of the materials dimensions, it imposes new constraints to the characterizations of oxygen defects and the properties altered by defects'6. In situ and in operando materials characterization tools are often needed due to the constraints imposed by the operation conditions of multiple applications, requiring the development of novel measurement techniques.
With the goal of addressing some of the challenges mentioned above, the scope of this work is essentially enriching the toolbox for tuning oxygen defect chemistry of oxides in nanoscale (for example, the oxygen defects in thin films or the local defect distribution at
surfaces). Also, this work intends to highlight advances in situ characterizations of chemical states, crystal structures and electronic structures, in order to link the application-relevant properties with oxygen defect chemistry at the same environmental conditions.
A o2- ON Tuni Elec hemistry Chemical Redox expansion coupling ET Magnet lasticity WE Piezoelectricity Magnetoelectricity Alternating bias VWE Displacement
c0
VCEFigure 1-1 Examples of the influence of point defects (oxygen non-stoichiometry) on the physical, chemical properties and functionalities of oxides. (a) The generalization of the famed Fiebig-Spaldin diagram by adding another dimension considering the concentration of ionic species, illustrating that the physics of multiferroics can be drastically altered when the concentration of ionic species are changed. Reprinted with permission from Ref. 17. (b) The role of point defects in memristor devices relying on the valence change mechanism, revealed by local probing of electronic structure. Reprinted with permission from Ref. 18. (c) Oxygen defect enabled ionic transport, exemplified by the simulated oxide ion diffusion pathway in Ruddlesden-Popper phase oxides. Reprinted with permission from Ref. 19. (d) Solid-state high-temperature actuators consisting of non-stoichiometric (Pr,Ce)02_s as the active material, utilizing the chemical expansion induced by the change of oxygen vacancy concentration in the structure. Reprinted with permission from Ref. 20.
1.2. Toolbox for Tuning Oxygen Defect Chemistry
The aim of this section is to provide a concise overview on the different mechanisms for tuning oxygen defect chemistry, which are summarized in Figure 1-2. The establishment of oxygen defect chemistry equilibria relies on the exchange of lattice oxygen in oxides with oxygen molecules in the gas phase. At equilibrium, the chemical potential of lattice oxygen (in this case in the form of charge neutral oxygen) must be equal to one half of the chemical potential of gas phase oxygen molecule, i.e.,
yo = 1/2 Mo2 = 1/2(po2 + kB p 2 p 2 (1-1)
In the equation above, the chemical potential of lattice oxygen puo is directly related to the oxygen non-stoichiometry of the oxide, while the chemical potential of the gas phase has
a standard condition term It 2 (at the condition of fixed temperature T and standard
pressure po2) and a term determined by the actual oxygen partial pressure Po2. Therefore,
it is easy to see that the oxygen non-stoichiometry can be changed by varying the
environmental po2. A more direct way of representing the oxygen non-stoichiometry
change can be obtained by considering the defect chemical reaction below:
Ox -> 1/2 02 + V~ + 2e' (1-2)
Here the oxygen non-stoichiometry is represented by the formation of oxygen vacancies (ionic defects) and electrons (electronic defects), shown in Kr6ger-Vink notations. Notice that the electronic defects can either be free electrons in the conduction band or polarons localized on ion sites (such as the case of CeO24 where electronic defects form localized
Cece polarons21, similar situation was observed in Pr-doped ceria, see Chapter 7). Based
on the defect chemical reaction, one can write the chemical potential relationship for each species as:
1/2 Mo2 + pv +
2pe' = 0 (1-3)
The chemical potential for each component can be expressed as the summation of a standard term and a concentration term, therefore the equation above can be rearranged as below:
puj= kBT C9+ j), =V e' (1-4)
1/2 0S + 2pypf cv C ,
- 64 =1/2 In - + 1n
(
C + 2 1n(
C)
(1-5)kBT p0 c - Cv0 Ce, - Ce,
In the equation above, c9 is the concentration of all the available sites for ionic or electronic
defects. If we define the Gibbs free energy of reduction reaction as AGO9
ed = 1/2 P 2 +
P 0 + 2pel,, then the classic law of mass action of chemical equilibrium can be reached as
below:
1/2 Cy
N
Ce 2 (AGO~ed- V xp -=Kred (1-6)
P02 cVk
-CV6 Ce, -Ce, ke )
In the equation above, Kred is the equilibrium constant for reduction, which is directly
linked to the thermodynamic parameter AGroed. Notice that in the dilute limit, the concentration terms in the denominator can be reduced to c9.
Equation (1-6) contains an important implication for tuning oxygen non-stoichiometry, i.e. oxygen defect concentration can be not only changed intrinsically by changing T or PO2, but can also be altered extrinsically by modifying the thermodynamic parameters. The "extrinsic" effects can be achieved most traditionally by changing the composition of oxides, i.e. by introducing cation dopants. This is straightforward to understand since the introduced dopant can directly change the chemical bonding between metal cations and oxygen, therefore affect the reducibility of the oxides. On the other hand, compared with the studied compositional effect, the effect of lattice strain is much less well-understood. Lattice strain has been shown to have additional impact on the oxygen defect chemistry equilibria due to the chemo-mechanical coupling.2 2 Therefore, lattice strain effect introduced by hetero-nanostructuring23, thin film epitaxy24 or free standing membranes2 5 can potentially change the formation energy of oxygen defects. However, the trend of lattice strain effect on oxygen defect formation is observed to be complicated. While in (La,Sr)CoO3-x 2 4, biaxial tensile strain was shown to lower the formation energy of oxygen vacancies, a more recent work on CeO2-6 showed that the effect of strain is not
monotonic21. Therefore, the effect of strain might be highly material-dependent and needs much further work for a better quantitative understanding.
V
0Figure 1-2 The toolbox for tuning oxygen defect chemistry. (a) "Extrinsic" effects, including changing oxygen defect concentrations by chemical doping and using lattice strains. Figures reprinted with permissions from Ref. 27 and 24. (b) Electrostatic effects introduced by the creation of higher order defects including 1D defects (dislocations) and 2D defects (interfaces). Figures reprinted with permissions from Ref. 28 and 29. (c) Electrochemical effect introduced by applying electrochemical potentials onto a functional oxide in contact with solid oxide electrolyte. Reprinted with permission from Ref. 30.
In addition to and different from the extrinsic effects mentioned above, another important method of tuning oxygen non-stoichiometry relies on the charges of oxygen defects which make their equilibria responsive to electrical bias. Since oxygen point defects are charged and mobile at elevated temperature, the distribution of oxygen ionic defects can thus be
a
Cation doping
Lattice Strain Effect
0 15 Wb 0.0 100 0 AaM A ~ a14. 0.00 -4 -3 -2 rem era0r IMOI)bm
C
Electrochemical
PotentialElectrolyte Electrode Gas
Po,.ixit pa'o.,
b
Dislocations
Vwac char c IaNer dislocatw core
Interfaces
se,
o d e
changed by electrostatic potential
4).
If an electrostatic potential is introduced to the system,then the equilibrium condition needs to be modified to satisfy the constancy of the electrochemical potential of charged defects, defined as below:
fi= Pi + zLe4 = Y1 + kBTln (o C
)
+ zieo (1-7)In the equation above,
fi
is the electrochemical potential (or called generalized chemicalpotential), zi is the number of charges of the defects, while qb is electrostatic potential. At
the equilibrium, since
fi
must be equal at different location of the system, the concentrationof the charged defects, therefore, will be determined by the profile of electrostatic potential. The electrostatic effects are often introduced by the creation of higher order defects, i.e. dislocations (ID) and interfaces/grain boundaries (2D). Due to the discontinuity in the symmetry and often more opened structure at these extended defects, the formation of
oxygen vacancies is usually easier at the defect core compared with the bulk3"1 2, which
leads to charging of the defect core and the formation of space charge zone in the surrounding region (see Figure 1-3(a)). The segregation energy of oxygen vacancies in the
core is determined by the difference between p4vcore and ptg,
bul.*The extra positive
charge in the core then will deplete the oxygen vacancy concentration in the surrounding space charge zone by lowering pv. The electrostatic effect induced by the grain boundaries is well studied with details. Ref.33 is a recent thorough review on this topic. On the contrary, the space charge layers introduced by dislocations or hetero-interfaces are much less well-understood, though recent studies have shown the effects on several oxide systems. The space charge effect introduced by dislocations was investigated with details
in TiO22 8 and SrTiO334, where a large change in oxygen vacancy concentration and
electrical conductivity could be achieved by creating edge dislocations. Moreover, in
complex oxide La2CuO4, the space charge effect was clearly incorporated by inserting on
layer of SrO via the layer-by-layer oxide thin film deposition, and the electrostatic effect was captured by electron microscopy and spectroscopy.
a
core
b
WE CE0v
2eq5
2e4b
solid electrolyte
space charge zone (e-g. y
(e.g. YSZ)
Figure 1-3 Profiles of chemical and electrochemical potential of oxygen ionic defects (exemplified by oxygen vacancies) in two scenarios. (a) Electrostatic effect introduced
by a charged core (e.g. extended defects such as dislocations or grain boundaries). (b)
Electrochemical potential applied by using a solid electrolyte (for example yittria stablized zirconia, YSZ). WE and CE denote for working and counter electrode, respectively.
Unlike the electrostatic effect which is highly dependent on the extended defects and sample fabrication processes, applying electrochemical potential is perhaps a more generally applicable method that utilizes the charged nature of oxygen ionic defects. If the oxide of interest is used as electrode in contact with a solid electrolyte (most commonly yittria stablized zirconia, denoted as YSZ), then it is possible to apply a bias to change the electrostatic term in the electrochemical potential expression, as shown in Figure 1-3(b). The most important advantage of this electrochemical approach, compared with other methods of tuning oxygen non-stoichiometry, is the ability of controlling oxygen defect concentration on demand after the fabrication of oxide samples, while the other effects (compositional or extended defects) are essentially "frozen-in". Therefore, the
electrochemical effect was applied to a variety of functional oxides with both perovskite3
-39 and fluorite2 6,30,40-42 structures to change the oxygen non-stoichiometry and related
properties. The large tunable range of oxygen stoichiometry induced by the electrochemical effect can readily cross the phase boundaries and trigger topotactic phase transitions, which is a feasible way to access the distinct properties of different phases of
oxides. In addition, since oxygen defect concentration is changed conveniently by applying voltages, the electrochemical effect provides opportunities for in operando measurements
combined with electrical measurements4 3, X-ray diffraction4" 7, impedance
spectroscopy30,39 and X-ray photoelectron spectroscopy'4-0 to gain a fundamental
understanding on the impact of oxygen defects on the crystal and electronic structure of oxides.
1.3. Thesis Overview
Having introduced the importance of oxygen point defects and the different methods that can be used to tune the oxygen defect chemistry, the following chapters of this thesis focus on using those methods in specific cases studies on model oxide systems to investigate the tuning oxygen stoichiometry. In particular, the novel contributions of this thesis can be summarized as follows:
1) Heterogeneous chemical doping of the surface to control surface oxygen defect
chemistry, and improving the surface electrocatalytic activity and stability of a perovskite oxide,
2) Control of phases of oxides via electrochemical potential, with resulting drastic changes in electronic and phonon transport properties,
3) Elastic strain engineering to alter the oxygen interstitial equilibria, with
implications for oxygen exchange kinetics. The chapters of the thesis are summarized below:
Chapter 2 introduces the physical principles of important oxide sample growth, structural and chemical characterization experimental methods. These experimental approaches are crucial for fabricating oxide samples with simplified geometry and characterizing the different effects in tuning oxygen non-stoichiometry in situ and operando.
Chapter 3 focuses on the tuning of surface oxygen vacancy concentration of (La,Sr)CoO3
(LSC) by surface chemical decoration. This approach essentially uses the extrinsic effect
mentioned above, while the compositional change is controlled to be localized at the surface region of LSC. Different cations are introduced to the LSC surfaces that can either
raise or lower the formation energy of oxygen vacancies, and the effect of the dopant cations on surface stability is characterized in situ. Finally, the insights gained on the surface non-stoichiometry and stability is used to reach the conclusion relating the surface oxygen defect chemistry and long-term surface catalytic activity.
Chapter 4 and Chapter 5 focus on the capability of electrochemical effect. By choosing a
unique oxide system SrCoOx (denoted as SCO), the electrochemical effect is shown to feasibly trigger the topotactic phase transition by changing oxygen non-stoichiometry, which provides a novel and convenient way of drastically changing the structure, electronic states as well as functionalities of oxides. Chapter 4 focuses on the implementation of the electrochemical effect on SCO as well as in situ structural characterizations showing the
phase transition triggered by applied biases. Chapter 5 describes the investigation of
electronic structure evolution during the electrochemically driven phase transition in SCO,
by using in operando X-ray spectroscopic tools. A thorough understanding on the changes
of structure and electronic structure induced electrochemically can be obtained by putting the results in these two chapters together, which can potentially guide the designing of this functional oxide in applications including memristors or electro-catalysis.
Chapter 6 and Chapter 7 are extension work originated from the electrochemically driven phase transition in SrCoOx. The idea is essentially applying the electrochemical effect to other oxide system of technological importance. Chapter 6 demonstrated a novel type of metal-insulator-transition achieved electrochemically in vanadium oxide. Cyclable phase
transition between V02 (metallic phase) and V205 (insulating phase) can be triggered by
applying a cyclic overpotential. In Chapter 7, surface defect chemistry of (Pr,Ce)O2.s is studied in a very wide effective pO2 range achieved electrochemically. The surface chemistry equilibrium is shown to be distinct from the equilibrium of the bulk. The reduced praseodymium cation concentration is shown to be much higher at the surface region compared with the bulk, even in highly oxidizing conditions. The work summarized in these two chapters prove again that applying electrical biases is an effective way of tuning oxygen defect chemistry, which can be used for studying new physical and chemical phenomena.