Appropriate Technology Water Treatment Processes
for MaeLa Temporary Shelter, Thailand
By
Katherine Ann Vater
S.B. Environmental Engineering Science, 2007
Massachusetts Institute of Technology
Submitted to the Department of Civil and Environmental Engineering
in Partial Fulfillment of the Requirements of the Degree of
Master of Engineering
in Civil and Environmental Engineering
at the
MASSACHUSETTS INSTITUTE OF TECHNOLOGY
June 2008
©
2008 Massachusetts Institute of Technology
All rights reserved
Signature of Author
Katherine Ann Vater
Department of Civil and Environmental Engineering
May 9, 2008
Certified By
Peter Shanahan
Senior Lecturer of Civil and Environmental Engineering
Thesis Supervisor
Accepted By
Daniele Veneziano
Chairman, Departmental Committee for Graduate Students
MASSACHUSETTS INSTrIUTE
OF TECHNOLOGy
JUN 12 2008
LIBRARIES
Appropriate Technology Water Treatment Processes
for MaeLa Temporary Shelter, Thailand
By
Katherine Ann Vater
Submitted to the Department of Civil and Environmental Engineering
on May 9, 2008
in Partial Fulfillment of the Requirements of the Degree of
Master of Engineering in Civil and Environmental Engineering
ABSTRACT
This thesis recommends the use of horizontal-flow roughing filters to treat spring water of variable annual quality in MaeLa Temporary Shelter, Thailand. The public drinking water system for 45,000 refugees is overseen by Aide M6dicale Intemacionale, with which this project was conducted. Half the drinking water for the camp is provided by thirteen springs. The volume and turbidity of these springs varies annually, correlating with the rainy and dry seasons.
Treating the varying turbidity and volume at these sources so that the water can be
effectively disinfected is the treatment goal. Available materials and operation and
maintenance capabilities are also design parameters. Horizontal-flow roughing filtration was determined to fit these parameters and a design with two equivalent filters operating in parallel is recommended. One important feature of the filters is baffles that dictate the flow path of water through the filter. A second feature is an outflow at the top of the filter that will maintain a constant water volume in the filter. The feasibility of the design is based on flow tests and turbidity measurements taken on site as well as weekly flow rates and
turbidities for 2007 provided by AMI. The requirements for mechanical regeneration of the filter are also determined.
Thesis Supervisor: Peter Shanahan
ACKNOWLEDGMENTS
To my mom and my sister, who have made me the person I am today.
To Pete Shanahan, who provided invaluable support and advice throughout this year.
To my best friends, Liz Tree and Jessie Witte, who are always there, whether I need them or not.
To Mary Harding, who is always up for an adventure.
To Percy Link, who has made the year infinitely more entertaining and enjoyable.
To AMI and Daniele Lantagne, without whom this project would not have existed.
To James, Patrick, Klo T'hoo, and the rest of the AMI Logistics Team, for your help during my field work and with all my best wishes for the future.
To the CEE faculty and staff, who have challenged and supported me throughout the past five years. In particular, to those associated with the MEng program for the administration of such a successful program.
TABLE OF CONTENTS
ABSTRAC ... . . . ... 3
ACKN OW LED GM ENTS ... 5
TABLE OF CON TEN TS ... 7
LIST OF FIGURES ... 9
LIST OF TABLES... ... 10
LIST OF ABBREVIATION S ... ... 11
1 IN TROD UCTION ... ... 13
2 THE THAILAND - MYANMAR (BURMA) BORDER... 15
2.1 Politics ... 15
2.2 Economy ... 16
2.3 Climate in N orthwestern Thailand ... ... 17
2.4 M aeLa Camp... ... 17
2.4.1 Population D em ographics... 18
2.4.2 Environm ent... ... 19
2.4.3 Public H ealth and W ater Supply... 21
3 D RIN KIN G W ATER IN M AELA ... 23
3.1 D rinking W ater Sources ... 23
3.2 W ater System Layout ... 25
3.3 W ater Q uality... ... 26
3.4 Existing W ater Treatm ent ... 28
3.4.1 D isinfection ... ... 28
3.4.2 Filtration ... 29
4 SPRING WATER QUALITY IMPROVEMENT... ... 33
4.1 D esign Param eters ... ... 33
4.1.1 Turbidity... 33
4.1.2 Bacterial Loads ... 34
4.1.3 Site Specific Parameters... 35
4.2 Pre-treatm ent ... 36
4.2.1 Plain Sedim entation ... 36
4.2.2 Storage Tanks... ... 37
4.2.3 Roughing Filtration ... 37
4.3 Additional treatm ent processes ... .... ... 41
5 FIELD W O RK ... ... 43
5.1 Turbidity... 43
5.1.1 M easurem ent M ethods ... 43
5.1.2 O bservations ... ... 45
5.2 Filter Flow Tests ... ... 45
5.2.1 M easurem ent M ethods ... 45
5.2.2 Observations ... 46
5.3 M icrobial Sam pling ... ... 46
5.3.1 M easurem ent M ethods ... 47
5.3.2 O bservations ... 47
6 RESULTS ... 49
6.1 SP-10 Cleaning and Baffle Addition ... .... ... 49
6.2 Turbidity... 49
6.2.1 Results ... ... 51
6.2.2 Sam pling Technique Com parison... ... ... 52
6.3 Filter Flow Tests ... 53
6.3.1 Theoretical Residence Tim e ... 53
6.3.2 Tracer ... ... 54
6.3.3 Results ... 54
6.3.4 Coefficient of Filtration for Spring 10 Filter... .... .. 56
6.3.5 Extrapolation of Filter Coefficient ... ... 58
6.3.6 Filter Length ... 59
6.4 M icrobial Sampling ... ... 60
7 RECOM M EN D ATION S... ... 63
7.1 SP- 10 Filter M odifications ... 63
7.1.1 SP-10 Box A and VFRF ... ... 63
7.1.2 O utflow collection chamber for existing filter ... .. 63
7.1.3 Second equivalent filter... 66
7.1.4 M aintenance... ... ... 67
7.2 G eneral filter design ... ... 70
REFEREN CES ... 71
LIST OF FIGURES
Figure 2-1: Average Monthly Rainfall for Mae Sot, Thailand (GOSIC, 2007). ... .. 17
Figure 2-2: Location of the MaeLa Refugee Camp ... 18
Figure 2-3: UN Refugee Camp Populations and Demographics (UNHCR, 2006)... 20
Figure 2-4: MaeLa Location, looking southwest ... ... 21
Figure 3-1: Division of 2007 Flow Volume from Storage Tanks by Source ... 24
Figure 3-2: Annual Rainfall and Spring Flow Averages (AMI, 2007; GOSIC, 2007).... 24
Figure 3-3: Major Water System Components ... ... 25
Figure 3-4: Schematic of SP- 10 collection infrastructure... ... 26
Figure 3-5: 2007 Turbidity at Spring 10 ... ... 27
Figure 3-6: Residual Chlorine Levels for January- August 2007 (AMI, 2007). ... .. 28
Figure 3-7: Internal wall of SP-10 HFRF ... ... ... 29
Figure 3-8: Inflow pipe to SP-10 HFRF. ... ... 30
Figure 3-9: 2007 SP-10 Turbidity at collection Box A and at storage tank... 31
Figure 4-1: Surviving coliforms as a function of influent ... 35
Figure 4-2: Roughing Filter Schematics ... 38
Figure 4-3: General Layout of a Horizontal-Flow Roughing Filter ... 39
Figure 5-1: Turbidity measuring devices ... ... 44
Figure 5-2: Spring-10 Roughing Filter Flow Paths... ... 46
Figure 6-1: Cleaning the HFRF media ... 50
Figure 6-2: Plan View of Spring-10 Roughing Filter Flow Path with Baffles ... 50
Figure 6-3: Turbidity along SP- 10 collection infrastructure...
... 51
Figure 6-4: Dry season flow test results ...
....
... 55
Figure 6-5: Effluent turbidity as a function of filter length and flow condition ... 60
Figure 7-1: Slotted outlet pipe... 64
Figure 7-2: Design of outflow collection chamber. ...
... 65
Figure 7-3: Design of outflow pipe at top of filter. ...
... 66
LIST OF TABLES
Table 3-1: 2007 Monthly Average Turbidity at Springs in NTU... . 27
Table 4-1: Pre-treatment based on Influent Turbidity... ... 37
Table 4-2: General HFRF Dimensions ... 39
Table 4-3: HFRF Medium Size Ranges... 40
Table 4-4: HFRF Filtration Rate Ranges and Associated Performances...
40
Table 6-1: SP-10 Treatment Processes...
51
Table 6-2: Turbidity by location and measurement device ...
53
Table 6-3: Tracer Test Mass Conservation ...
... 56
Table 6-4: Spring 10 Flow Scenarios and Filter Coefficients ...
58
Table 6-5: Distribution System Microbial Sampling Results...
61
LIST OF ABBREVIATIONS
C - degrees Celsius
AMI - Aide M6dicale Internacionale
CFU mL' - Colony Forming Units per milliliter cm - centimeters
E. cdi - Esoeriob cdi
g- grams
HFRF - horizontal-flow roughing filter kg mf3 - kilograms per cubic meter
km - kilometers
KNLA - Karen National Liberation Army m - meters
m hr; - meters per hour m mirn' - meters per minute m3 - cubic meters
m3 min' - cubic meters per minute mg - milligrams
mg L) - milligrams per Liter min - minutes
mL - milliliters mm - millimeters
NGO - Non-governmental organization NTU - Nephelometric Turbidity Unit ppm - parts per million
RF - roughing filter
SP - spring drinking water source in MaeLa SP-10 - Spring 10
SP-X - Spring X
TBBC - Thailand Burma Border Consortium UN - United Nations
UNHCR - United Nations High Commissioner on Refugees UNICEF - United Nations Children's Fund
USD - United States Dollar
US EPA - United States Environmental Protection Agency VFRF - vertical-flow roughing filter
1 INTRODUCTION
Among the 1.1 billion people worldwide without UN-qualified improved drinking water, refugees are a population with unique needs (UNICEF & WHO, 2004). According to the 1951 Geneva Refugee Convention a refugee is defined as,
"A person who, owning to a well-founded fear of being persecuted for reasons of race, religion, nationality, membership of a particular social group or political opinion, is outside the country of his nationality and is unable or, owning to such fear, is unwilling to avail himself of the protection of that country" (UNHCR, 2003).
Upon fleeing, refugees find themselves reliant on local governments and NGOs to provide assistance with basic human needs. For over twenty years, Karen people have been fleeing Myanmar (Burma) to Thailand to escape persecution from the military junta which is
in power. There are two million refugees living legally and illegally in Thailand along the
Myanmar (Burma) border, including 50,000 in MaeLa Temporary Shelter (TBBC, No Date;
UNHCR, 2007).
MaeLa has existed for over twenty years and has an improved water system. The water is drawn from a nearby river and from springs, is chlorinated in most cases, and released into a pipe-tap network Seasonal variation in rainfall results in variable water quality from both sources. The purpose of this thesis is to evaluate and propose modifications to an existing roughing filter, which is in use at one of the springs. In addition, the design of a flow-scalable roughing filter is discussed for potential use at the other springs. The successful implementation and maintenance of filters can help maintain spring-water quality at an annual average, dampening the impacts of seasonal rain variation. The Thailand-Myanmar (Burma) border climate, economics, and history are further discussed in Chapter 2. Chapter 3 outlines the water system in MaeLa, including the locations of the various sources and some information on seasonal water quality variation. Chapters 2 and 3 were the result of a collaboration of the author, Mary Harding, and Navid Rahimi. Roughing filter technology is detailed in Chapter 4, including its ability to reduce influent water turbidity and microbial contamination. Chapters 5 and 6 explain the field work conducted on-site and the results of that work Based on this information,
modifications to the existing filter are recommended and the design of new filters is addressed in Chapter 7.
2
THE THAILAND
-
MYANMAR (BURMA) BORDER
Today there are nine UN refugee camps along the Thai-Myanmar (Burma) borderwhere about 140,000 official refugees of the Karen and Karenni ethnic minorities have
sought refuge from political persecution by the leadership of Myanmar (Burma) (CIA World
Factbook, 2008; UNHCR, 2006). People living in the camps have traveled long distances to
escape harm and face further battles adjusting to life in camp and making repatriation
decisions. Understanding the political and economic situation of the people as well as the
climate of the area frames the problem of providing safe drinking water.
2.1
Pohkics
In September 1988, a military junta took control in Myanmar (Burma) (Lanser,
2006). The military regime placed restrictions on work and civil liberties and became
increasingly brutal, especially towards ethnic minorities. As a result, a large number of
citizens fled from Myanmar (Burma) to escape persecution and to seek work. It is estimated
that the largest number migrated into Thailand; although the exact numbers are unknown
(TBBC, 2007). Of these, about 140,000 reside in UN-sanctioned camps and another
500,000 are registered migrant workers. The rest remain unregistered and attempt to live
unnoticed in Thailand in order to avoid deportation (Fogarty, 2007).
Much of the challenge for these migrants stems from the fact that Thailand is not a
signatory of the UN Refugee Convention. As such, the government only grants asylum to
those fleeing combat as opposed to those fleeing human rights violations (Refugees
International, 2007). The UN-sanctioned camps along the border, as a result, are not
recognized by the Thai government as refugee camps. They are instead called temporary
shelters, even though they have existed for more than twenty years. The Thai government
expects on paper that the refugees to promptly return to Myanmar (Burma) or repatriate to
another nation, but fortunately has allowed these camps to exist for decades.
Native hill tribes, which historically lived across an area covering parts of northern
Thailand and Myanmar (Burma), make up a large majority of those seeking asylum. The
Karen, Karenni, and Mon are the main tribes being driven from their homes by the
Myanmar (Burma) military (McGeown, 2007). Within Myanmar (Burma) there is some
resistance from the Karen National Liberation Army (KNLA) which is fighting for an
independent Karen state. There are additional rebel armies, but over the past 20 years most
have agreed to ceasefires with the military junta. Many of the refugees in the camps in
Thailand are sympathetic to the KNLA, and some have even served in it (McGeown, 2007).
2.2
Economy
There is a significant amount of poverty in Myanmar (Burma) as a result of the
military junta's controls and inefficient economic policies. Inconsistent exchange rates and a
large national deficit create an overall unstable financial atmosphere (CBS, 2007). Although
difficult to accurately assess, it is estimated that the black market and border trade could
encompass as much as half of Myanmar's (Burma's) economy. Importing many basic
commodities is banned by the Myanmar (Burma) government and exportation requires time
and money (McGeown, 2007). Timber, drugs, gemstones and rice are major imports into
Thailand, while fuel and basic consumer goods such as textiles and furniture are returned
(CBS, 2007).
By night, the Moei River, which divides the two countries, is bustling with illicit
activity. Through bribing several officials, those who ford the river are able to earn a modest
profit (for example, around two USD for a load of furniture) and provide a service to area
merchants and communities. Thailand benefits from a robust gemstone business that draws
dealers from all over the world. The Myanmar (Burma) mine owners would get a fraction of
the profit by dealing directly with the Myanmar government, so instead choose to sell on the
black market (McGeown, 2007).
The Thai economy along the border also feels the impact of migrant workers. Many
Thai business owners rely on illegal workers for cheap labor. In Mae Sot, the closest city to
the MaeLa camp, it is estimated that only 50% of the 80,000 Myanmar (Burmese) people in
the area have Thai work permits (McGeown, 2007). In addition to illegal business
negotiations there are government bribes. Illegal residents often pay Thai authorities bribes
in order to remain in Thailand. In other cases, migrants are deported only to return the same
day after bribing Myanmar (Burmese) and Thai border officials. If illegal immigrants are
reported to the Myanmar (Burma) government, however, heftier fines must be paid in order
to avoid jail time (McGeown, 2007).
2.3 Ch'mate in Northwestern Thailand
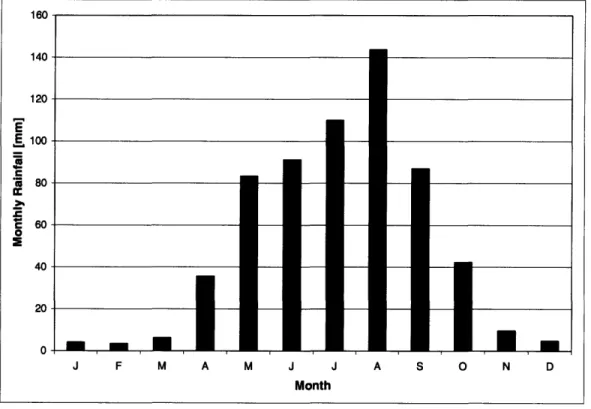
The Tak region of northwestern Thailand is characterized by a tropical climate with wet and dry seasons (UN Thailand, 2006; ESS, 2002). The rainy season lasts from June to October, followed by a cool season until February. The weather turns hot and sunny between March and May (UN Thailand, 2006). This region of Thailand has an average temperature of 26oC although there is significant variation during the year and, due to changes in elevation, over the region. Temperatures can range from 4VC to 420C (Thailand Meteorological Department in ESS, 2002). The average annual rainfall in Mae Sot, Thailand is 2100 mm (GOSIC, 2007). Figure 2-1 shows the monthly rainfall averages over the past 56 years. During the wet season there is a clear increase in precipitation, as more than 8 5% of
the annual rainfall occurs during this period.
120
E
E 100 C o J F M A M J J Month A S O N DFigure 2-1: Average Monthly Rainfall for Mae Sot, Thailand (GOSIC, 2007).
2.4 MaeLa Camp
The MaeLa camp is a refuge for people seeking protection from the Myanmar (Burma) government and from warfare along the Thailand-Myanmar (Burma) border
(McGeown, 2007). The camp is run by the United Nations High Commissioner on Refugees
-ImM
a
,0a
z c
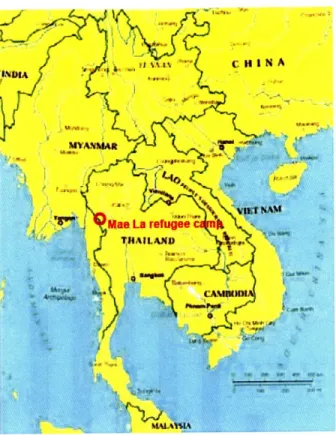
and has existed since 1984 (TBBC, No Date). MaeLa is located near 16'30'N and 98'30'E in the northern region of Thailand about ten kilometers from the border with Myanmar
(Burma) (Lumjuan, 1982; TBBC, No Date). The camp location is shown by the red circle in Figure 2-2. The nearest town, Mae Sot, is about 60 kilometers away from MaeLa. The next nearest large city is Tak and Bangkok is about 500 kilometers south-east of Mae Sot (Google, 2007).
Figure 2-2: Location of the MaeLa Refugee Camp (Map of the Mekong River Subregion, 2006).
2.4.1 Population Demographics
MaeLa is home to about 45,000 refugees, mainly of the Karen ethnic minority (UNHCR, 2007; TBBC, No Date). There are reportedly more than six million Karen people living in Myanmar (Burma) and about 400,000 living in Thailand (KarenPeople, 2004). These numbers may not account for the approximately 150,000 Karen refugees living in refugee camps in Thailand (UNHCR, 2007).
Figure 2-3 shows the relative populations, ethnicities, and age demographics of the UN refugee camps in Thailand. MaeLa is by far the largest camp, with a population of more
than double the next largest. Interestingly all the camps have a similar age distribution of refugees, with about half the population between 18 and 59 years old and one-third between 5 and 17 years old.
The Karen believe strongly in the value of family. As a result, repatriation decisions are difficult and must be made as a family. Generally, the teenagers and young adults who have lived most or all of their lives inside the camp want to repatriate elsewhere while older generations hope to return to Burma if it is restored (D. Lantagne, personal communication, October 19, 2007).
The Karen are friendly, caring, and accepting. Children throughout the camp often receive a pat on the head from passers by and market areas within the camp are a bustle with conversations and negotiations. Within the bounds of the camp are a Muslim mosque, Buddhist monastery, and Christian churches, which refugees attend without fear of persecution.
While people within the camp are protected and provided with many provisions, they are still a transient population with disturbing pasts and uncertain futures. One refugee fled Myanmar (Burma) on foot with only the clothes on his back and some food for the journey in a shoulder bag. It took him over a month to reach the camp, traveling only at night and sometimes waiting days to be sure Myanmar (Burmese) authorities were not in the area. Once people arrive in the camp and decide to apply for repatriation, they can wait months to years to receive a decision.
2.4.2 Environment
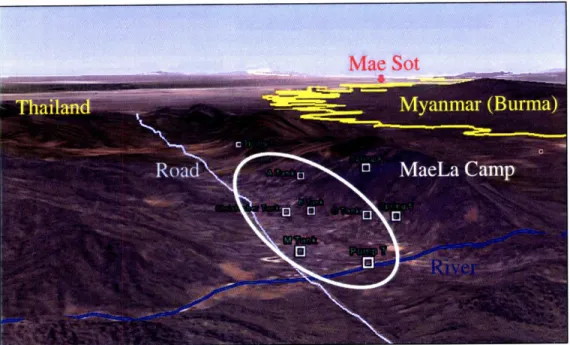
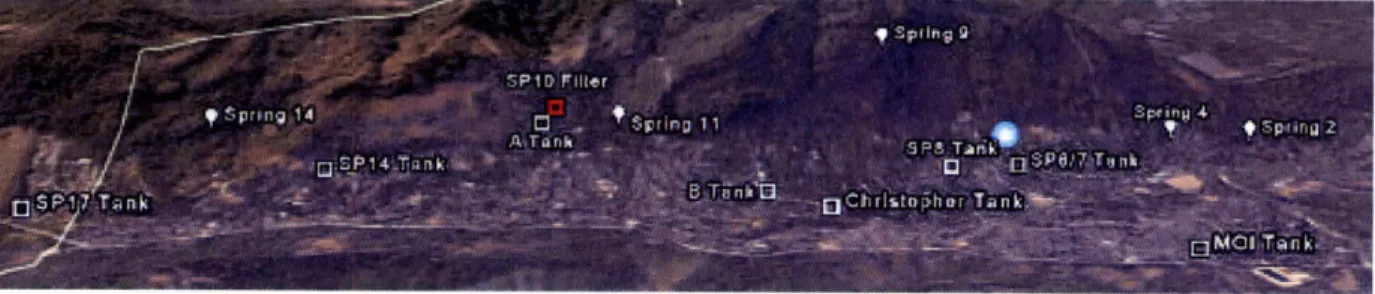
The MaeLa camp is located in a valley surrounded by two ridges rising about 300 meters above the camp. These hills are distant extremities of the Himalayan mountain range which is mainly located northwest of Thailand. A river runs through the end of the two ridges and bounds the camp on the north. The Thai military protects the road that borders the camp and links it with the nearest Thai city of Mae Sot. These key boundaries are shown in Figure 2-4, where the camp is roughly circled in white. Figure 2-4 also shows some water infrastructure including several storage tanks and some spring locations.
Figure 2-4: MaeLa Location, looking southwest (Google Earth, 2007; Lantagne, 2007).
As a result of the Thai classification of the camp as a temporary shelter, the camp residents cannot cut down trees within the camp and must construct their buildings of non-permanent materials. The UN and other NGOs provide materials such as bamboo for building construction.
2.4.3 Public Health and Water Supply
There are about eleven NGOs that provide services within the camp ranging from food and shelter provisions, health care, protection, and water supply. Aide Medicale Internacionale (AMI) is currently charged with providing health care and water supply. In the fall of 2008, Solidarities, which already provides sanitation in the camp, will take over the water supply services. AMI has an international staff based in Mae Sot and provides services at MaeLa as well as at several other UN refugee camps.
The AMI MaeLa Water and Logistics Coordinator oversees a staff of about 30 refugees who operate the water system on a daily basis. The water system consists of
drinking water supplied to public tap stands from surface and groundwater sources. In addition, non-potable water is provided throughout the camp by rope-pump and bore-hole groundwater supplies. The drinking water system is discussed in detail in Chapter 3.
3 DRINKING WATER IN MAE LA
AMI maintains potable and non-potable public water supplies within MaeLa. This chapter outlines the sources of drinking water for the camp, the water system components, and existing treatment processes.
31
Dnmin&;zg
JJaterSources
The drinking water sources in MaeLa are surface water from the river and naturally flowing springs. The river runs east-west, cross-cutting through the north end of the southwest facing ridge that borders the camp. While the river is an important water supply for the camp, its existing quality and potential means of treatment are not the focus of this work The thirteen springs that are used for public drinking water supply flow from the ridge that borders the camp to the southwest and their quality is the focus of this thesis.
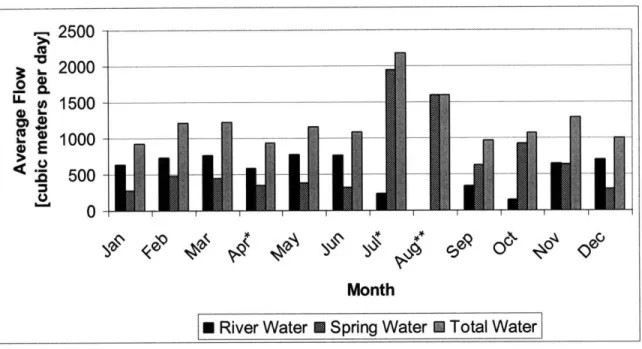
There is annual variability in the volume of drinking water available in total and from each source. Figure 3-1 shows the available water volume for 2007 by month for river water, spring water, and total water. Flow volumes for April and July 2007 were not
available and the values from 2006 are shown. Only the spring water volume was available for August 2007. The spring water sources become notably more important during and after the rainy season because their volume increases significantly. Relying on gravity-fed spring water during as many months as possible allows AMI to save on the cost of pump operation.
The dependence of available spring flow on rainfall is shown in Figure 3-2. Monthly spring flow in 2007 is shown as bars, while average rainfall in millimeters per month is shown by the black line. Rainfall increases during the wet season which runs from May to September. The spring flow increase has a lag of one to two months, as shown by volume increases in July through October. In particular Spring 10 is an important spring,
2500 , 2000 ,1 4rnAA Q# E U U IJvJ'J - -I --s 1000 500 -0-
,I i
I I
MonthI River Water I Spring Water U Total Water
Figure 3-1: Division of 2007 Flow Volume from Storage Tanks by Source *Data from 2006, ** River Water Flow Rate Unavailable
Figure 3-2: Annual Rainfall and Spring Flow Averages (AMI, 2007; GOSIC, 2007).
LL 04 oI
d*
t t ~,a90tt~p~8 v3.2 Water System Layout
Drinking water in MaeLa reaches over three-fourths of the population through public tap stands after passing through collection systems, pump stations, storage tanks, and distribution networks (Lantagne, 2007). The majority of the remaining fourth of the
population gets their water from private sources. The water system was developed over time as the camp grew. This helps account for the many apparently separate systems, some of which were connected after their initial construction. The system is also complicated by the number of sources entering at various points. Some portions of the distribution system are supplied by one source while others are supplied by multiple sources, with annual variability in source ratio based on available water volume.
Water is pumped from the river or is gravity-fed from springs into storage tanks. There are five main tanks which supply the five largest distribution systems in the camp. The tanks are: A Tank, B Tank, C Tank, Christopher Tank, and MOI Tank. Several of the springs, including Springs 6 and 7, 10, 14, and 17, have their own storage tanks as well. The locations of some of these tanks, five of the springs, and the Spring 10 filter are shown in Figure 3-3. The orientation of the image is facing southwest toward the ridge, with the road running along the bottom edge of the image.
Figure 3-3: Major Water System Components.
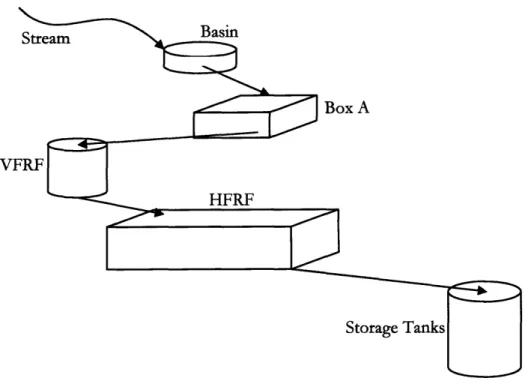
Spring 10 flows from its source over land into a collection basin and then into a collection structure called Box A. This concrete box contained large (10-25 cm) rocks which were replaced with 2-4 cm gravel in January 2008. From the collection structure the water is piped down a steep slope and passes through a vertical-flow rock filter (VFRF) that has rounded gravel media. After passing through this filter the water is again piped downhill to the HFRF. From the HFRF the water is piped to the SP-10 storage tanks and then enters the SP-10 distribution system and is connected to A Tank. Figure 3-4 is a schematic of the SP-10 collection infrastructure.
Basin Stream
Box A
Storage T:
Figure 3-4: Schematic of SP-10 collection infrastructure.
3.3 Water Quality
AMI determines water quality in MaeLa by turbidity measurement, microbial sampling, and chlorine residual testing. Information on turbidity is available for the past several years on a weekly basis at several locations throughout the distribution system. Data on microbial sampling is not available. A surrogate for bacterial contamination is residual chlorine testing which is discussed in Section 3.4.1.
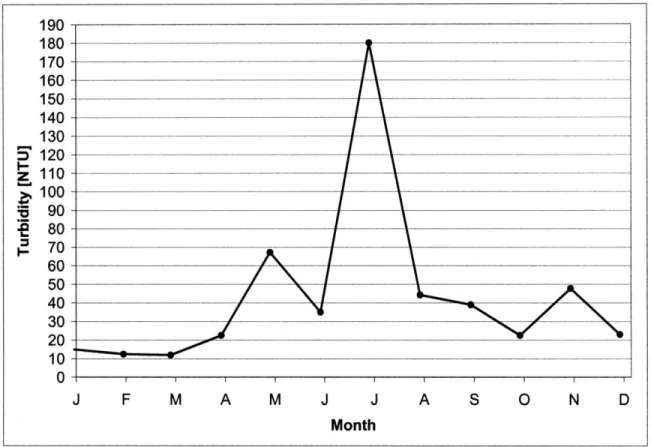
Turbidity of the water supply is measured at a variety of locations throughout the distribution system-including spring collection boxes, storage tanks, and pump stations-normally on a weekly basis. Table 3-1 gives the monthly turbidity average at each of the springs. Values greater than ten NTU are highlighted. Spring 10 is the only spring to have turbidity consistently greater than 10 NTU. In particular, at Spring 10 the highest turbidity can be correlated with the rainy season. Figure 3-5 shows that the turbidity increases over the months of May to September.
Table 3-1: 2007 Monthly Average Turbidity at Springs in NTU. Highlighted values exceed 10 NTU.
Spring Jan Feb Mar Apr May Jun Jul Aug Sep Oct Nov Dec
SP-2 5 5 5 12 5 5 5 5 5 5 5 5 SP-4 5 5 5 5 5 5 5 5 5 5 5 5 SP-5 5 5 5 5 5 5 5 5 5 5 5 5 SP-6 5 5 5 5 5 5 5 5 5 5 5 5 SP-7 5 5 5 5 7 10 5 5 5 5 5 5 SP-8 5 5 5 5 13 5 5 5 5 5 5 5 SP-9 5 5 5 5 5 5 5 5 5 5 5 5 SP-10 15 13 12 23 67 35 180 44 39 23 48 23 SP-11 5 5 5 5 5 5 5 5 5 5 5 5 SP-12 8 5 5 5 5 5 5 5 5 5 5 5 SP-14 5 5 5 5 5 5 5 5 5 5 5 5 SP-15 5 5 5 5 5 5 5 5 5 5 5 5 SP-17 5 5 5 5 5 5 5 5 5 5 5 5 190 180 170 160 150 140 130 120 110 100 90 80 70 60 50 40 30 20 10 0 J F M A M J J A S O N D Month
Figure 3-5: 2007 Turbidity at Spring 10.
-3.
Ex£zis tnvg Water 7eatment
Disinfection is the main form of water treatment to the river and spring water in
MaeLa. There is one filter in the system at Spring 10, the location of which is shown in
Figure 3-2. As previously noted the main focus of this work is on the water from the
springs, of which Spring 10 has been shown to have particularly high turbidity.
3.4.1 Disinfection
Currently, the only treatment for the river and spring water is disinfection by
chlorination. Chlorine is a common disinfectant for treatment of water against
disease-causing bacteria. According to Lantagne (2007), the distribution system had sufficient
disinfection at the tap stands in August 2007.
The maximum disinfection level for chlorine residual (as Cl) recommended by the
World Health Organization (WHO) is 5 milligrams per liter (mg L) and by the US EPA is 4
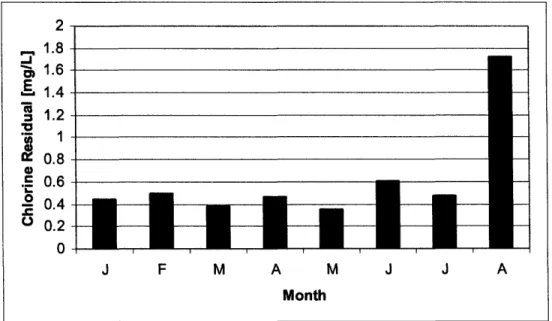
mg L' (WHO, 1993; US EPA, 2007). Data for chlorine residual for the first eight months of
2007 are available from AMI. Available chlorine residual measurements have been averaged
and are summarized in Figure 3-6. All the values are well below the WHO and US EPA
maximum disinfectant levels.
Figure 3-6: Residual Chlorine Levels forJanuary- August 2007 (AMI, 2007). 2 1.8 3 1.6
1 1.4
1 1.2 S0.8 .E 0.6-•.--2
0.4
-o 0.2 --0 t-J F M A M J J A Month~tl~tti
Chlorination is more effective and lower dosages can be used in low turbidity waters (Sawyer et al., 2003). Since twelve of the thirteen springs maintain low turbidities
throughout the year, chlorination of these sources should be effective throughout the year. The variation in the turbidity at Spring 10 requires that the water be treated before it is chlorinated in order to assure the effectiveness of the disinfectant.
3.4.2 Filtration
The only treatment other than disinfection as of January 2008 is a horizontal-flow roughing filter located between the collection and storage of Spring 10 water. The roughing filter has three compartments separated by internal walls constructed with off-set concrete blocks. Figure 3-7 shows one of the internal walls. Each compartment is 4 meters long,
1.5 meters wide, and filled with 0.8 m of filtration media. The media consists of loose gravel
with a size range of two to four centimeters.
Figure 3-7: Internal wall of SP-10 HFRF.
A pipe of three-inch diameter conveys water from the SP-10 collection box into the
filter as shown in Figure 3-8. This inflow pipe does not distribute the water over the operating width of the filter. The outflow pipe is a vertical perforated pipe that collects water over the depth of the filter and sends it to the SP-10 storage tank through an outlet
located at the bottom of the HFRF. Chapters 5 and 6 contain further information on the operation and maintenance of the filter.
Figure 3-8: Inflow pipe to SP-10 HFRF.
The purpose of the filter is to maintain a consistent turbidity at SP-10, since there is an annual increase in turbidity during the rainy season. Figure 3-9 shows the turbidity increase at SP-10 collection Box A and the turbidity of the water at the SP-10 storage tank after passing through the HFRF. The filter achieved the treatment goal of less than 10 NTU on average for seven of the twelve months in 2007.
190 180 170 160 150 140 ,
130
120 2 110 E 100 S 90 S8070
60 50 40 30 20 10 U-, --0 J F M A M J J A S O N D Month -c-S-10 Box A - S- S-10 TankFigure 3-9: 2007 SP-10 Turbidity at collection Box A and at storage tank. The HFRF operates between these two sampling points.
4 SPRING WATER QUALITY IMPROVEMENT
Spring water is an important water source for MaeLa. It accounted for an average of
50% of the water supply in 2007 and climbed to 80% of the water supply during the rainy
season. Monthly flow volumes are shown in Figure 3-1. The spring water in MaeLa presents several water quality issues because of the number of springs and the annual water quality cycle. This chapter first describes the water treatment design parameters and treatment objectives specific to MaeLa. Then potential water quality improvement
technologies are discussed. Data from previous studies and recommended values of design variables are included.
4.1 ges
1gnParametelz
Water treatment design is based on influent water quality and treatment objectives. Based on the existing information about spring water quality in MaeLa, four main design parameters have been identified. Turbidity is the parameter of most interest because the effectiveness of disinfection by chlorination is lowered at higher turbidity (AWWA, 2003; Wegelin et al., 1991). The water from the largest volume springs is chlorinated before release into the distribution system. The bacterial load of the water is the second important parameter because of the potential for disease-causing organisms in the water supply, particularly in the sources that are not chlorinated. The last two design parameters have to do with the size and location of the spring, both of which are unique to MaeLa due to seasonal flow variation and steep land slopes.
4.1.1 Turbidity
Turbidity is mineral and organic particulate matter in water that causes light
absorption and scattering (Eaton et al., 2005). The type of particulate matter varies for each different water (LeChevallier et al., 1981). Turbidity reduces aesthetic acceptability,
filterability, and disinfection potential of drinking water (Sawyer et al., 2003). Nephelometric turbidity units (NTU) are the standard unit for turbidity measurement. As demonstrated in Chapter 3, the turbidities at the springs are less than ten NTU except at SP-10 where turbidities have an annual variation.
The types of pre-treatment and treatment units are determined by the turbidity of
influent water. Okun and Schulz (1984) write that water greater than 50 NTU requires treatment. This indicates that the technologies discussed below under the heading of pre-treatment are applicable to MaeLa, because turbidities spike above 50 NTU during the rainy season and can also reach 50 NTU in the dry season.
The impact of turbidity on chlorination is the main reason to achieve consistent, low turbidity. LeChevallier et al. (1981) found that the threshold of effectiveness of chlorination was exceeded in surface waters with turbidity between six and eight NTU. The results of the
study, which was conducted in four different watersheds, are shown in Figure 4-1. The
water samples depicted in Figure 4-1 were from Oregon, USA. Wegelin et al. (1991)
recommend low turbidity water for efficient disinfection via chlorination, but do not specify
a value of turbidity. Based on the accuracy of turbidity measurement in MaeLa, as detailed
in Chapter 6, I determined a treatment goal of less than ten NTU for the spring water
sources. This agrees with the current treatment goal of AMI.
The field work results discussed in Chapter 5 demonstrate that chlorination is
effectively used as a disinfectant in MaeLa. In order to reduce chemical requirements and
simplify chlorine application, producing a consistently low-turbidity water source through
pre-treatment is desired.
4.1.2
Bacterial Loads
Water-borne bacteria transmit a range of diseases, which treatment aims to reduce or
eliminate by removing bacteria from the water. Total coliform and Esherihia ali (E. a•t) are
used as indicators of the presence of water contamination from bacterial load (Alekal et al.,
2005). The goal of the treatment units in combination with disinfection is elimination of
bacteria from the MaeLa water supply.
The water quality standards for Thailand are 2.2 total coliform per 100 mL and zero
E. cli per 100 mL (Okun and Schulz, 1984). These are less stringent than the US standards,
which are 0 per 100 mL for both total coliform and E. coi (US EPA, 2007). Although
chlorination produces a water low in bacterial contamination, filtration in combination with
disinfection will produce an even higher quality effluent as demonstrated by chlorine
effectiveness at lower turbidities (LeChevallier et al., 1981; Lantagne, 2007).
100 50
10
5,o
t: 0.1nni
0 05 10 1.5 20 2.5 30 CHLORINE DOSE (mg/I)Figure 4-1: Surviving coliforms as a function of influent
turbidity and chlorine dose (LeChevallier et al., 1981).
4.1.3 Site Specific Parameters
Some of the design parameters for water treatment processes are specific to the
location of the treatment system. For MaeLa the annual water volume variation and
available land area are the two main site-specific parameters. First, the available water has
annual volume variation. The flow from each source for the past three years is available
from AMI (2007). The volume of water is correlated to the annual rainfall, with an increase in available water volume beginning in July and continuing through October. This is shown in Figure 3-2. During the July-October wet season the flow volume more than doubles. Any treatment process will need to be able to handle this seasonal variation.
Second, the locations of the springs present a design restriction. The springs are at elevation above the camp where there is little flat land on which to construct treatment units. The elevation change across the camp limits the land available to build water treatment units.
The system is gravity-fed, which if at all possible should be maintained to minimize fuel costs associated with pumping. This means the treatment units will need to be located at a high elevation. The springs flow near the top of the ridge and the storage tanks are also located at this elevation. AMI has records of the land area available at each of the springs. The area needed for the treatment units is dependent on the processes selected and the volume of water to be treated.
,x2 Pm- treatmenw
Design of treatment facilities is dependent on several variables including treatment objectives, influent water quality and flow volume, availability of materials and land, and ability to perform technical maintenance (Okun and Schulz, 1984). As described above, the
main goals of treatment are to remove turbidity and bacteriological contamination and to normalize the quality throughout the year. Due to the range of turbidity seen in Table 3-1
and Figure 3-4, some sort of pre-treatment is recommended (Okun and Schulz, 1984). Wagner and Lanoix (1959) write that the simplest technologies are the best because of low
maintenance requirements. This is particularly important in MaeLa, where the availability and turnover in maintenance staff predicates low maintenance.
Pre-treatment describes several low-technology processes that improve water quality without significant labor or mechanical investment (Wagner and Lanoix, 1959). The influent water quality and quantity dictate the type of pretreatment. Okun and Schulz (1984), Wegelin (1996), and Wegelin et al. (1991) describe the pre-treatment selection based on influent turbidity. This is summarized in Table 4-1.
4.2.1 Plain Sedimentation
Plain sedimentation uses gravity settling at moderate flow rates to remove particulate matter, producing an effluent with lower suspended solids content than the influent (Okun and Schulz, 1984). Compared to full-scale sedimentation, the surface loading rate is increased in plain sedimentation. The result is a lower residence time for water in this process
compared to treatment sedimentation. Plain sedimentation is effective at removing mineral particles of greater than ten-micrometer diameter (Okun and Schulz, 1984). This means that
Table 4-1: Pre-treatment based on Influent Turbidity (Okun and Schulz, 1984; Wegelin, 1996; Wegelin et al., 1991).
Pre-treatment Type Influent Turbidity Plain Sedimentation 20- 100 NTU
Storage >1000 NTU
Vertical-Flow Roughing Filter 20-150 NTU
Horizontal-Flow Roughing Filter 20-1000 NTU
4.2.2 Storage Tanks
Storage tanks, often uncovered, function similarly to plain sedimentation units. The main difference is that the residence time of water in storage units is longer. Storage lowers turbidity and bacterial loads (Okun and Schulz, 1984; Hofkes, 1983). Additionally, storage tanks at the beginning of the treatment train can be used to time-release influent spikes in the water supply that occur during the rainy season.
4.2.3 Roughing Filtration
Roughing filtration uses the principles of sedimentation and sorption that drive filtration, but with larger filtration media. This is the most effective pre-treatment unit when pre-treatment is combined with slow-sand filtration (Okun and Schulz, 1984). The two types of roughing filtration are vertical-flow and horizontal-flow. Vertical-flow allows for higher filter rates, but the water depth in the unit is limited. Vertical filters are also classified by their flow direction into up-flow and down-flow filters. Horizontal-flow units have long lengths which allow for low filter flow rates. Both types can be manually regenerated, reducing the mechanical demands that maybe required if backwashing is used (Okun and Schulz, 1984). Figure 4-2 shows a basic schematic of each of the three types of roughing filters.
Both flow orientations have successful implementations in Thailand. One horizontal roughing filter removed 60-70% of turbidity in influent water with 30-100 NTU (Okun and Schulz, 1984). Okun and Schulz (1984) also refer to a vertical roughing filter that proved to be even more effective, reducing influent turbidity of up to 150 NTU to less than 5 NTU, while also removing 60-90% of bacteria. This filter used shredded coconut husks as the
filtration medium. HFRF have been shown by various studies to remove turbidity, iron, algae, and total coliforms and other bacteria.
Figure 4-2: Roughing Filter Schematics (Wegelin et al., 1991).
Based on the flow volume, influent water quality, and land restrictions, roughing filtration is the most applicable pre-treatment process at MaeLa. In addition, a HFRF is already in operation at SP-10, providing invaluable existing knowledge in the camp of the operation and maintenance of this type of pre-treatment technology.
4.2.3.1 General HFRF Design
HFRF consists of an inflow control, an inflow distribution device, the filter, an effluent collection device, an outlet control, and a drainage system (Wegelin, 1996). A general HFRF layout is shown in Figure 4-3. The filter itself can be divided into three or four compartments with graded gravel filter media (Wegelin et al., 1987). The outlet control should be placed at the top of the filter in order to maintain a constant volume of water in the filter (Wegelin et al., 1987; Sittivate, 2001). Table 4-2 shows general filter dimensions from Wegelin et al. (1987) and Collins et al. (1994).
SF
Figure 4-3: General Layout of a Horizontal-Flow Roughing Filter
(Wegelin et al., 1987).
Table 4-2: General HFRF Dimensions
(Wegelin et al., 1987; Collins et al., 1994).
Dimension General Value [m]
Length
6-12
Width 2-4
Height 1-2
4.2.3.2 HFRF Media Size
A variety of media have been tested for effectiveness in HFRFs. Locally available
materials such as coconut husks and burnt bricks have been studied in the past. The existing HFRF in MaeLa uses coarse gravel. This section only discusses gravel, because it is the most
commonly used medium and is currently used in MaeLa. In addition, El-Taweel and Ali (1999) found gravel to be the most effective medium while comparing six different media combinations.
The most common media size range is from 0.3 cm to 5 cm. Often three differently sized media are used in combination to achieve even better results. Table 4-3 summarizes the effective gravel medium sizes found by different research.
Table 4-3: HFRF Medium Size Ranges Range of Gravel Size [cm] Source
0.3 - 4 Logsdon et al., 2002 0.3 - 3.5 Jayalath et al., 1995 0.4 - 2 Wegelin et al., 1987 0.5 - 5 Boiler, 1993 1-2 Sittivate, 2001
4.2.3.3 HFRF Filtration Rate
A range of filtration rates is discussed in the literature and their variability is based on
desired treatment rate and filter performance. Lower filtration rates are directly related to
higher particle removal. Often, though, the demand for water does not allow filters to be
operated at the lower bound of designed flow rates. Table 4-4 summarizes a range of
filtration rates and, if available, their performance.
Table 4-4: HFRF Filtration Rate Ranges and Associated Performances.
Filtration Rate
Performance
[m he
1]
[% Reduction] Parameter
Source
0.3
90%
Turbidity
Sittivate, 2001
0.3 - 1.5
50 - 70%
Solids content Wegelin, 1996
0.3
-
1.5
>90%
Turbidity
Wegelin, 1996
0.3
-
1.5
--
--
Collins et al., 1994
0.3
-
1.5
--
--
Logsdon et al., 2002 from Hendricks, 1991
0.5 - 2
--
--
Boler, 1993
0.5 - 4
--
--
Wegelin et al., 1987
1 - 2.5
50 - 60%
Turbidity
Jayalath
et al., 1995
1-5
----
Wegelin, 1996 for "Rock filter"
1.5
40 - 100%
Turbidity
Lin et al., 2006
4.5
40%
Turbidity
Jayalath et al., 1995
4.2.3.4 HFRF Maintenance
Maintenance of any treatment unit is important to ensure continuous effective
treatment. The frequency of cleaning the filter media is dependent on the influent water
quality, but is generally every two to three months for HFRF (Hofkes, 1983; Wegelin et al.,
volume of water over a short time or manually by removing the filter media, cleaning it, and replacing it.
Wegelin (1996) found that hydraulic cleaning is more effective than manual cleaning if the necessary flow rate can be achieved. A flushing flow rate of at least 30 m hr' is needed
and ideally it would be 60-90 m hr1 (Wegelin, 1996). In order to achieve media regeneration with mechanical washing, the flush flow rate must be achievable. This is dependent on several factors, including: available flow to achieve the flushing flow rate, outlet area for drainage, and wash water volume. The outlet area for drainage should be made as large as possible, as it is often the limiting parameter in reaching the desired flow rate (Wegelin,
1996).
It is recommended to have two HFRF so that maintenance can be completed while the other filter is in use (Wegelin and Mbwatte, 1989 and Wolters et al., 1989 in Logsdon et al., 2002).
4. Ada/ltobnaltreanment.processes
Previous study shows that roughing filtration (RF) can achieve the treatment goals of spring-water quality without the need for additional treatment processes. Further processes, such as slow sand filtration, require exact technical design and regular maintenance. Since roughing filtration will meet the needs of the spring water and is compatible with current staff availability, it is recommended to focus on RF as the applicable technology for MaeLa.
Another benefit of the implementation of RF within the camp is the capacity to add additional treatment processes as necessary. As Okun and Schulz (1984) note, roughing filtration is the most effective pre-treatment process to be used in series with slow-sand filtration. If AMI chooses to expand treatment of the spring water, the effective implementation of roughing filters in the camp will mean that the influent water quality necessary for slow-sand filtration is already being achieved.
5 FIELD WORK
Information on the condition of the existing spring collection and treatment infrastructure was gathered on a site visit to MaeLa Temporary Shelter in January 2008. Water turbidity at Spring 10 (SP- 10) was measured several times at various locations. Flow rate tests were conducted at the SP- 10 filter. Microbial sampling took place at ten places throughout the system.
As discussed in Chapter 3, SP-10 is a significant source of water for the camp,
particularly in the rainy season. In addition, its water quality is among the most variable,
with rainy season turbidities that are 5 to 10 times higher than those during the dry season.
Measuring turbidity at SP- 10 served three purposes. First, it determined some dry season
turbidity levels. Second, it helped understand which existing treatment processes are
removing turbidity under dry and simulated-rainy season turbidity. Third, it compared
turbidity measurement techniques used by AMI.
5.1.1 Measurement Methods
Turbidity was measured using a Hach 2100 turbidimeter. The Hach turbidimeter is an electronic nephelometer that measures the scattering of incident light (Eaton et al., 2005). This is the standard method of measuring turbidity.
The turbidimeter was calibrated on arrival and once weekly for the remainder of the visit. Measurements were taken immediately after collection so that the temperature and pH did not change significantly before the measurement was recorded. Sample vials were cleaned with silicone oil before each measurement in order to reduce measurement interference from the glassware (Eaton et al., 2005).
AMI measures turbidity with two different methods. The first is using a LaMotte 2020 series electronic nephelometer. The second, and more commonly used in practice, is with a turbidity tube. This device is a plastic tube of one-inch diameter, into the bottom of which a ring or other pattern is etched. The user pours water into the tube until the etching is no longer visible. The water level in the tube gives the turbidity as read from gradations
on the outside of the tube. Figure 5-1 shows both measuring devices.
(a)
(b)
Figure 5-1: Turbidity measuring devices. (a) electronic nephelometer and (b) turbidity tube.
The same sampling and cleaning procedure was used for both the electronic nephelometers. The LaMotte turbidimeter was calibrated prior to use. The turbidity tube was used with standard procedures.
Turbidity was measured at eight locations along SP- 10 from its origin surface flow to the filter outflow. Measurements were made a second time at five of these locations.
During the simulated rainy season flow test, the turbidity was recorded at four locations along SP- 10.
5.1.2 Observations
SP- 10, including collection Boxes A and B and the filter, is in a wooded area where there is little direct light penetration at the ground level. This is of direct concern when using the turbidity tube, as it is necessary to have strong sunlight to use the instrument correctly.
.U2 Fzite r /o w Tests
The SP-10 roughing filter consists of three compartments each with the same filter material. Upon first inspection, the free surface of the water was above the filter media in the first and third compartments. The filter media in the second compartment had a layer of sediment on top of it. The construction of the filter, without inlet or outlet weirs, suggested that short circuiting could be occurring. Figure 5-2 shows the plan layout of the filter, including the walls separating the three compartments. These walls are made of offset cement blocks. The theoretical flow path is shown with dashed arrows. Potential short circuits are shown by the arrows. The inflow is a pipe through which water free-falls onto the filter media and the outflow is a vertical pipe which is perforated over depth. To determine the residence time of the filter under different conditions, three tracer flow tests were conducted under varying filter and influent water conditions.
5.2.1 Measurement Methods
The tracer tests were conducted by adding a spike input of saline solution to the inflow and recording the conductivity of the filter effluent. The saline solution was 500 mg of salt dissolved in five liters of water. Before adding the saline solution, a background conductivity reading was taken at the filter outflow. The salt water was added and conductivity was measured at the outflow until the conductivity spike passed and
background conductivity was re-established. The conductivity was measured with a Hanna Instruments 9812 pH/EC/TDS meter. The device was calibrated for conductivity prior to every test.
OUTFLOW
Figure 5-2: Spring-10 Roughing Filter Flow Paths. Theoretical paths are shown with dotted-line arrows and potential short-circuiting paths are shown with solid-line arrows.
5.2.2 Observations
The inflow of the filter is a point source instead of a more traditional weir that would distribute flow over the width of the filter. The saline solution was dumped into the
inflowing water stream, so it too was not distributed over the width of the filter. This mode of tracer solution input is consistent with the normal inflow and thus a better representation of the filter flow path than an attempt to distribute the solution over the width of the filter would have been.
The conductivity was measured near the top of the free surface of the water. The data do not represent the vertical distribution of saline solution found at the outflow.
5U3
IAfcrohz"/Sampl/ng
Various references note the potential for bacterial load reduction by roughing filters. In order to get an idea of the background quality of the influent and effluent water quality at SP-10 filter, microbial testing was conducted. Samples were also taken at several taps and
storage tanks to assess the effectiveness of disinfection and the quality of water being provided to the consumers.
5.3.1 Measurement Methods
The microbial testing selected Esderidia coi (E. colt) and total coliforms. E. co/i is a disease-causing organism and total coliform are used to indicate the possible presence of disease-causing strains. Samples were taken at the inflow and outflow of SP- 10 filter, MOI Tank, Christopher Tank, SP-14 Tank, C Tank, SP-10 Tap 5, SP-17 Tap 13, B Tank Tap 4, and A Tank Tap 7.
Samples were collected and de-chlorinated in 100 mL sample bags using sodium thiosulfate (US EPA, 2003). Total coliform and E. cci were tested for using the standard plate count method. The medium was Violet Red Bile, pre-measured on 3M1 Petrifilm® Coliform/E. clii plates (3M, 2001). Dilution and incubation occurred within eight hours of sample collection. Each sample had three dilutions: 1:1, 1:10, and 1:100. These dilutions provided internal quality control as well as additional data (Eaton et al., 2005). Incubation took place at 35 degrees Celsius for 24 + 2 hours. The plates were counted with a lighted hand lens.
5.3.2 Observations
A total of 16 samples were plated at the three specified dilutions with duplicates of each dilution. These 16 samples included six duplicate samples, which were from each of the taps and the SP- 10 filter collection points. Only one sample was taken at each of the tanks.
6 RESULTS
Flow tests, turbidity measurements, and microbial sampling at the SP-10 filter provide information about the effectiveness of the existing treatment and the potential for performance improvement. Modifications made to the roughing filter during the field visit improved the filter performance and confirmed that the water was short circuiting through the media. Microbial samples taken across the camps showed broadly that chlorination is an effective disinfection technique for the camp.
6.1 SP-10 Cleaning and Baffle Addition
Upon arrival in MaeLa, the SP-10 horizontal flow roughing filter (HFRF) needed to be cleaned and the volume of filter media needed to be restored. The free surface of the water was visible in two of the three compartments of the filter. The other compartment
had a visible layer of sediment on top of the filter media. The filter was cleaned during the second week of field work. In addition, gravel was added to the first and third
compartments so all the water now flows below the surface of the medium.
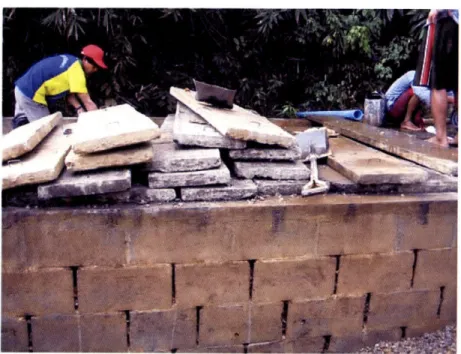
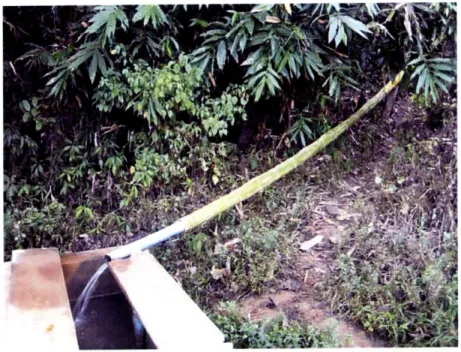
Day laborers hired by AMI clean the filter by h6nd. The gravel is removed from each compartment and the influent water is diverted over the dirty gravel. Gravel is cleaned
by the basketful and returned to the filter. The process is shown in Figure 6-1.
While the gravel was removed from the filter, two baffles were added in order to direct flow through the entire filter volume. Each baffle consisted of a plastic sheet placed over a portion of the cinder-block interior wall. The layout of these baffles is shown in Figure 6-2. The results of this modification are discussed in the following sections on turbidity and flow testing.
6.2 Turbidity
Turbidity was used to demonstrate the effectiveness of various roughing filters along the pipe that runs from SP-10 Box A to SP-10 storage tanks. As described in Chapter 3, there are two rock VFRFs which precede the main SP-10 HFRF. Both of these small filters have larger-diameter filter material than the HFRF. The materials are described in Table 6-1.
(L) Shows the gravel
Figure 6-1: Cleaning the HFRF media.
removed from the filter, (R) show the workers cleaning a basketful of gravel with the diverted water supply.
INFLOW
OUTFLOW
Figure 6-2: Plan View of Spring-10 Roughing Filter Flow Path with Baffles. Baffles are shown in bold and coincide with the compartment walls.
L
·
IF
Table 6-1: SP-10 Treatment Processes.
Filter Media Material Media Diameter [cm] Filter Length [m]
Box A Large stones 10 - 30 1
VFRF Rounded stones 4 - 8 1
HFRF Coarse gravel 1 - 4 12
6.2.1 Results
The short length and large media in Box A and the VFRF predict that neither is effective at removing turbidity from the water. Turbidity was sampled twice at multiple points along the collection pipe. The results are shown in Figure 6-3. The first set of data was taken before the HFRF was cleaned, while the second set was collected after cleaning. Both sets are under natural environmental conditions for January, which falls in the dry season. Stream 1 and Stream 2 are two sample points in the SP- 10. The relative locations of
all these sample points are described in Chapter 3 and shown in Figure 3-4.
5'
I-z
CI-69080
-70
-60
50
40
30
-20
10
0
stream 1 strham 2 BasinBox A VRF HFF In HRF Out Figure 6-3: Turbidity along SP-10 collection infrastructure.
Diamonds show turbidity prior to HFRF cleaning, squares show turbidity after HFRF cleaning.