HAL Id: hal-02326454
https://hal.archives-ouvertes.fr/hal-02326454
Submitted on 25 Oct 2019HAL is a multi-disciplinary open access
archive for the deposit and dissemination of sci-entific research documents, whether they are pub-lished or not. The documents may come from teaching and research institutions in France or abroad, or from public or private research centers.
L’archive ouverte pluridisciplinaire HAL, est destinée au dépôt et à la diffusion de documents scientifiques de niveau recherche, publiés ou non, émanant des établissements d’enseignement et de recherche français ou étrangers, des laboratoires publics ou privés.
Boron carbonitride coatings synthesized by LPCVD,
structure and properties
Géraldine Puyoo, Francis Teyssandier, René Pailler, Christine Labrugère,
Georges Chollon
To cite this version:
Géraldine Puyoo, Francis Teyssandier, René Pailler, Christine Labrugère, Georges Chollon. Boron carbonitride coatings synthesized by LPCVD, structure and properties. Carbon, Elsevier, 2017, 122, pp.19-46. �10.1016/j.carbon.2017.06.024�. �hal-02326454�
Available at: https://doi.org/10.1016/j.carbon.2017.06.024
BORON CARBONITRIDE COATINGS SYNTHESIZED BY LPCVD, STRUCTURE AND PROPERTIES
G. Puyoo1, F. Teyssandier1†, R. Pailler1, C. Labrugère2, G. Chollon1‡
1 Laboratoire des Composites Thermostructuraux (UMR 5801 ),
CNRS - SAFRAN Ceramics - CEA - University Bordeaux 3, allée de La Boétie, 33600 PESSAC, FRANCE
2 PLACAMAT (UMS5326), CNRS - University Bordeaux
87, avenue Albert Schweitzer, 33600 PESSAC, FRANCE
ABSTRACT
Thin films of carbon-rich boron carbonitride (h-B-C-N) were prepared by low pressure chemical vapor
deposition from C2H2, BCl3, NH3 and H2 mixtures. After an overall investigation of the deposition kinetics
and the composition of the solid, four deposition conditions were selected to study in details the structure, the oxidation behavior and the mechanical properties of the deposits. The influence of the gas phase composition on the atomic concentration and the microstructure of the material was first investigated. Carbon rich coatings are turbostratic and highly textured, whereas boron nitride-rich coatings are more disordered and less anisotropic. We examined their oxidation behavior in the range 450°C to 700°C, under both dry and ambient air. The oxidation resistance of the h-B-C-N coatings strongly depends on the deposition temperature and is improved by heat treatments. It is significantly better than that of pyrolytic
carbon in dry air but worse in wet air, because of the reactivity of B2O3 with H2O. The room temperature
stress/strain behavior of unidirectional SiC/SiC composites with h-B-C-N interphases is elastic and damageable as in the case of reference composites having a pyrolytic carbon interphase.
Keywords: LPCVD, Boron carbonitride, Structure, Oxidation resistance, Mechanical behavior
1. introduction
Hexagonal B-C-N materials have become the topic of a large number of researches, since the first reports on the synthesis and characterization of these ternary compounds in the early 1970s.
Most of the researches on B-C-N coatings were aimed at developing new materials for microelectronics or protective coatings against oxidation, corrosion, wear and erosion.
† Present address: PROMES (UPR8521), CNRS, Tecnosud, Rambla de la thermodynamique, 66100
PERPIGNAN, FRANCE
Due to the similar crystal structures and similar atom size of graphite and h-BN, the formation of solid solutions in the B-C-N ternary system is expected. Furthermore, the substitution of C-C atomic pairs by isoelectronic B-N pairs satisfies the charge neutrality, as required to get a stable ternary compound. This is the reason why many authors focused on B1CxN1 compositions located on the tie line between C and BN in the ternary B-C-N phase diagram. In particular, the electronic properties of hexagonal BCxN compounds are expected to be intermediate between those of a semimetal like graphite, and an insulator like boron nitride. Beyond this specific range of compositions, the synthesis of BxCyNz solid solutions of controlled composition is a way to tune the chemical or physical properties of such materials.
Kosolapova at al. [1] first attempted to synthesize BxCyNz materials by use of a solid-gas reaction between boron and carbon powders under nitrogen or ammonia atmosphere at 1800-2000°C. Later on, Badzian et al. [2] reported for the first time the synthesis of solid solutions by chemical vapor deposition (CVD) using a gaseous mixture composed of BCl3, CCl4, N2 and H2 at 1900°C. Their pioneering work paved the way of a long list of attempts aiming at synthesizing and controlling the composition of substitutional B-C-N solid solutions by CVD [3-10]. Even if BxCyNz solid solutions are mainly obtained by CVD, polycrystalline thin films and bulk ceramics have also been synthesized by condensed-phase chemical reactions (solid or liquid) [1,11-13] and polymer pyrolysis [14-18] (Figure 1). Coatings have also been deposited by plasma-enhanced CVD techniques (PECVD) [19-31] such as microwave, glow discharge or magnetron sputtering with various targets. The various microstructures of BxCyNz coatings obtained by CVD and PECVD have recently been compared [32-33].
Figure 1: Examples of BxCyNz coating compositions extracted from the literature
CVD is an attractive process as it allows controlling the composition and microstructure of deposited materials, although these two features usually cannot be controlled independently. Previous authors have shown that a wide range of compositions can be attained by CVD starting from a BCl3-NH3-CxHy gas
Komatsu 2002 Flandrois 1996 Ray 2004 Besmann 1990 Maya 1990 Kaner 1987 Saugnac 1990 Bill 1992 Derré 1993 Derré 1994 Caretti 2010 Moore 1989 Kouvetakis 1986 Kouvetakis 1989 Weber 1992 Way 1992 Ottaviani 1998 Kawano 2002 Stanishevsky 2001 Nicolich 2001 TCVD-Stöckel 2003 Stöckel 2003 (MW) Stöckel 2003 (GD)
B
C
“BC
3”
N
BN
mixture, mostly with H2 dilution and C2H2 as the hydrocarbon. Saugnac et al. [34] deposited crystallized BxCyNz solid solution in the C-rich region of the B-C-N ternary diagram, while the BN-rich coatings were amorphous. Besides, it can be noticed that ion beam-assisted deposition at room temperature leads to the opposite behavior, i.e. to amorphous carbon-rich and crystallized BN-rich materials [31]. The work of Saugnac et al. was further completed by Derre et al. [35] who determined that crystallized BxCyNz solid solutions can be obtained within the whole composition triangle bounded by pure carbon, BN, and BC3. Since the first attempts to synthesize these materials, their precise structure and thermodynamic stability became a main issue: are these materials true substitutional compounds at the atomic scale or rather simple mixtures of hexagonal BN and carbon? Moore et al. [4] already observed in 1989 that samples deposited in the temperature range 1750-1900°C were probably composed of a single-phase mixture of C, B, and N atoms, but decomposed into a mixture of h-BN and boronated pyrolytic carbon when heat treated at 2500-2700°C.
Nanotubes are materials of interest to look at in terms of composition homogeneity at the atomic scale. A single-wall nanotube (SWNT) can indeed be considered as a curved graphene monolayer. BxCyNz SWNT were synthesized by Enouz et al. [36] with a continuous CO2 laser vaporization reactor that was also used to grow C-SWNT or BN-SWNT. The detailed analysis of the atomic composition of SWNT was carried out by means of both HRTEM and nanoelectron energy loss spectroscopy (nanoEELS). Both techniques evidenced that boron and nitrogen atoms co-segregate in a periodic manner in nanodomains embedded in the hexagonal lattice of a graphene layer. Such a segregation phenomenon was theoretically anticipated in the case of the hypothetical BC2N structure. Liu et al. [37], who used pseudopotential local-orbital calculations and Nozaki et al. [38], who applied a semi-empirical method, indeed determined that the lowest total energy structure is obtained by maximizing the number of C-C and B-N bonds. This can be obtained by the formation of BN-rich nanodomains in substitution for C atomic pairs in the hexagonal network. Calculations carried out by Nozaki et al. [38] showed the existence of two possible segregated BN patterns of striped or island-type, which may coexist as a quasi-stable state. Using the local density approximation to the density functional theory (DFT), Blase [39] confirmed that the thermodynamic limit of the h-BC2N compound is driven towards segregation. He further showed that in the case of B-doped nanotubes, B atoms segregate in pure BC3 nanodomains. More recently, Ivanovskaya et al. [40] emphasized by DFT study the importance of the description of the BN/C boundaries and suggested that BN/C interfaces involve N-C bonds preferentially.
All these experimental and theoretical results suggest that BxCyNz solid solutions are metastable structures with respect to stable graphite and h-BN compounds. The extended domain of composition that can be achieved by CVD using NH3 gaseous precursor may result from the very high nitrogen activity of this molecule.
In the present work, a large variety of coatings have been prepared by low pressure CVD (LPCVD), following the route proposed by Bartlett and coworkers [41-43], and by Saugnac et al. and Derré et al.
[34-35, 44]. They have been all obtained from a BCl3, NH3, C2H2 and H2 gas mixture. Their composition and structure were analyzed respectively by X-ray photoelectron spectroscopy (XPS), transmission electron microscopy and X-ray diffraction. Their oxidation behavior was investigated under dry and ambient air between 450°C and 700°C and correlated with physicochemical properties.
As pyrolytic carbon (pyrocarbon), h-B-C-N materials have a lamellar structure with strong covalent bonds within the hexagonal layers and weak Van Der Waals-forces between neighboring sheets. This particular structure is ideal for deflecting matrix cracks along the fiber/matrix interface and providing toughness to ceramic matrix composites (CMC) [45]. Furthermore, in boron-substituted pyrocarbons, boron is known to improve the oxidation resistance, compared to pure pyrocarbon and consequently the lifetime of composites in air at high temperature [46-48]. Besides, Saugnac et al. and Derré et al. [49, 44] reported insignificant weight changes at high temperature in dry air of h-B-C-N solid solutions synthesized in conditions close to those of the present study. There are thus substantial reasons to believe that hexagonal B-C-N interphases can be beneficial to the CMC properties. This is what we intend to demonstrate in this paper.
2. Experimental procedure
2.1. A few considerations on the gas phase reactivity
The gas mixture used to deposit the BxCyNz solid solutions consists of acetylene (C2H2), boron trichloride (BCl3), ammonia (NH3) and hydrogen (H2). This mixture exhibits a high reactivity and its control is of major importance to prevent gas phase nucleation, to obtain homogeneous coatings of the BxCyNz solid solution. The first difficulty is to handle the well-known reaction between NH3 and HCl that readily leads to ammonium chloride (NH4Cl) at low temperature. As HCl is produced by the chemical reactions involved in the deposition process, NH4Cl is expected to form and condense downstream in the cold parts of the reactor. To prevent clogging, a minimum temperature of 340°C, the NH4Cl sublimation/decomposition temperature, has to be imposed to the narrow parts at the outlet of the reactor. Another important effect of the high gas phase reactivity is the formation of the Lewis acid-base complex resulting from the reaction between NH3 and BCl3. This reaction is very fast under CVD conditions and is of prime importance in the deposition mechanism of boron nitride. It has been experimentally investigated by McDaniel et al. [50] by the use of a flow-tube reactor connected to a molecular-beam mass-sampling system. These authors probed the gas species present in the hot zone of the reactor and deduced the kinetic parameters of chemical reactions with a numerical approach combining thermokinetics and fluid dynamics. They observed the presence of aminodichloroborane Cl2BNH2 and diaminochloroborane ClB(NH2)2, which are formed by the reaction of BCl3 with two NH3 molecules successively. The gas phase mechanism involved in this chemical system was also investigated by Reinhardt et al. [51] using quantum chemical calculations. They confirm that BCl3 readily forms an adduct with NH3 without any transition state. In contrast, there is a high barrier for the intramolecular elimination of HCl leading to aminodichloroborane. Cl2BNH2 can further react with NH3 to form ClB(NH2)2, according to a similar reaction path. The formation of triaminoborane by further amination is unfavored since this reaction is endothermic. The authors suggest that aminochloroboranes could also
react together to yield oligomers in competition with the formation of ammonia adducts. Yet, there is no direct evidence and no thermokinetic reason indicating that these high molecular weight species appear in the gas phase. The high temperature and low pressure applied during deposition are indeed more favorable to smaller species acting as BN effective precursors.
Strong chemical interactions are also related to the addition of acetylene to the gas phase. During the first experiments carried out in this particular gas feed configuration, a solid complex was found to clog up the line as soon as the two gases were mixed far upstream from the reacting zone. This phenomenon was
assigned to the reaction between the electron-rich -bond of C2H2 and BCl3 to form a Lewis adduct. In
addition to the room temperature reactivity of the two gases, other authors suggested that carbon deposition from C2H2 at high temperature was likely promoted by reactive species formed from the reaction between BCl3 and NH3 [52]. The activated decomposition of C2H2 was thought to be responsible for the soot formation in the gas phase at high temperature and for long residence time. In order to prevent the reaction between BCl3 and the two other Lewis bases at low temperature and reduce the C2H2 decomposition at high temperature, the BCl3/H2 and NH3/C2H2 mixtures were driven separately to the reactor with a tube injecting the latter close to −and upstream− of the hot zone. This configuration also allows the reduction by H2 of BCl3 into boron subchlorides, avoiding the adduct formation with NH3 while entering the reactor. Heterogeneous reactions leading to BxCyNz solid solutions are therefore promoted at the expense of homogeneous phenomena.
2.2. LPCVD reactor
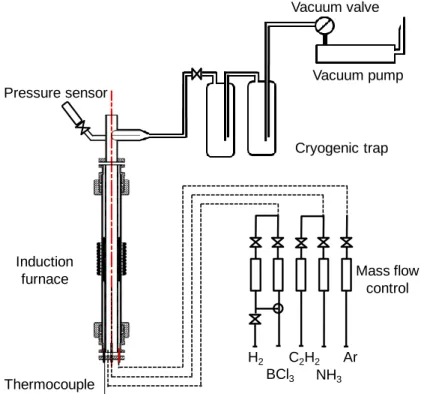
The reactor (figure 2) consists of a hot-wall silica tube surrounded by a graphite susceptor heated by radio-frequency induction. The graphite susceptor is itself protected from oxidation by a second external silica tube, the gap between the two SiO2 walls being maintained under flowing argon. The temperature of the susceptor is controlled by a thermocouple installed between the central SiO2 tube and the inner graphite wall. Temperature profiles were recorded by shifting a thermocouple along the axis of the reactor, from the bottom of the inductive coil (x=0), where gases enter the hot zone, to the top of the coil (x=14cm) at the gas
exit. The temperature is maximal at x=6cm and typically reduced by 10°C at x=61.5cm and 50°C at
x=64cm. The total pressure is regulated with a motorized valve coupled with a Baratron pressure gauge
(both from MKS). The initial composition of the gas phase is adjusted by controlling the flow rates of the various gases through mass flow meters (from Brooks Instruments). The total gas flow Q was kept of the
order of 440-490 standard cm3min-1 (sccm) for the various experiments. At a temperature of 1000°C and a
total pressure of 5 kPa, Q corresponds to a residence time of about 25ms. The purity of the gases is 99.99 mol% for both BCl3 and NH3, 99.7 mol% for C2H2 and 99.9999 mol% for H2 (all from Air Liquide). High BCl3/NH3 ratios (typically 5-10) and variable C2H2/BCl3 proportions (0.25-1.5) in the initial gas phase were explored because of a potential combination of effects: the strong reducing nature of NH3 for BCl3, the low heterogeneous reactivity of acetylene and the role of BCl3 in the C2H2 decomposition. The reactants were
highly diluted in H2 (approximately 10 times for the total amount of reactants) to promote BCl3 reduction while achieving low residence times.
The coatings were deposited on Nicalon NLM202 SiC-based fibers (with a mean diameter of 14µm). These fibers are chemically and structurally stable at the deposition temperature. For the first set of experiments, several monofilaments were installed along the whole length of the deposition chamber (from x=0-14cm) to examine the influence of both the deposition temperature and the residence time. For the more detailed characterizations as well as the mechanical tests, single fiber (8 cm long) were attached on a graphite frame with a carbon-based cement (CM34 from GraphTech) prior to deposition. For the oxidation tests by thermo-gravimetric analyses (TGA), the coating was deposited on fiber bundles of approximately 500 monofilaments to maximize the reacting surface. The bundles were spread out across the graphite frame to ensure the homogeneity in thickness. Since the total length exposed to gases (6 cm) was not isothermal, the monofilaments were taken only from the central part of the fiber tows for the tensile tests or the physicochemical analyses.
Figure 2: CVD reactor used for the deposition of the BxCyNz coatings
2.3. Chemical and structural analyses of the h-B-C-N coatings
The free surface and the failure cross section of the deposits were observed by scanning electron microscopy (SEM Hitachi S4500FEG). Their elemental composition was first examined by energy dispersive X-ray spectrometry (EDS), with the same SEM apparatus. Quantitative analyses were performed in the wavelength-dispersive mode (WDS), by electron probe microanalysis EPMA (Cameca SX 100, operating at 7 kV and 10nA). Pyrolytic carbon, pure boron and silicon nitride (Si3N4) were used as standards for the B, C, N quantification, respectively. The specimens were embedded in epoxy resin and polished prior to the EPMA analyses. Punctual measurements were carried out from the cross sections of coated fibers, in the
Ar NH3 C2H2 BCl3 H2 Vacuum pump Cryogenic trap Vacuum valve Mass flow control Pressure sensor Thermocouple Induction furnace
center of a few micrometers-thick coatings. For each CVD condition, a systematic EDS analysis of the surface of the coating was carried out along the axis of the fiber substrate to determine the influence of the residence time on the elemental composition. On the other hand, we investigated the influence of the CVD parameters on the atomic composition of the deposits. For that purpose, the elemental composition was accurately measured by EPMA-WDS, at a given axial position corresponding to the center of the hot zone of the reactor. Accordingly, some discrepancies may be noticed between the compositions measured by EPMA-WDS and the profiles obtained by SEM-EDS. The homogeneity of the composition through the thickness of the coatings was also checked by Auger electron spectroscopy analysis (AES, nanoprobe Auger VG Microlab 310F). The analyses were performed directly from the free surface of coated fibers, simultaneously to argon etching to record the B, C, N and O atomic profiles.
The structure of the h-B-C-N coatings was examined by X-Ray diffraction (D8 Advance Bruker, λCu–
Kα1=0.154056 nm). The analyses were carried-out directly from a few micrometer-thick coatings deposited
on SiC fiber tows. A parallel beam/grazing incidence angle (5°) configuration allowed to reduce significantly the influence of the surface roughness and the substrate itself. The average length (Lc) along the c axis of the coherent domains was calculated using the Scherrer equation:
𝐿𝑐 = 𝐾𝜆
𝛽cos𝜃
Where K is a constant equal to 0.9, is the X-ray wavelength (Cu-Kα: 0.15406nm) and is the
experimental width of the 002 diffraction peak, considering that =√𝛽0022 − 𝛽𝑖𝑛𝑠𝑡2 , where 002 is the
experimental width and inst a correction value due to instrumental broadening. Lc is only an estimate as the
calculation assumes a narrow distribution of the size of the coherent domains.
The structure of the coatings was also investigated by transmission electron microscopy (TEM) (CM30ST Philips, operating at 300kV). The coated fibers were embedded in epoxy resin and sandwiched between a silicon wafer and a glass plate. Slices were cut perpendicular to the fibers and mechanically thinned down to
50 μm. The thin slices were then submitted to Ar+ ion beam milling (JEOL IS Ion Slicer, operated at 6 kV)
until the electron transparency of the coating is reached [53].
Raman microspectroscopy analyses (RMS) were achieved in complement of the XRD and TEM structural investigations. Raman spectra were recorded with a Labram HR microspectrometer (from Horiba Jobin
Yvon) using a He/Ne laser ( = 632.8 nm). The analyses were made from polished cross sections of the
specimens in the punctual mode with a lateral resolution of about 1 m. The power of the incident laser
beam was kept below 0.5 mW to avoid local heating of the specimen.
The surface chemistry of the deposits was analyzed by X-ray photoelectron spectroscopy (XPS) (ESCALAB VG 220i-XL spectrometer) using an Al-Kα monochromatic RX source (hν=1486.6eV). The binding energies were referred to the Au4f7/2 peak at 84.0 eV (FWHM = 0.80 eV at a pass energy Ep = 20 eV, was
acquired only a few days apart from the current BxCyNz spectra). The spectra were acquired at of Ep = 40 eV (a compromise value for optimizing spectral resolution and counting statistics). The resolution expected for
the binding energy position is +/- 0.1 eV while that of the Al-K line is 0.3 eV. The analyses were
performed from small bundles of coated fibers. The zone analyzed corresponds to an X-ray spot of about
200m. The XPS spectra were first recorded without sputtering to avoid altering the binding energies. A
slight Ar+ sputtering was then achieved to remove surface contamination and check the in-depth
homogeneity of the elemental composition.
2.4 Oxidation resistance of the h-B-C-N coatings
Boron oxide (B2O3) is the only condensed phase that can possibly form during the oxidation of the h-B-C-N coatings. Since B2O3 is highly reactive to atmospheric moisture, the oxidation tests were carried out in both
dry and ambient air for comparison. The oxidation resistance in dry air (N2/O2: 80/201%, purity: 99.999%,
from Air Liquide) was evaluated by thermo-gravimetric analysis (TGA, Setaram TAG 24). Each sample was composed of four specimens of 1 cm long bundle, containing about 500 SiC monofilaments. The BxCyNz samples were oxidized according to the following temperature sequence: 10 hours at 550°C, 90 min at 600°C, 30 min at 650°C and 20 min at 700°C. The oxidation temperature did not exceed 700°C to prevent B2O3 vaporization. B2O3 volatilization is indeed negligible below 950°C under dry air [54]. The samples were maintained under argon atmosphere during cooling down. For the tests in ambient air, the specimens were simply placed in an open tubular furnace.
2.5 Mechanical testing of SiC/h-B-C-N/SiC composites
The ability of BxCyNz films to serve as an interphase in CMC materials was evaluated by tensile testing
microcomposite specimens [55]. The microcomposites were prepared by coating Nicalon NL200 fibers successively with a 150nm-thick BxCyNz interlayer and a silicon carbide outer coating with a volume fraction of about 45%. Each specimen was mounted on a paper frame to measure its diameter by laser diffraction and align and fix the specimen in the grips of the tensile testing device (the frame was cut afterwards). For each type of interphase, including pyrolytic carbon (serving as a reference), 30 specimens were tested using a gauge length of 10 mm. Longer lengths (25 and 40 mm) were occasionally tested in
order to calculate the compliance of the system to deduce the strain . The stress was determined from the
load and the outer diameter of the micropcomposite. The specimen was monotonically loaded up to failure
to determine the limit of the elastic domain (σEL and EL), the Young’s modulus E and the ultimate failure
properties (σF and F).
The various batches of microcomposites were submitted to static fatigue (thermal aging under a constant load) in air at 550°C. The heating and loading bench allowing testing simultaneously 22 specimens (with a 10 mm gauge length) and the procedure used for the tests are described elsewhere [56]. In order to expose more efficiently the interphase to oxidation, the load applied to each specimen was chosen 10 to 15% beyond the upper limit of the elastic domain (as identified from the room temperature tensile tests) to induce
matrix cracking. The lifetime of the microcomposites was measured individually with triggers connected to timers.
3. Results and discussion
3.1. Deposition kinetics and composition of the BxCyNz coatings
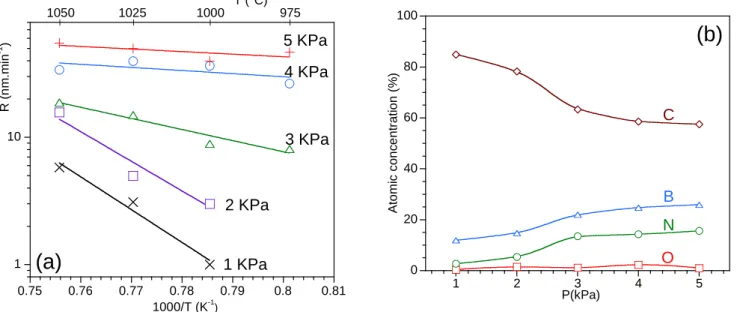
A series of experiments was first performed to identify the influence of the deposition temperature T and the total pressure P on the deposition kinetics and the elemental composition of the deposit. The molar fractions in the gas mixture injected in the reactor were fixed at 4%, 0.5%, 11% and 84.5% respectively for BCl3, NH3, C2H2, and H2 (BCl3/NH3=8 and C2H2/BCl3=2.75), and the total gas flow at 490sccm. For this preliminary study of the T and P effects, the deposition rate R (figure 3a) and the elemental composition (as measured by AES, figure 3b) were determined in the center of the hot zone. There is a significant influence of the total pressure on the deposition kinetics and the thermal activation (figure 3a), but the effect is also very strong on the composition of the coatings (figure 3b). At 5 kPa and below 980°C, the deposition rate increases with temperature indicating that the deposition process is controlled by heterogeneous chemical reactions (CR regime). In contrast, at higher temperature, the deposition rate becomes almost independent of temperature according to a process controlled by mass transfer in the gas phase (MT regime). Between 980 and 1050°C, the decrease of the total pressure results, starting from 5 to 3kPa, in a transition from a MT
regime to a first low thermal activation CR regime (100 and 170kJ.mol-1 at 4 and 3kPa, respectively). A
second transition is observed from 3 to 1kPa leading to a more thermally activated CR regime (≈500kJ.mol
-1), indicating a change in the deposition mechanism. The deposition rate decreases with the total pressure
simultaneously, in particular below 4kPa in the CR regimes, due to the higher concentration of reactive species. In the coatings deposited at 1050°C, the increase of the pressure results in higher boron and nitrogen concentrations and a lower amount of carbon (figure 3b). At 1 kPa and 1050°C, the deposition rate is low and the coating mainly consists of carbon. At such a low pressure, the deposition process is highly activated by the temperature and essentially controlled by the decomposition of C2H2 into reactive hydrocarbon species. At 2 kPa, the deposition rate increases due to the higher concentration of reactive species, but the deposition mechanism remains unchanged. At 3 kPa and higher pressures, the coatings get gradually enriched in boron and nitrogen through a different deposition mechanism leading to higher deposition rates and a lower activation energy. A very similar T-P dependence has already been noticed for the deposition rate of h-BN from BCl3-NH3-H2 mixtures [57].
Figure 3: Deposition rate R as a function of temperature and total pressure (a) and atomic concentration (as measured by AES) of coatings deposited at 1050°C as a function of total pressure (b)
The composition and the thickness of the coatings were measured by SEM-EDS along the whole length of the reactor for a deposition temperature of 1025°C and two distinct values of the total pressure: 2 kPa (figure 4a) and 4 kPa (figure 4b). In both cases the deposit is almost oxygen free except near the exit of the reactor. The temperature at this position of the reactor is well below that of the central hot zone. The unstable solid deposited reacts with oxygen after cooling when exposed to the ambient air. At 2 kPa, the deposits are thin, carbon rich and do not include nitrogen at the entrance of the hot zone. The deposition rate and the amounts of B and N both increase rapidly when going further on, while the residence time increases. The coating is almost composed of pure BN near the end the hot zone.
Figure 4: Atomic concentration (as measured by EDS) and thickness profiles as a function of the position x along the reactor. x=0 corresponds to the gas inlet at reactor bottom: (a) 2 kPa, (b) 4 kPa (T=1050°C, Qtot=490 sccm) 1 10 0.75 0.76 0.77 0.78 0.79 0.8 0.81 R ( n m .m in -1 ) 1000/T (K-1) T (°C) 1050 1025 1000 975 1 KPa 2 KPa 3 KPa 4 KPa 5 KPa
(a)
0 20 40 60 80 100 1 2 3 4 5 A tom ic con c e nt rat ion ( % ) P(kPa) O B C N(b)
0 20 40 60 80 100 0 0.5 1 1.5 2 2.5 0 2 4 6 8 10 12 14 16 e ( m) x (cm) A tom ic con c e nt rat ion ( % ) O B C N e(a)
0 20 40 60 80 100 0 0.2 0.4 0.6 0.8 1 1.2 0 2 4 6 8 10 12 14 16 e ( m) x (cm) A tom ic con c e nt rat ion ( % ) O B C N e(b)
The composition profiles are entirely different at 4 kPa. The deposition rates of B and N are enhanced from the very entrance of the hot zone, and the composition and thickness gradients are consequently both significantly reduced (figure 4b). In agreement with figure 3a, the reactivity of the BCl3-NH3 system and thus, the B and N deposition rate, are both improved with an increase of the total pressure. These conditions allow the deposition of the C, B and N elements at rates that are compatible with the formation of the BxCyNz solid solution and all relatively constant versus the residence time.
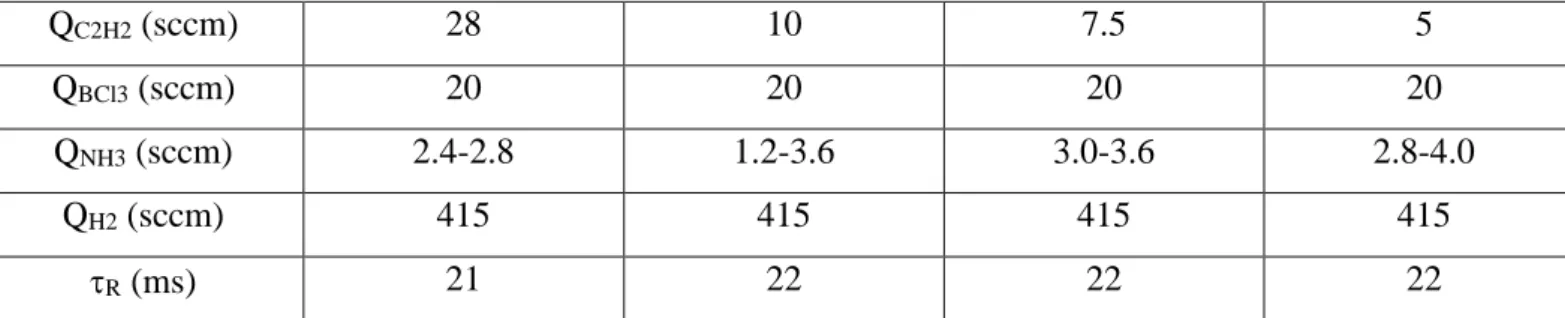
In a next step, the temperature and the total pressure were both maintained constant at respectively 1025°C and 4kPa, and the partial pressures of the various precursors were varied independently to study their influence on the deposition rate and the elemental composition of the resulting coatings. More precisely, the influence of the ammonia flow rate QNH3 was investigated for several values of the acetylene flow rate QC2H2, the H2 and BCl3 flow rates being both constant and the total gas flow rate (and thus the residence time) remaining nearly unchanged (table 1). For a given value of QC2H2, the increase of QNH3 results apparently in the substitution of carbon by BN in the overall composition of the coatings (figure 5). This result suggests that, although BCl3 and NH3 are independent precursors of respectively boron and nitrogen,
they jointly contribute to the composition of the BxCyNz coatings through the formation of sp2 B-N bonds in
the solid. Indeed, gaseous species bearing both B and N atoms could be formed directly from gas phase reactions as discussed in the previous section. Since BCl3 is in large excess in the initial gas mixture, an increasing amount of ammonia is likely to promote reactions between BCl3 and NH3 to form potential BN gas precursors such as Cl2BNH2. The BxCyNz compositions are close but noticeably out of the C-BN tie line on the B-rich side of the ternary B-C-N phase diagram (figure 5). This suggests the formation, probably by
surface reactions, of sp2-hybridized B-C and C-C bonds in parallel to the B-N bonds of the BxCyNz coating.
Only a few details are available in the literature dealing with homogeneous or heterogeneous reactions
involved in the growth mechanism of hexagonal C-B (i.e. sp2 boronated carbon) coatings from BCl3 and
C2H2. Yet, one can assume from other studies on the CVD of boron carbide [58] that species bearing both B and C atoms are unlikely to form in significant amounts in the gas phase and serve as effective precursors of BxCyNz coatings. QC2H2 (sccm) 28 10 7.5 5 QBCl3 (sccm) 20 20 20 20 QNH3 (sccm) 2.4-2.8 1.2-3.6 3.0-3.6 2.8-4.0 QH2 (sccm) 415 415 415 415 R (ms) 21 22 22 22
Table 1: Gas flow rates applied for the CVD of BxCyNz coatings (T = 1025°C, P = 4 kPa, see elemental composition in figure 5)
Figure 5: Influence of the initial composition of the gas phase on the atomic concentration of the coatings (see Table 1) (P=4 kPa, T=1050°C, Qtot=490 sccm)
3.2. Selection of a set of BxCyNz coatings
Four coatings (S1, S2, S3 and S4) of different elemental compositions and deposited from different initial gas mixtures, were selected for more detailed characterizations. The deposition temperature of 1025 °C was chosen high enough to obtain a highly anisotropic coating, but sufficiently low to avoid any thermal degradation of the fibers that could lead to a drop of their mechanical strength. The total pressure was fixed at 4 kPa and the total flow rate was maintained close 450 sccm for the entire set of experiments. These conditions indeed lead to homogeneous thickness and composition (figure 4) along the 50-60 millimeter lengths of the fiber substrate needed for the mechanical tests (see section 2.5).
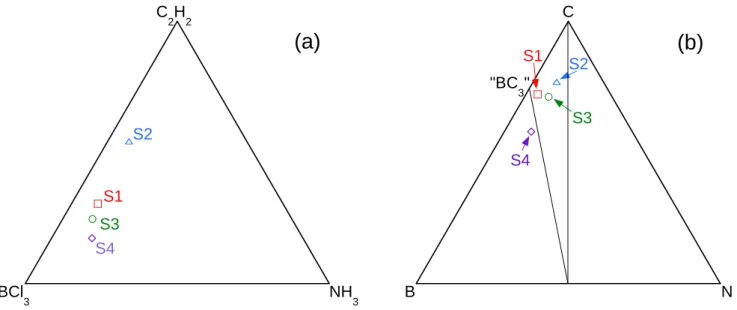
The influence of the initial composition of the gas phase on the elemental composition of the deposits is highlighted in figure 6 on two BCl3-C2H2-NH3 (a) and B-C-N (b) ternary plots. The respective gas flows and atomic concentrations are gathered in table 2 (the H2 flow was maintained constant at 415 sccm for all runs). As well as for previous deposits, the oxygen concentration in these four coatings is lower than 1 at.%, the detection limit of EPMA-WDS. Coating S2, which is prepared with the lowest proportion of NH3 in the gas phase, contains the highest carbon concentration and the closest composition to the C-BN tie line. As expected, the C concentration decreases significantly with the initial C2H2 ratio in the gas phase. Coating S4, obtained with the lowest proportion of C2H2, displays indeed the lowest C content and the highest B and N concentrations. The two diagrams confirm besides that a large BCl3/NH3 ratio is also required in the initial gas phase to reach significant contents of B and N in the deposits. This result illustrates the dual role of BCl3 in the deposition process of BxCyNz, i.e. the reaction with C2H2 required for the deposition of C and the reaction with NH3 (through the formation of gas intermediates) leading to the deposition of B and N.
The deposition rate (R) of the S1-S4 coatings was also evaluated by direct SEM thickness measurements. R varies only moderately with the initial composition of the gas phase. Higher H2/BCl3 ratios, leading to
Q C2H2= 7.5 sccm Q C2H2= 5 sccm QC2H2= 28 sccm Q C2H2= 7.5 sccm B N C
higher carbon contents, results in a slight inhibition of the deposition rate: R indeed decreases from 3.8 m/h
for S4 to 2.9 m/h for S2.
Figure 6: influence of the initial composition of the gas phase (a) on the atomic concentration of the BxCyNz coatings (see Table 2), (b) (P=4 kPa, T=1050°C, QH2=415 sccm)
3.3. Physicochemical characterization of the S1-S4 BxCyNz coatings and comparison with pyrocarbon reference
As a matter of comparison, a pyrolytic carbon coating was synthesized in the same CVD reactor and submitted to the same investigations as the BxCyNz coatings, except for Raman microspectroscopy analyses. This reference specimen, simply referred to as PyC in the following sections, was deposited at 1025°C and 5 kPa from a C3H8-H2 mixture (1/1 in volume). In the particular case of RMS analyses, the BxCyNz coatings were compared to a rough laminar pyrocarbon (RL-PyC) [59].
QBCl3 (sccm) QC2H2 (sccm) QNH3 (sccm) xB (at.%) xC (at.%) xN (at.%)
S1 20 10 2.8 24.0 72.2 3.8
S2 20 28 3.6 15.4 76.9 7.7
S3 20 7.5 3 20.9 71.2 7.9
S4 20 5 3.8 33.1 58.0 8.8
Table 2: Gas flow rates applied for the CVD of four BxCyNz coatings (S1-S4) deposited in different gas
phase conditions (T = 1025°C, P = 4 kPa, QH2 = 415 sccm) and respective atomic concentration xi, as
measured by EPMA-WDS
- 3.3.1 Morphological analyses
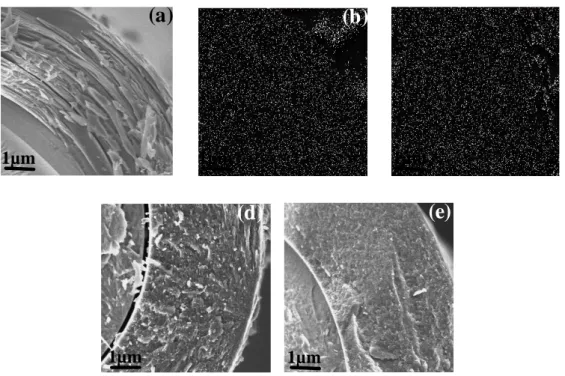
SEM observations were carried out from fractured cross sections of the coatings. Some delamination is visible between the fiber and the coating (figure 7) that probably appeared during the intentional fracture. This indication of poor interfacial strength, which is often encountered in the case of pure BN interphases, is
D S1 BCl 3 NH3 C 2H2 S2 S4 S3
(a)
D S1 B N C S2 S4 S3 "BC 3"(b)
probably due to the presence of a thin silica interlayer [60]. On the other hand, no transverse cracks that would affect the oxidation resistance could be detected from the outer surface of the BxCyNz coatings.
Significant disparities in the microstructure can be evidenced when comparing the different coatings (figure 7). The typical layered structure of pyrolytic carbon is only observed in the case of S1 and S2, the S3 and S4 coatings exhibiting instead a rather granular morphology. This mere feature suggests that S1 and S2 would be more appropriate for crack deflection, from mode I to mode II, than the two other coatings.
Figure 7: Cross section of the (a) pyrocarbon and BxCyNz coatings, deposited on SiC fibers: (b) S1, (c) S2, (d) S3 and (e) S4
- 3.3.2 Structural and textural analyses
The structure and the anisotropy of the BxCyNz coatings were investigated at various scales by polarized-light microscopy (PLM), transmission electron microscopy (TEM), Raman microspectroscopy (RMS) and X-ray diffraction (XRD). These techniques are often employed for the characterization of pyrolytic carbons [61-63] but they are also suited to other lamellar materials with hexagonal structures. The term microtexture generally used to describe pyrocarbons is typically multiscale as it includes the curvature and length of the individual hexagonal sheets, their stacking into coherent domains and their preferential orientation (or anisotropy) with respect to the growth direction. The anisotropy of the coatings is a relatively long range
property. It can be characterized at the 1-10 m scale by the extinction angle Ae and the intensity ratio RA,
determined respectively by PLM and polarized RMS. In the case of pyrocarbon, Ae and RA both increase with the anisotropy [63-66]. The preferential orientation of the carbon layers can also be assessed at various submicrometer scales from the orientation angle OA of the 002 arc on the SAED pattern. The misorientation distribution of the layers (OA) decreases when the anisotropy is improved [65-66].
Structural features at shorter range are accessible by XRD, TEM and RMS. These techniques allow respectively the quantification of the coherent domains (i.e. the size of coherent domains along the c axis Lc
1µm
(a)
1µm(b)
(c)
1µm 1µm(d)
(e)
1µmand the 002 interlayer distance d002), the direct examination of the atomic layers from the 002 lattice fringe and the indirect assessment of the density of in-plane defects from the width of the Raman D band wD [59]. It is indeed important to recall that, for the main part, the Raman features of hexagonal carbon and BN (G, D, D’...) correspond to in-plane vibrations.
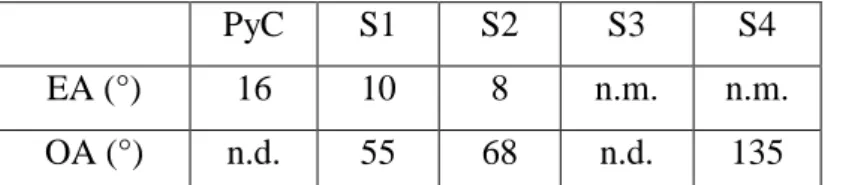
The Ae measurements were carried out in the same configuration on the reference PyC and BxCyNz coatings. S1 exhibits a slightly higher anisotropy than S2, which is itself much more anisotropic than S3 and S4. The BxCyNz coatings are all less textured than the reference PyC coating. The SAED patterns used for the
assessment of OA were recorded with a 100 m selector diaphragm. According to the OA-based
classification proposed by Reznik-Hüttinger [65], the S1 coating is close to the high-textured category, while S2 is medium-textured and S4 very low-textured (table 3).
PyC S1 S2 S3 S4
EA (°) 16 10 8 n.m. n.m.
OA (°) n.d. 55 68 n.d. 135
Table 3: Extinction angles (Ae), as measured by polarized light microscopy and orientation angles (OA), as measured by TEM from the 002 arc on the SAED diffraction pattern: comparison of the PyC and S1-S4 BxCyNz coatings (n.d.: not determined, n.m.: not measurable).
The 002 lattice fringe micrographs and related SAED patterns are in good agreement with the Ae and OA measurements and reveal further differences in the structure at the atomic scale of the various BxCyNz coatings (figure 8).
Figure 8: HR-TEM and diffraction patterns of (a) S1, (b) S2 and (c) S4 coatings
(a)
(b)
The fringes are well contrasted revealing slightly larger coherent domains in S1 than in S2. These carbon rich coatings both exhibit a clear laminar texture with a marked preferential orientation of 002 layers. The increase in the B and N contents results in a decrease of anisotropy as well as major changes in the microtexture. This is obvious from the HRTEM micrograph of the S4 coating showing highly distorted and tangled 002 layers. These strong curvatures are probably associated with the presence of in-plane defects such as 5 or 7 membered rings or vacancies, as observed in pyrocarbon [67]. The curved layers surround nano-domains of porosity or amorphous material and are present in larger proportions in S4 than in S1 or S2.
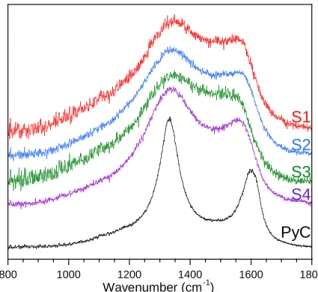
The Raman spectra of the reference RL-PyC and the various BxCyNz coatings are compared in figure 9. The spectra of the BxCyNz coatings display broad and relatively intense D and G bands, very similar to the Raman features of low temperature pyrocarbon [59, 63, 66]. In contrast, only one Raman band is expected
around 1367 cm-1 in this region of the spectrum in the case of pure h-BN. This phonon corresponds to
in-plane vibration of B-N bonds (E2g2 symmetry) and is usually very weak compared to the equivalent G band of graphite [68-69]. Raman features of pyrocarbonThe RMS analyses confirm the PLM and TEM results (figure 9, table 4). The RA values decrease successively from RL-PyC to S1/S2 and eventually S3-S4, revealing a gradual decrease of anisotropy. On the other hand, the wD variations indicate that the highly textured coatings S1 and S2 contain slightly more in-plane defects than S3 and S4. This result emphasizes the need to differentiate between short range structure and anisotropy, and suggests a comparable microtexture for S1, S2 and regenerated pyrocarbon (ReL) [59, 63]. High anisotropy and high density of in-plane defects are indeed often associated with lattice fringes that are highly crimped at the nanometer scale, while preferentially aligned at the submicrometer scale (figure 8).
Figure 9: Raman spectra of RL-PyC and S1 to S4 BxCyNz coatings.
The structure of the BxCyNz coatings was studied in more details by X-ray diffraction. The lattice parameters of h-BN, pyrolytic carbon and hexagonal boron carbonitride can be so close, that XRD on its own is
800 1000 1200 1400 1600 1800 RL S2 S1 PyC S3 S4 Wavenumber (cm-1)
inappropriate to differentiate between these different phases [17, 70]. Accordingly, this technique was only used to assess the crystalline state of the coatings (d002, Lc) regardless of the nature of the phases.
RL-PyC S1 S2 S3 S4
RA 6.5 (0.7) 5.4 (0.5) 5.5 (0.5) 4.2 (0.2) 4.2 (0.2)
wD (cm-1) 86 (3) 193 (3) 174 (9) 157 (13) 167 (7)
Table 4: Intensity ratio RA and D band width wD, as measured by polarized Raman microspectroscopy: comparison of a RL-PyC and S1-S4 BxCyNz coatings (averages values and standard deviations, in brackets, are deduced from ten different measurements).
As expected from the HRTEM analyses and confirmed in figure 10, the S1-S4 coatings exhibit a turbostratic structure with a predominating two-dimensional order. The absence of (hkl) peak for h≠0 or k≠0 is indeed characteristic of the lack of three-dimensional order. This structure is very similar to that of pyrocarbons deposited at low temperature. The lower d002 and larger Lc values of the BxCyNz coatings, compared to the PyC reference deposited in similar conditions, show that they have a better structural organization (table 5). Substitutional boron is indeed known to promote graphitization and reduce d002 in boronated carbon materials [71]. In good agreement with the TEM analyses, the XRD patterns (figure 10) show that S1 is the BxCyNz coating having the highest crystallinity. The coherent domains are the largest (Lc ≈ 10 nm) and the d002 distances the shortest (3.395 Å compared to 3.354 Å for graphite) of all BxCyNz coatings. The broadening of 002 peak observed from S1 to S4 is indicative of a decrease of Lc (table 5).
Figure 10: X ray diffraction patterns of pyrolytic carbon and S1 to S4 BxCyNz coatings. * The broad peak at
35.5° corresponds to the -SiC (111) nanocrystallites of the Nicalon fibers.
10 20 30 40 50 60 S2 S1 PyC S3 S4 2 (°) * * * * PyC S1 S2 S3 S4
Table 5: 002 peak position (2θ), full width at half maximum (w002), 002 plane spacing (d002) and average size of the coherent domains (Lc), assessed from the XRD patterns of the S1-S4 BxCyNz coatings (figure 10).
The influence of the boron atomic concentration on the structural parameters d002 and Lc of the BxCyNz coatings is plotted in figure 11. The curves show a sharp maximum of Lc and a minimum of d002 at a boron concentration of 24 at.% (i.e. for S1). A similar behavior was observed for boronated pyrocarbons prepared in relatively close CVD conditions [48, 72]. Two minima of both w002 and Lc were indeed detected, but in this case at 10 at% of boron (figure 11). It is important to remind that S1 is the BxCyNz coating with the lowest nitrogen concentration (< 4 at.%). S2, which has the lowest boron content, is slightly better organized than S3 and S4. A low nitrogen concentration (< 4 at.%) and a relatively high concentration of boron are necessarily associated with the incorporation of a large amount of B in the carbon hexagonal layers. The homogeneous distribution of isolated B-N bonds in the layers probably leads in this case to a high crystalline state and anisotropy of the S1 coating. On the other hand, a higher nitrogen concentration (≥7 at. %) at still relatively high B concentration reduces both crystallinity and anisotropy of the S3-S4 coatings. The introduction of a larger number of B-N bonds likely leads to hexagonal layers with alternate BN and h-boronated carbon clusters, to the detriment of the BxCyNz solid solution.
S1, with only a few isolated B-N bonds in the hexagonal boronated carbon (h-B-C) layers, display the highest anisotropy and the best crystalline state at long range in the stacking direction (d002, Lc). Yet, as for the ReL pyrocarbon [59-63], HRTEM and RMS indicate that S1 involves a high concentration of defects at short range in the longitudinal direction. On the other hand, S3 and S4 contain more B-N bonds, probably gathered in h-BN clusters embedded in h-B-C domains. This structure leads to a lower amount of in-plane defects and to tangled layers with larger radii of curvature. The resulting microtexture is characterized by a lower anisotropy and a poorer organization along the c axis.
2θ (°) 25.36 26.23 26.10 25.94 25.7
w002 (°) 3.07 0.73 1.70 1.56 2.04
d002 (Å) 3.510 3.395 3.412 3.432 3.464
Figure 11: Influence of the boron atomic concentration of the BxCyNz coatings on their structural parameters Lc and d002.
- 3.3.3 X-ray photoelectron spectroscopy XPS
The local chemical structure of the BxCyNz coatings was also examined. Solid NMR [17, 48, 73] is a
powerful technique but heavy and complex to conduct and interpret, especially for 11B nuclei, due to
quadrupolar interactions and moreover in the case of coatings. XANES can also be used [29] but an X-ray synchrotron source is needed and the analysis is only qualitative. X-ray photoelectron spectroscopy (XPS) is clearly more accessible and accordingly, it has been used to address the possible existence of B-C-N solid solutions [24, 34, 42, 74-76]. The semi-quantitative chemical composition of the extreme surface can be measured and the nature of the nearest-neighbor atoms of a given element assessed by comparing the binding energies to values for reference materials. The main limitation of XPS is related to surface
contamination making the spectra analysis sometimes difficult to interpret. In situ Ar+ sputtering can
eliminate O and C contaminants but it may also alter the spectral features and therefore the chemical bonding analyses. For this reason, the analyses were carried out without sputtering and considered only qualitatively for comparison of the various BxCyNz coatings. The specimens were kept away from air and moisture to limit contamination.
The surface atomic concentrations of the S1-S4 coatings are presented in table 6. The compositions of S1, S2 and S3 are all close. S4 having the lowest concentration of carbon also displays the highest oxygen amount. This sign of a high surface reactivity might be due to the disordered structure and high boron concentration of this coating.
xB (at.%) xC (at.%) xN (at.%) xO (at.%)
S1 19.6 67.4 4.3 8.7 S2 18.4 68.3 4.8 7.8 S3 18.7 68.9 4.6 7.6 0.335 0.34 0.345 0.35 0.355 0 2 4 6 8 10 12 -5 0 5 10 15 20 25 30 35 d (002) (n m) Lc (nm ) B atomic concentration (%) d (002)(ref. [68]) d (002)(this work) Lc (this work)
S4 30.8 54.6 3.2 11.0 Table 6: Surface atomic concentration xi, as measured by XPS
To facilitate the assignment of the B1s, N1s and C1s XPS features, the various attributions of the binding energies reported by other authors for similar materials were compared in figure 12 [8, 24, 34, 42, 46-48, 70-77]). Moreover, a boronated carbon coating was synthesized in the same reactor using a C3H8-BCl3-H2 mixture of respectively 48, 12 and 150 sccm. This coating, referred to as BxCy, was deposited at 950°C and 4 kPa. Its composition, as measured by EPMA, is B0.04C0.96. The BxCy coating was analyzed by XPS in the same conditions as the BxCyNz coatings and the peak fitting was achieved according to the same procedure. The BxCy material could then serve as an internal reference instead of simply referring to previous works. The h-BN type bond on the B1s spectrum is identified at 190.7 eV in agreement with the literature [8, 42, 75, 77]. The lower energy 187.5 and 188.4 eV components correspond to bonds present in the binary B-C, with more electropositive environments of the boron atoms. From the comparison between the BxCyNz and the BxCy spectra, it appears that the 188.4 eV peak could be assigned to hexagonal boron-substituted carbon (h-B-C) [8, 46-48]. It should nevertheless be noted that the reported binding energies associated to this type of material are highly scattered (figure 12). The 187.5 eV peak, on the other hand, corresponds for most
authors to boron carbide (B4C) [46-47, 74]. Saugnac et al. nevertheless attributed a 187.3 eV feature to B-C3
environments (atomic environments are given in italics in the following) [34]. The higher energy 189.5 eV component could be then attributed to boron atoms in a mixed hexagonal C/N environment (h-B-C-N), in agreement with other authors [42, 74]. It is indeed intense for BxCyNz coatings and weak for the BxCy
reference, possibly due to surface oxidation. More electronegative boron environments than B-N3 (in h-BN)
appear at energies beyond 190.7 eV for oxidized boron sites such as B-CnO3-n, B-NnO3-n and B-O3,
successively (figure 12). B-O3 in B2O3 is expected around 192.8 eV [34, 46-47, 77]. The binding energy
distribution found in literature for the various oxidized B sites is obviously broader (figure 12). For
simplification, a common value of 191.8 eV was attributed to the mixed B-CnO3-n or B-NnO3-n sites for the
fitting of the B1s spectra. All the binding energy values used for the fitting of the B1s spectra and the corresponding atomic environments are gathered in table 7a.
The various B1s spectra (figure 13) reveal that boron sites attributed to h-B-C generally prevail in both BxCy and BxCyNz coatings. As expected, relatively intense additional peaks are also visible for the BxCyNz
coatings, attributed to B-N3 and B-NnC3-n sites. The intensity of the component assigned to boron clusters is
Figure 12: Distribution of binding energies, extracted from literature [8, 24, 34, 42, 46-48, 71-77] (open symbols), current values used for the fitting (solid and larger symbol) and attribution to standard compounds and atomic environments: (a) B1s, (b) N1s and (c) C1s core levels
The N1s spectra of the BxCyNz coatings exhibit a main peak at 397.4 eV. This component was assigned to
N-B3 environments (as in h-BN), although such a value seems rather low compared to those usually reported
around 398.0 eV (figure 12). Several other components appear at higher energy revealing a variety of atomic environments. Even though the value appears low again, the 398.7 eV peak used for the fitting could
correspond to mixed N-B2C or N-BC2 sites [24, 34, 76]. The higher energy peak at 399.9 eV could be related
to N-C3 environments or more likely to some partially oxidized nitrogen sites. These peaks are particularly
intense on the N1s spectrum of the B-rich S4 coating that was indeed found more oxidized at surface than the other coatings (table 6). Other features appearing beyond 400 eV were related to more oxidized nitrogensites (table 7b). 184 186 188 190 192 194 Oxide; B-C-O h-BN h-B-C-N h-B-C B 4C B O xi de [47] B-NC 2 B-N3 B-C 3 [34] [47] Clusters Monolithic [70] B-B nC3-n (--> n=2,1,0) B-O nC3-n (--> n=3,2,1) [34]
Binding energy (eV)
(a)
396 397 398 399 400 401 h-B-C-N h-BN h-B -C -NBinding energy (eV) N-C nB3-n [34] N-B 3 [34]
(b)
281 282 283 284 285 286 h-B-C-N h-C h-B-C h-B -C -NBinding energy (eV)
C-NnB3-n [34] C-C 3 C-BnC3-n [34] [34]
(c)
Figure 13: High resolution XPS spectra of the (a) reference BxCy and BxCyNz coatings: (b) S1, (c) S2, (d) S3 and (e) S4
The C1s spectra are extremely complex to analyze due to the many different bonds formed by surface
contamination. The main component correspond to sp2 type C-C3 sites at 284.3 eV. The previous studies on
h-B-C and h-B-C-N materials conclude that binary C-BnC3-n and ternary C-NnB3-n environments are expected
respectively at lower and higher energies compared to the 284.3 eV of sp2 carbon (figure 12). In agreement
with the large distribution observed in the literature [34, 48, 72, 74, 76], two C-BnC3-n components were
considered for the fit the C1s spectra, which can be related respectively to boron-rich (282.6 eV) and either
carbon-rich C-BnC3-n or partially oxidized (C-BnO3-n) environments (283.6 eV, table 7).
184 186 188 190 192 194 196
Binding energy (eV)
280 282 284 286 288 290 292 294
Binding energy (eV)
184 186 188 190 192 194 196
Binding energy (eV)
280 282 284 286 288 290 292 294
Binding energy (eV)
392 394 396 398 400 402 404 406
Binding energy (eV)
184 186 188 190 192 194 196
Binding energy (eV)
280 282 284 286 288 290 292 294
Binding energy (eV)
392 394 396 398 400 402 404 406
Binding energy (eV)
B1s C1s
(a)
(c)
(b)
B1s C1s N1s B1s C1s N1s 392 394 396 398 400 402 404 406Binding energy (eV) 280 282 284 286 288 290 292 294
Binding energy (eV) 184 186 188 190 192 194 196
Binding energy (eV)
184 186 188 190 192 194 196
Binding energy (eV)
280 282 284 286 288 290 292 294
Binding energy (eV)
392 394 396 398 400 402 404 406
Binding energy (eV)
B1s C1s
(d)
(e)
N1s
B2O3 B-O3 192.8 eV “Oxides” B-CnO3-n / B-NnO3-n 191.8 eV h-BN B-N3 190.7 eV h-B-C-N B-NnC3-n 189.5 eV h-B-C B-BnC3-n 188.4 eV B4C / h-B-C - / B-C3 187.5 eV B (clusters) - 186.6 eV (a) “Oxides” ? 401.9 eV “Oxides” N-CnO3-n 400.8 eV h-B-C-N / oxidized h-BN N-C3 / N-OnB3-n 399.9 eV h-B-C-N N-CnB3-n 398.7 eV h-BN N-B3 397.4 eV (b) “Oxides” ? 289.4 to 286.6 eV h-B-C-N C-NnB3-n 285.8 eV h-B-C-N / sp3 C C-NnB3-n / ? 285.0 eV h-C (sp2, graphite) C-C3 284.3 eV “Oxidized carbides” C-BnC3-n / C-BnO3-n 283.6 eV h-B-C C-BnC3-n 282.6 eV B4C - 281.7 eV (c)
Table 7: Chemical compounds, atomic environments and related binding energies used for the fitting of the B1s (a), N1s (b) and C1s (c) XPS spectra (figure 13)
Similarly, two components were applied at the high energy side of the spectrum (285.0 and 285.8 eV),
associated to ternary C-NnB3-n environments [34], but also possibly to sp3 carbon or C-C=O functions from
surface contamination. Further weak components due to more oxidized forms were finally added to fit the C1s spectra in the range 289.4-286.6 eV.
The XPS data suggest a structure for BxCyNz involving hexagonal boronated carbon domains mainly consisting of C-C3 sites for the carbon atoms and mixed environments for the boron atoms: B-C3, B-BC2 and B-B2C. B-B, N-N and C-N bonds are not favorable for the stability of the hexagonal structure [78].
Accordingly, the number of B-B2C environments is probably low, especially for low boron concentrations. N-B3 sites are by far the major nitrogen sites, as in h-BN. Clusters of h-BN could be present in some proportions, in particular for high B and N concentrations. The large bandwidth of the various components on the N1s and B1s spectra suggests, however, that other combinations of atomic bonding could be present, though in the minority.
3.4. Oxidation resistance of the BxCyNz coatings
The overall reaction expected for the oxidation of BxCyNz coatings can be represented by the balance equation (1): 𝐵𝑥𝐶𝑦𝑁𝑧+ (𝑦 +3 4𝑥)𝑂2 → 𝑦𝐶𝑂2+ 𝑧 2𝑁2+ 𝑥 2𝐵2𝑂3 (1)
This equation is consistent with the study on the oxidation behavior of similar materials from Derré et al. [44]. These authors indeed observed that boron oxide B2O3 is the only condensed species formed by oxidation in dry air between 800 and 1200°C. The weight change corresponding to the oxidation of one mole of BxCyNz is accordingly:
∆𝑚(𝐵𝑥𝐶𝑦𝑁𝑧) = 𝑂𝑚𝑎𝑠𝑠∗
3
2𝑥 − 𝐶𝑚𝑎𝑠𝑠∗ 𝑦 − 𝑁𝑚𝑎𝑠𝑠∗𝑧 (2)
This simple equation shows that, depending on the BxCyNz composition, the oxidation can result in a weight loss or gain, or even no mass change at all. The boundary between weight loss and gain is a line on the ternary B-C-N diagram linking the two hypothetical compositions B0.31C0.69 and B0.37N0.63. It is worthy of note that S1, S2 and S3 are expected to lose weight upon oxidation whereas the high boron and low carbon content S4 coating is on the “weight gain” side of the diagram, close to the “constant weight” line.
- 3.4.1 High temperature (550-700°C) oxidation in dry air
The TGA curves recorded for the various BxCyNz coatings and the reference pyrocarbon material are compared in figure 14.Two identical TGA runs were carried out on two BxCyNz samples of the same batch to appraise the test-retest reliability (figure 14a). All S1-S4 coatings lose weight when oxidized in dry air. The weight loss rate increases from S4 to S1, S3 and S2, i.e. when the boron content decreases. In comparison, the oxidation rate of the pyrocarbon coating in the same conditions is much higher (figure 14b). This behavior is in good agreement with equation 2, except for S4, for which a very slight weight gain was expected. This discrepancy could be related to some volatilization of the oxide due to traces of impurities in the coating (Cl, H) or in the atmosphere, or even to uncertainty in the BxCyNz atomic composition.
Figure 13: Weight change during the oxidation of BxCyNz coatings in dry air between 550 and 700°C. (a) Comparison between S1 to S4. (b) Comparison between pyrocarbon and BxCyNz coatings.
The oxidation behavior was further investigated by SEM observations of cross sections of the coatings after the TGA experiments. The SEM micrographs displayed in figure 15 reveal the progress of oxidation through the recession of the BxCyNz coating and the growth of the oxide layer.
Figure 15: Cross section of S1 and S4 coatings on SiC fibers before: (a) S1, (b) S4, and after oxidation up to 700°C: (c) S1 and (d) S4.
For specimen S4, the thick outer layer appearing in white after oxidation, due to charging effects, was found by EDS to consist of pure B2O3. Only a thin unoxidized BxCyNz layer is visible at the fiber/oxide interface
indicating that the specimen was nearly fully oxidized. The recession in thickness is of approximately 3 m.
The irregular shape of the oxide layer, forming droplets, is characteristic of the formation of large amounts -8 -6 -4 -2 0 2 500 550 600 650 700 750 800 850 2 4 6 8 10 12 14 16 18 T ( °C ) Oxidation time (h) m/ m (% ) T S2 S3 S1 S4
(a)
-50 -40 -30 -20 -10 0 10 500 550 600 650 700 750 800 850 2 4 6 8 10 12 14 16 18 T ( °C ) m/ m (% ) T PyC S2 Oxidation time (h) S3 S1 S4(b)
10µm(a)
(b)
10µm 10µm(c)
10µm(d)
50µmof fluid oxide. The outer surface and the section of S1 after oxidation are in contrast more regular. The
thickness of S1 consumed is only 0.8 m and the B2O3 layer formed is limited to 1.8 m (figure 15),
confirming that the BxCyNz recession and B2O3 growth rates are both reduced compared to S4. The better oxidation resistance of S1 is probably due to its better cristalline state, as evidenced by XRD and TEM analyses (figure 8, 10).
The oxidation kinetics obey a linear law in the range 550 to 700°C for all the coatings and the oxidation rates increase with temperature. In spite of the growth of a B2O3 layer at the surface of the BxCyNz coatings, no parabolic law characteristic of a passive oxidation regime could be observed. This behavior suggests that the process is more likely limited by the BxCyNz/B2O3 interfacial reaction than O2 diffusion through the growing oxide layer. The apparent activation energies of the linear rates fall in the range 90-130 kJ/mole for all BxCyNz coatings, close to the value measured for pyrocarbon in similar conditions (120 kJ/mole). This behavior suggests a common limiting chemical reaction step in both pyrocarbon and BxCyNz oxidation mechanisms. The lower concentration of carbon active sites and the presence of boron atoms inhibiting O2 chemisorption could explain the lower recession rate of BxCyNz compared to pyrocarbon [71, 79].
- 3.4.2 Low temperature (450°C) oxidation in dry air
The very beginning of the oxidation process can be better assessed at low temperature. After oxidation during 15 h in dry air at 450°C, the surface of the oxidized BxCyNz coatings reveals the formation of boron oxide islands, which tend to grow proportionally in size with the initial boron content in the films (figure 16).
Figure 16: Surface of (a) S1, (b) S2, (c) S3 and (d) S4 coatings after oxidation during 15h in dry air at 450°C. The as-deposited coatings are approximately 1µm thick.
- 3.4.3 Low temperature (450-500°C) oxidation in ambient air
(a)
10µm(b)
10µm10µm
The four BxCyNz coatings as well as the reference pyrocarbon film were oxidized under ambient air at both 450°C and 550°C. The water vapor partial pressure in the vicinity of the furnace remained in the range 0.7 to 1kPa during the complete annealing treatments. To determine the recession rate, the thickness of the
coatings (around 5 m for all specimens) was accurately measured by SEM before starting the tests and after
different exposure times.
The oxidation behavior is noticeably different for the various materials even at relatively low water vapor
pressures. The recession rate is indeed higher for the BxCyNz coatings than for the pyrocarbon reference
(figure 17). At 450°C, the pyrocarbon is only very slightly oxidized after 250 h, whereas the BxCyNz coatings are significantly consumed (figure 17a). At 550°C, the oxidation kinetics increase but the difference
in the behavior between BxCyNz and pyrocarbon is less pronounced (figure 17b). It is well known that the
partial pressure of water vapor has a very limited effect on the oxidation of carbon materials [80-81]. On the contrary, as already reported for h-BN [55, 82], the H2O pressure has a strong influence on the oxidation behavior of BxCyNz materials. In presence of moisture, condensed boron oxide is no longer stable but reacts with H2O to form gaseous species such as H3B3O6, H3BO3 and mainly HBO2 above 600°C. The main consequence on the oxidation process, compared to dry air, is the additional contribution of boron oxide species to the weight loss. Cofer et al. [54] have shown that the oxidation of boron nitride in presence of water vapor is directly related to the crystalline state of h-BN. The same apparently holds true for BxCyNz materials since the S1 coating, with high crystallinity, exhibits a better corrosion resistance than the disordered S4.
Figure 17: thickness versus time during the oxidation in ambient air of pyrocarbon and BxCyNz coatings at (a) 450°C and (b) 550°C.
- 3.4.4 Influence of the deposition temperature and post-deposition heat treatments
Cholet et al.1994 [77] have studied the influence of the deposition conditions on the structure and the stability in ambient air of hexagonal boron nitride CVD coating. Besides the effect of pressure, initial gas composition and temperature, they noticed that room temperature oxidation in air could be significantly reduced by heat treatments above the deposition temperature. Surprisingly, similar studies at higher
-4 -3 -2 -1 0 1 0 50 100 150 200 250 300 T hi ck n ess var iat io n ( m) Oxidation time (h) S2 S1 PyC S3 S4 (a) -5 -4 -3 -2 -1 0 0 8 16 24 32 40 48 56 T hi ck n ess var iat io n ( m) Oxidation time (h) S2 S1 PyC S3 S4 (b)
oxidation temperatures are not reported either for h-BN or BxCyNz solid solutions. Since the oxidation of BxCyNz is also expected to vary with its structural state, the influence of both deposition and post deposition heat treatment temperatures of the coatings were examined.
Two additional coatings, referred to as S5 and S6, were deposited at the same pressure and initial gas composition as for S1, but at deposition temperatures of 950°C and 1100°C respectively (the initial deposition temperature being 1025°C). Post deposition heat treatments were carried out at 1250°C and 1400°C at atmospheric pressure under pure flowing nitrogen. The atomic concentration of the resulting coatings is shown in Table 8. The duration of the heat treatment was short (with a heating rate of 5°C/s and a 2 min dwell) to prevent any decomposition of the coating and limit the degradation of the SiC fibers. The first generation Nicalon fibers are indeed susceptible to thermal decomposition leading to a drop of their mechanical properties beyond 1100°C [83]. This effect was carefully examined by submitting uncoated fibers to the same heat treatments and verifying that the failure properties were not altered. The results presented in Table 9 do not reveal any change of the Young’s modulus (E) after heat treatment at 1250°C.
An increase of E is even observed after heat-treatment at 1400°C, possibly due to the growth of -SiC
nanocrystals [83]. In contrast, both tensile failure strength (f) and strain (f) lost 33% of their initial values
after heat treatment at 1250°C. The failure properties decreased even further when the fibers were heat treated at 1400°C, probably owing to the decomposition of the silicon oxycarbide phase [83].
Sample Deposition temperature (°C) Heat treatment temperature (°C) B at.% C at.% N at.% O at.% Si at.% Sample 5 950 none 18.3 8.1 67.4 70.9 13.4 4.5 0.9 16.5 - 0 S5-1250°C 950 1250 18.3 12.2 67.3 74.9 13.7 6 0.7 6.9 - 0 S5-1400°C 950 1400 14.4 14.9 70.3 59.9 14.6 11.2 0.7 5.9 - 8.1 Sample 6 1100 none 20.2 40.7 75.3 46.3 4.4 2.1 0.2 10.9 - 0 S6-1250°C 1100 1250 25.0 32.6 71.9 52.6 3 2.9 0.1 10.6 - 1.4 S6-1400°C 1100 1400 18.3 16.0 78.3 37.1 3.3 12.2 0.1 7.1 - 27.6
Table 8: Influence of deposition and post deposition heat treatment temperatures on the chemical composition of BxCyNz coatings (regular font: bulk, as measured by EPMA, italic: surface, as measured by