HAL Id: inserm-00384935
https://www.hal.inserm.fr/inserm-00384935
Submitted on 17 May 2010
HAL is a multi-disciplinary open access
archive for the deposit and dissemination of
sci-entific research documents, whether they are
pub-lished or not. The documents may come from
teaching and research institutions in France or
abroad, or from public or private research centers.
L’archive ouverte pluridisciplinaire HAL, est
destinée au dépôt et à la diffusion de documents
scientifiques de niveau recherche, publiés ou non,
émanant des établissements d’enseignement et de
recherche français ou étrangers, des laboratoires
publics ou privés.
Influence of pharmacogenetics on indinavir disposition
and short-term response in HIV patients initiating
HAART.
Julie Bertrand, Jean-Marc Treluyer, Xavière Panhard, Agnes Tran, Solange
Auleley, Elisabeth Rey, Dominique Salmon-Céron, Xavier Duval, France
Mentré
To cite this version:
Julie Bertrand, Jean-Marc Treluyer, Xavière Panhard, Agnes Tran, Solange Auleley, et al.. Influence of
pharmacogenetics on indinavir disposition and short-term response in HIV patients initiating HAART..
European Journal of Clinical Pharmacology, Springer Verlag, 2009, 65 (7), pp.667-78.
�10.1007/s00228-009-0660-5�. �inserm-00384935�
European Journal of Clinical Pharmacology manuscript No. (will be inserted by the editor)
Influence of pharmacogenetics on indinavir disposition and
short-term response in HIV patients initiating HAART
Julie Bertrand · Jean-Marc Treluyer · Xavi`erePanhard · Agnes Tran · Solange Auleley ·
Elisabeth Rey · Dominique Salmon-C´eron · Xavier Duval · France Mentr´e · and the COPHAR2-ANRS 111 study group
Received: date / Accepted: date
Abstract Aims To assess the relationship between genetic polymorphisms and indinavir pharmacokinetic variability and to study the link between concentrations and short-term response or metabolic safety. Methods Forty protease inhibitor naive-patients initiating in-dinavir/ritonavir containing HAART and enrolled in the COPHAR 2 - ANRS 111 trial
J. Bertrand (B) · S. Auleley INSERM, U738,
Universit´e Paris Diderot, UFR de M´edecine, 16, rue Henri Huchard
75018 Paris, France Tel.: +33-157277539 Fax: +33-157277521
E-mail: [email protected] JM. Tr´eluyer
AP-HP, Hˆopital Cochin-Saint-Vincent-de-Paul, Service de Pharmacologie Clinique,
EA3620, Universit´e Paris Descartes, Paris, France
X. Panhard · F. Mentr´e INSERM, U738,
Universit´e Paris Diderot, UFR de M´edecine, AP-HP, Hˆopital Bichat, UF de Biostatistiques, Paris, France
A. Tran · E. Rey
AP-HP, Hˆopital Cochin-Saint-Vincent-de-Paul, Service de Pharmacologie Clinique,
Paris, France D. Salmon-C´eron
AP-HP, Hˆopital Cochin-Saint-Vincent-de-Paul, Service de M´edecine Interne,
Paris, France X.Duval INSERM, U738,
Universit´e Paris Diderot, UFR de M´edecine,
AP-HP, Hˆopital Bichat, Centre d’Investigation Clinique, Paris, France
inserm-00384935, version 1 - 17 May 2009
were studied. At week 2, 4 blood samples were taken before and up to 6 hours follow-ing drug intake. A population pharmacokinetic analysis was performed usfollow-ing the Stochastic Approximation Expectation Maximization (SAEM) algorithm implemented in the MONO-LIX software. Indinavir area under the concentration-time curve (AUC), maximal (Cmax)
and trough concentrations (Ctrough) were derived from the population model and tested for
correlation with short-term viral response and safety measurements, while ritonavir AUC,
Cmaxand Ctrough were tested for correlation with short-term biochemical safety. Results A
one-compartment model with first-order absorption and elimination best described both in-dinavir and ritonavir concentrations. For inin-dinavir, the estimated clearance and volume of distribution were 22.2 L/h and 97.3 L respectively. The eight patients *1B/*1B for CYP3A4 gene had an absorption decreased by 70% compared to *1A/*1B or *1A/*1A genotypes (0.5 versus 2.1, P=0.04, likelihood ratio test by permutation). Indinavir AUC and Ctrough
were positively correlated with the HIV RNA decrease between week 0 and week 2 (r=-0.4, P = 0.03 and r=-0.4, P = 0.03, respectively). Patients with the *1B/*1B genotype had sig-nificantly lower indinavir Cmax(median 3.6 [range 2.1 - 5.2] ng/mL versus 4.4 [2.2 - 8.3]
ng/mL, P=0.04) and a lower triglycerides increase during the first 4 weeks of treatment (0.1 [-0.7 - 1.4] versus 0.6 [-0.5 - 1.7] mmol/L, P = 0.02). For ritonavir, the estimated clearance and volume of distribution were 8.3 L/h and 60.7 L respectively and concentrations were not found to be correlated to biochemical safety. Indinavir and ritonavir absorption rate con-stants were found to be correlated, as well as their apparent volumes of distribution and clearances indicating correlated bioavailability of the two drugs. Conclusion CYP3A4*1B polymorphism was found to influence the pharmacokinetics of indinavir and in some extent the biochemical safety of indinavir.
Keywords Pharmacokinetics · Nonlinear Mixed Effects Modeling · Protease inhibitors ·
CYP3A4 · Safety · Efficacy
1 Introduction
Indinavir has been one of the preferred protease inhibitor (PI) included in highly active antiretroviral therapy (HAART). Nowadays, even if not recommended as initial therapy, indinavir is still used in patients who initiated their therapy with this PI and kept a viral load below the limit of quantification with an acceptable safety profile. Further compared to others PI, indinavir exhibits a high penetration into viral reservoirs such as genital com-partments and CNS [1]. It was found that the indinavir better distribution is leading to better outcomes in neurological complications related to HIV [2]. The pharmacokinetics (PK) of indinavir is characterised by high maximal concentrations leading to potential toxicity, no-tably nephrolithiasis [3] and low minimum concentrations with respect to the 95% inhibitory concentration of the virus. These low residual concentrations result from an extended ox-idative metabolism by the cytochrome P450 (CYP3A) isoenzyme [4].The co-administration of ritonavir, whose molecular structure leads to CYP3A inhibition, therefore enhances expo-sure to indinavir [5, 6]. As a booster, ritonavir is given at lower dose than for therapeutic use, but was shown nevertheless to influence metabolic profiles especially with respect to lipids disorders [7, 8].
The large inter-patient and intra-patient variability of indinavir pharmacokinetics is well referenced [9–11]. Genetic polymorphisms could partly explain this variability, as far as proteins involved in the metabolism and transport of PI are concerned. Few studies have investigated the impact on indinavir pharmacokinetics of ABCB1 polymorphisms, a gene
coding for P-glycoprotein, and of CYP3A5 and CYP3A4*1B polymorphisms. Solas et al. [12] have shown that the ABCB1 C3435T genotype affects the absorption constant of indi-navir whereas Verstuyft et al. [13] have reported an absence of association. Anderson et al. [14] have observed that CYP3A5 expressors (CYP3A5*1 carriers) have significantly faster oral clearance than non-expressors. To date no relationship was found between CYP3A4*1B polymorphism and alterations in CYP3A substrate metabolism, but clinical data have shown an association between CYP3A*1B polymorphism and disease risk/treatment toxicity [15].
Efficacy [16, 17] as well as adverse events [18, 3] has been related to indinavir plasma concentrations. Thus, therapeutic drug-monitoring appears to be a potent tool to achieve un-detectable HIV-RNA and prevent toxicity for this drug. The COPHAR 2 - ANRS 111 trial is a multi-centre non-comparative pilot trial of early therapeutic drug-monitoring in HIV-positive patients naive of protease inhibitor containing highly active antiretroviral treatment (HAART) [19]. We focused on the PK sub-study from the group of patients receiving in-dinavir boosted with ritonavir. The aims of this paper were to estimate the population PK parameters and variability of indinavir and ritonavir in HIV patients, to evaluate the impact of genetic polymorphisms on indinavir PK and to study the link between indinavir concen-trations and short-term efficacy and metabolic safety.
2 Methods 2.1 Study
The COPHAR 2 - ANRS 111 study is a multi-centre non-comparative prospective pilot trial of early-dose adaptation in HIV-positive patients naive of protease inhibitors (PI) starting a PI containing HAART treatment. The trial started on July 2002 and was completed by the end of March 2005. The objective was to assess the benefit of pharmacological advice based on trough plasma concentrations of PI. The study involved three groups treated with indi-navir, nelfinavir or lopinavir respectively. In the present study we analysed the data obtained during the first month of treatment in the indinavir group. A similar analysis of the data in the nelfinavir group was performed by Hirt et al [20, 19], details of the study can be found in that paper.
Patients were required to have a baseline plasma viral load value> 1000 copies/mL,
and to be na¨ıve of treatment with protease inhibitor. Patients initiated a HAART treatment containing 400, 600 or 800 mg of indinavir b.i.d. associated with ritonavir booster (100 mg b.i.d.) and two nucleoside analogues. The first dose was left to physicians’ discretion and no dose adaptation was performed from week 0 (W0) to W4. A detailed pharmacokinetic study was performed at W2. Adherence was evaluated at W2 by means of a validated auto-questionnaire [21] and patients were classified as adherent when reporting no shift in their treatment schedule during the last 4 days and non-adherent otherwise.
Viral load and CD4 count were collected at baseline (D0) and at W2. Biochemical pro-files of total cholesterol, high density lipoprotein cholesterol, triglyceride and glycaemia as well as creatinine clearance and clinical events (diarrhoea grade of 2) were collected 4 weeks before treatment initiation (W-4) and at W4.
The study was performed in accordance with the Declaration of Helsinki and its amend-ments. All subjects gave written informed consent and the protocol was approved by the Ethic Committee of the Bicˆetre Hospital (France) as well as the amendment for the pharma-cogenetic study.
2.2 Indinavir and ritonavir concentration measurements
During a visit to the hospital at W2, the patients were sampled on arrival to measure trough concentrations. Patients were asked to record the time at which the dose was taken on the previous evening. Then they were given their medications, and sampled again 1 h, 3 h and 6 h after drug administration. Plasma concentrations were assumed at steady state with trough concentrations considered as following the drug intake using the delay reported by the pa-tient from previous dosing. Plasma concentrations were determined in the laboratories of the hospitals by specific high-performance liquid chromatography. The participant labora-tories were cross-validated before starting the study. Results of the blind inter-laboratory quality control at three concentrations for indinavir and for ritonavir were within 15% of the target values for medium and high values and within 20% for low values. Lower limits of quantification (LOQ) were 0.02 mg/L for indinavir and 0.025 mg/L for ritonavir.
2.3 Genetic polymorphisms
All the genotyping analyses were performed in the same laboratory. Total deoxyribonucleic acid (DNA) was extracted from plasma samples by use of the QIAamp DNA Blood Mini Kit (Qiagen, Courtaboeuf, France). ABCB1 polymorphisms in exons 21 (GG, GT, TT) and 26 (CC, CT, TT) were determined by use of previously-published methods [22]. Genotyp-ing of CYP3A5 (*1*1, *1*3, *3*3, *1*6, *6*6) was performed by real-time polymerase chain reaction by use of TaqMan MGB probe technology (Applied Biosystems). Genotyp-ing for CYP3A4 (*1B*1B, *1B*1A, *1A*1A) was determined by polymerase chain reaction (PCR) followed by direct sequencing. PCR was performed by use of a GenAmp PCR Sys-tem 9700 (Applied BiosysSys-tems, Courtaboeuf, France) according to a previously-published method [23]. Amplified DNA was purified by use of the QiaQuick DNA Purification System (Qiagen) and sequenced by use of BigDye Terminator chemistry and an ABI PRISM 3100 genetic analyser (Applied Biosystems). For each genotyping analysis, at least 2 positive controls were used: 1 homozygous for the wild-type allele and 1 heterozygous and, when available, 1 homozygous for the mutated allele. These controls were DNA that had already been sequenced.
Allele frequencies (p for the wild allele and q = 1 - p for the mutant allele) were estimated by gene counting. Departure from Hardy-Weinberg proportions (p2, 2pq, q2) was tested by aχ2test with 1 degree of freedom within each ethnic group [24]. We used two approaches
to define patients belonging to an ethnic group: i. classification on the patient town, birth area and nationality and ii. classification by means of their genotype information using the Structure software [25]. This software is based on a Bayesian approach and computes a posteriori probabilities for each individual of belonging to a given ethnic group. We assumed each locus to be at the Hardy-Weinberg equilibrium and patients to originate in one ethnic group (with its own characteristic set of allele frequencies).
2.4 Population pharmacokinetic analysis
We used a population approach to analyse the concentration-time data at W2 for indinavir and for ritonavir separately. Model fitting and estimation of the population model param-eters were performed by use of the Stochastic Approximation Expectation Maximization
algorithm (SAEM) for nonlinear mixed-effects models implemented in the MONOLIX soft-ware version 2.1 [26–28]. Both indinavir and ritonavir concentrations were fitted by a one-compartment model with first-order absorption and first-order elimination parameterised in absorption rate constant (ka), oral clearance (Cl/F) and oral volume of distribution (V /F).
Each model was assumed at steady state with trough concentrations considered as following the drug intake.
An exponential model was used for inter-individual variability where random effects were assumed to follow a normal distribution with zero mean and diagonal variance ma-trix. Additive, proportional and combined error models were tested and model choice was based on the likelihood ratio test (LRT) and goodness-of-fit plots (observed vs. predicted population and individual concentrations, population and individual weighted residuals vs. predicted concentrations and vs. time). We performed a visual predictive check (VPC) with 1000 simulated data sets to evaluate the basic model [29].
Interaction between ritonavir and indinavir pharmacokinetics was evaluated with the individual parameters estimated from the basic model for each drug. All the different corre-lations were tested with the Spearman non-parametric correlation test.
2.5 Assessment of the effect of covariates
The effects of the following covariates were evaluated from the basic model: dose, concomi-tant use of the zidovudine lamivudine combination (AZT/3TC), co-infection by hepatitis C or B (VHC/VHB), adherence as previously defined, sex, ethnic group, the four studied ge-netic polymorphisms (ABCB1 exon 26, ABCB1 exon 21, CYP3A5 and CYP3A4) and the CDC classification for HIV infection as categorical variables, age, body mass index (BMI), body weight, creatinine clearance, albumin and orosomucoid levels as continous variables. The latter were centered to the median and log-transformed for model interpretation conve-nience.
Each of the four genetic polymorphisms was analysed by means of two binary categori-sations: first, wild homozygotes versus heterozygotes or mutant homozygotes, second, het-erozygotes or wild homozygotes versus mutant homozygotes. Categorisation in three classes was also tested: wild homozygotes versus heterozygotes versus mutant homozygotes. Miss-ing continuous covariates were replaced with the median and patients with missMiss-ing dicrete covariates were discarded for the corresponding analysis. The effects of covariates on the empirical Bayes estimates (EBE) of each individual pharmacokinetic parameters from the basic model were tested with the Wilcoxon non-parametric test for categorical variables and the Spearman non-parametric correlation test for continuous variables. The population co-variate model was built with the coco-variates which were found to have an effect in this first step with a P-value< 0.1. When a genetic covariate was found to have an effect whatever
the categorisation, the same categorisation as other genetic covariates also found to have an effect was chosen in model selection for consistency.
A forward selection of these covariates for the population model was performed by use of the likelihood ratio test (LRT) with a significance threshold at P< 0.05. From this
as-cending method, a backward elimination procedure was performed. In order to correct the inflation of the LRT type I error on small sample size [30], the backward selection was realized using permutation [31]. More specifically, 1000 data sets are generated by permut-ing the rows of the covariates matrix from the original data set. For each covariate, one likelihood ratio statistic LRTobsis estimated from the original data and one likelihood ratio
statistic LRTpermis estimated from each of the 1000 data sets. Thus, we obtain j=1,...,1000
LRTpermj. The permutation P-value is the proportion : card(LRTpermj> LRTobs)/1000.
2.6 Short-term efficacy and safety and link with concentrations
As there was no change of dose before W4, we studied the link between concentration at W2 and efficacy or safety during the first two or four weeks of treatment. For short-term efficacy, the difference of log viral load between the day of treatment initiation and W2
(∆logV L) was studied. The significance of the viral load decrease was tested by a Wilcoxon
non-parametric paired test.
Individual area under the concentration-time curve (AUC), maximal plasma concentra-tions (Cmax) and trough concentrations (Ctrough) of indinavir at steady-state were derived for
each patient by use of the EBE of the individual parameters from the basic model and their corresponding dose of indinavir. The relationship between indinavir dose, indinavir AUC,
Cmax, Ctroughand∆logV L was evaluated by use of the Spearman correlation test. A Wilcoxon
non-parametric test was performed to compare∆logV L between patients with or without a Ctroughbelow the lower limit of the therapeutic range used in the COPHAR 2 - ANRS 111
trial: 150 ng/mL.
Safety was analysed through the difference between 4 weeks before and 4 weeks after treatment initiation in total cholesterol (∆TC), high density lipoprotein cholesterol (∆HDL),
triglyceride (∆trig) and glycaemia (∆gly) and also through appearance of diarrhoea (grade
2) between treatment initiation and W4. To our knowledge, no precocious biological markers exist for nephrolithiasis, however creatinine clearance has been found to relate to occurence of severe adverse events (including nephrolithiasis) in a multivariate analysis [3]. Thus, we also analysed the difference in creatinine clearance (∆ClCr), computed with the
Cockcroft-Gault formula using body weigth and serum creatinine 4 weeks before and 4 weeks after treatment initiation. The significance of these differences was tested by use of a Wilcoxon non-parametric paired test.
We performed Spearman correlation tests between indinavir dose, indinavir AUC, Cmax,
Ctroughand∆TC,∆HDL,∆trig,∆gly and∆ClCr. We used Wilcoxon non-parametric tests
to compare these differences between patients with or without an indinavir Ctroughover the
upper limit defined in the therapeutic index (550 ng/mL). We studied the link between the appearance of grade 2 diarrhoea (yes/no) between treatment initiation and W4 and indinavir dose, indinavir AUC, Cmax, Ctroughusing a Wilcoxon non-parametric test and we studied the
association with or without an indinavir Ctrough> 550 ng/mL using a Fisher exact test.
We assessed the relation between the genetic polymorphisms remaining in the final population model and indinavir dose, indinavir AUC, Cmax, Ctrough and the relation
be-tween these genetic polymorphisms and the short-term efficacy and safety outcomes using Wilcoxon non-parametric tests.
We also derived AUC, Cmax, Ctrough for ritonavir and performed Spearman correlation
tests with∆TC,∆HDL,∆trig,∆gly and∆ClCr as well as Wilcoxon non-parametric tests
on appearance of grade 2 diarrhoea.
3 Results 3.1 Patients
Forty-two patients were included in this treatment group of the COPHAR 2 ANRS - 111 trial, one patient withdrew from the study and one switched to another protease inhibitor during the first week of treatment. We therefore obtained pharmacokinetic data from 40 patients (27 men, 13 women) with a median age of 36.5 years (20.0 - 59.0). Table 1 describes the main characteristics of the 40 studied patients.
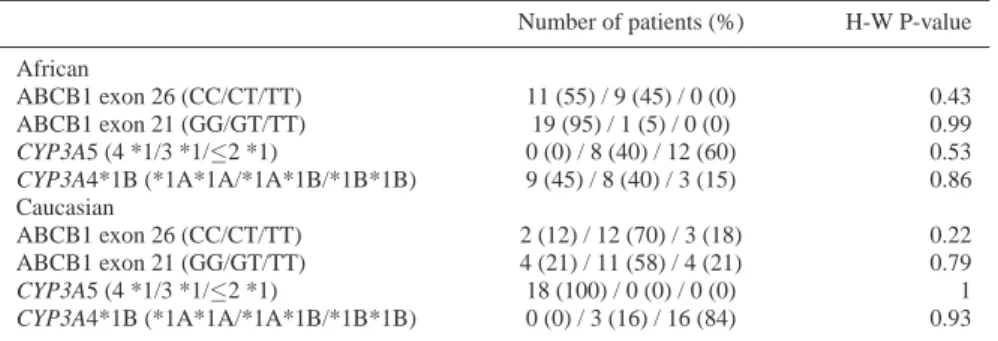
Both approaches to allocate the ethnic group provided corroborating results. Using the civic information we allocated 20 patients to the African group and 20 to the Caucasian group. Given that one patient had missing information for all genotypes, the Structure soft-ware allocated 19 patients to the Caucasian group and 20 to the African group. In the result-ing two ethnic groups, Hardy-Weinberg proportions were respected for all polymorphisms under study as shown in Table 2.
3.2 Indinavir pharmacokinetics
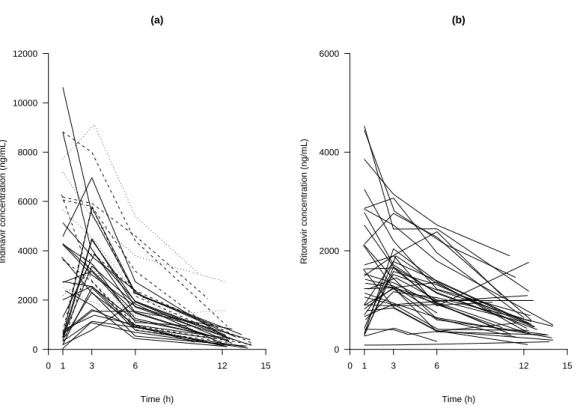
For two patients, two samples were missing, the trough and the 6 h concentrations and only the trough concentration was available for another. Among the 155 samples, two indinavir plasma concentrations in one patient were below the limit of quantification (at 1 h and at trough) and were discarded from the analysis. Figure 1a displays indinavir plasma concen-trations at W2 versus time. It shows that there is a high inter-individual variability.
The best error model was a proportional error model. The population estimates are dis-played in Table 3. All the relative standard errors (RSE) were below 25% with the exception of kaandωV/F(around 30 and 60% respectively). The inter-individual variance of kain this
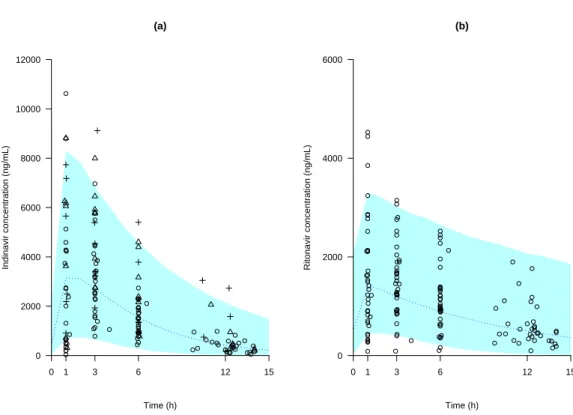
study was rather important (above 100%). The simulated median and the 90thinterval are displayed in Figure 2a together with all the observed concentrations of indinavir. This graph shows good evidence of the adequacy of the model.
From that basic model, we first tested the effects of the covariates on the individual parameters estimates. Effects of age (P = 0.03) and ABCB1 exon 26 polymorphism (P=0.09) on Cl/F and of CDC classification (P = 0.09) and CYP3A4*1B polymorphism (P = 0.09) on ka were found. Both ABCB1 exon 26 and CYP3A4*1B polymorphism variables were
dichotomised in mutant homozygotes versus other genotypes. After the forward selection based on LRT, the population model had CYP3A4 effect on ka (P = 0.02) and age effect
on Cl/F (P = 0.03). The age effect on clearance was withdrawn from the model after the backward selection based on permutation test. In the final model, Absorption rate constant was decreased by 70% (P = 0.04, LRT by permutation) in patients *1B*1B for the CYP3A4 allele:
ka= 2.1×e−1.3×CYP3A4with
(
CYP3A4=0 for patients CYP3A4*1A*1A or CYP3A4*1A*1B CYP3A4=1 for patients CYP3A4*1B*1B
The population parameters of this final model and their RSE are given in Table 3 for the thirty-eight patients with available genotyping for CYP3A4*1B polymorphism. The inter-individual variability for kadecreased by 27% from the basic model with the incorporation
of the covariate and residual variability was 44.7%.
Time (h) Indinavir concentration (ng/mL) 0 2000 4000 6000 8000 10000 12000 0 1 3 6 12 15 (a) Time (h) Ritonavir concentration (ng/mL) 0 2000 4000 6000 0 1 3 6 12 15 (b)
Fig. 1 Observed plasma indinavir concentration (a) and plasma ritonavir concentration (b) versus time col-lected two weeks after treatment initiation, in 40 HIV naive-patients receiving indinavir plus 100 mg of ritonavir b.i.d. In the indinavir plot the plain lines correspond to an indinavir dose of 400 mg b.i.d., the dashed lines to 600 mg b.i.d. and the dotted lines to 800 mg b.i.d. Sampling times following drug administration were measured by the nurse. Concentrations were assumed at steady state, trough concentrations are displayed as following the drug intake at sampling times deduced from the patient record.
3.3 Ritonavir pharmacokinetics
One patient who had indinavir concentrations had no concentration for ritonavir, so we only analysed ritonavir data for 39 patients. The same 5 samples for indinavir mentioned in the preceding paragraph were also missing. Among the 151 samples, two ritonavir plasma con-centrations at 1 h and at trough in one patient and one concentration at 12 h in another patient were below the limit of quantification and were discarded. Observed plasma concentrations are displayed in Figure 1b, and it should be noticed that some patients exhibited high plasma concentrations (above 2000 ng/mL) for a dose of 100 mg b.i.d.
A proportional error model was selected. The population estimates are displayed in Ta-ble 4. All the RSE were below 25% with the exception of ka, partly attributable to the sparse
design, andωCl/Fas observed for the indinavir data. The VPC obtained with the basic model
parameters estimates is displayed in Figure 2b, together with the observed concentrations. The results of the basic model evaluation were very satisfactory.
Effects of orosomucoid (P=0.03), albumin levels (P=0.04) and CYP3A5 polymorphism (patients with 2 wild alleles at most vs other genotypes, P = 0.04) on Cl/F were found on the individual parameters by use of non-parametric tests as well as effects of HIV disease status
(a) Time (h) Indinavir concentration (ng/mL) 0 2000 4000 6000 8000 10000 12000 0 1 3 6 12 15 (b) Time (h) Ritonavir concentration (ng/mL) 0 2000 4000 6000 0 1 3 6 12 15
Fig. 2 Visual predictive check of the basic population PK model: comparison between the median (continued line) and the 90thinterval (colored area) predicted for 1000 simulated datasets and the observed concentra-tions of indinavir (a) and of ritonavir (b). In the indinavir plot the open circles correspond to an indinavir dose of 400 mg, the open triangles to 600 mg and the crosses to 800 mg
(P = 0.05) on kaand creatinine clearance (P = 0.1) on V/F. In the final model, an increase of
0.5 g/L in orosomucoid from the median (1 g/L) was associated with a clearance decrease of 28% (P=0.03, LRT by permutation):
Cl/F = 8.3 × Orosomucoid−0.8
The population parameters of this model and their RSE are given in Table 4.
3.4 Link between indinavir and ritonavir PK parameters
Four positive correlations between individual parameters of ritonavir and indinavir were found significant. There was a relationship between indinavir and ritonavir absorption rate constant (r = 0.4, P = 0.005). Indinavir clearance was strongly correlated to ritonavir clear-ance (r = 0.6, P< 0.0001) and to a smaller degree to ritonavir volume of distribution (r = 0.4, P< 0.01), while indinavir volume of distribution was highly correlated to ritonavir volume
of distribution (r = 0.5, P< 0.002).
Indinavir AUC (ng.h/mL)
∆
logVL (log copies/mL)
−3.0 −2.5 −2.0 −1.5 −1.0 −0.5 0.0 10 20 30 40 50 60 (a) Indinavir Ctrough (ng/mL) ∆
logVL (log copies/mL)
−3.0 −2.5 −2.0 −1.5 −1.0 −0.5 0.0 0.0 0.5 1.0 1.5 2.0 (b)
Fig. 3 Differences in log viral load (∆logVL) observed between treatment initiation and week 2 versus area under the concentration-time curve (a) and trough plasma concentration of indinavir (b) predicted by the model
3.5 Concentrations link with short-term efficacy and safety
There was a significant decrease in viral load in the first two weeks of treatment and a significant increase in total cholesterol, glycaemia and triglycerides in the first four weeks of treatment, as shown in Table 5.
The decrease in log viral load was significantly associated with higher indinavir AUC (r = -0.4, P = 0.03) and Ctrough (r = -0.4, P = 0.03), as shown in Figure 3. No significant
difference in viral load decrease was found between the five patients with a Ctrough below
the lower limit of the therapeutic range and the thirty five patients with a Ctroughabove this
value.
Further, no significant relationship was found between indinavir nor ritonavir concen-trations and safety measurements or grade 2 diarrhoea. No nephrolithiasis has been reported in the COPHAR 2 - ANRS 111 trial, which has prevented us to analyze the link between concentrations and this adverse event associated with indinavir.
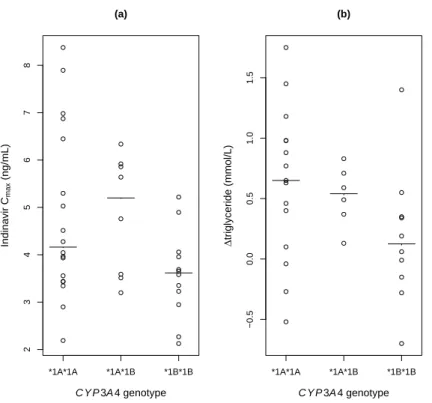
The genetic covariate kept in the final population pharmacokinetic model was the CYP3A4*1B polymorphism categorised in 2 classes: *1B*1B versus other genotypes. Both Cmax and
triglycerides increase were found to be significantly associated with the CYP3A4*1B poly-morphism, althought not significantly correlated. In patients’ homozygotes for the *1B al-lele, Cmaxwas significantly lower (median 3.6 [range 2.2 - 5.2] ng/mL compared with the
other groups 4.4 [2.2 - 8.3] ng/mL, P=0.04) and the increase in triglycerides was also
*1A*1A *1A*1B *1B*1B 2 3 4 5 6 7 8 C Y P 3A 4 genotype Indinavir Cmax (ng/mL) (a) *1A*1A *1A*1B *1B*1B −0.5 0.0 0.5 1.0 1.5 C Y P 3A 4 genotype ∆ triglyceride (mmol/L) (b)
Fig. 4 Peak indinavir concentrations predicted by the model (a) and differences in triglycerides (∆triglyceride) 4 weeks before and after treatment initiation (b) versus CYP3A4 genotype. The solid-line represents the median in each group
nificantly smaller (0.1 [-0.7 - 1.4] mmol/L versus 0.6 [-0.5 - 1.7] mmol/L, P=0.02), as illus-trated by Figure 4. Regarding the efficacy, no significant association was found between the
CYP3A4*1B*1B genotype and the Ctroughor the log viral decrease.
The various doses of indinavir were not found to be associated with the CYP3A4*1B polymorphism, short-term efficacy or safety, which dismissed its potential confounding ef-fect.
4 Discussion
The pharmacokinetics of indinavir was analysed by use of a one compartment model with first-order absorption and elimination at steady-state. The estimated clearance and volume of distribution were 22.2 L/h and 97.3 L respectively, both in the range of those obtained in previous studies [9, 11, 32]. In this study, the ABCB1 exon 26 and 21 and the CYP3A5*3 and *6 polymorphisms were not found to significantly influence the pharmacokinetics of indinavir. Whereas, the absorption rate was 0.6 h−1for CYP3A4*1B*1B patients and 2.1
h−1for CYP3A4*1A*1A or CYP3A4*1A*1B patients. The CYP3A enzymes are distributed
in both hepatocytes and enterocytes [33] and their inhibition by ritonavir is well-documented [34–36]. In vivo, the genotype-phenotype correlation for CYP3A4*1B remains a subject of debate [37–40], however CYP3A4*1B has been related to increased transcription [41] in
vitro. We hypothesised that in CYP3A4*1B*1B patients the ritonavir inhibition potency is lowered, which leads to higher first pass effect of indinavir although it does not impact on its clearance. The potential confounding effect of the ethnic group has been discarded, as this covariate was not significantly related to indinavir individual parameters in the sample. Still, this finding is more relevant clinically in an african population given the extremely low frequency of the CYP3A4*1B*1B genotype among caucasian. The primary objective of the COPHAR2 study was not to assess the influence of genetic polymorphisms on indinavir pharmacokinetics, and the use of modelling has helped to circumvent the limited sample size of forty patients. In addition, most of the tests in this study were performed at an exploratory step and final inclusion in the model was based on permutation to cope with departure from the asymptotic assumption [30]. No evidence for a gender effect was found as reported in some other studies on indinavir PK [9–11] but there were only thirteen women in the present study. The dose was not found to influence the pharmacokinetics of indinavir and using ritonavir as a boost hides dose non linearity of indinavir [42]. We did not assess the impact of the diet, as these data were not available, but patients were recommended to ingest the pills with food containing a sufficient amount of fats.
We also performed a population pharmacokinetic analysis of ritonavir concentrations. Ritonavir profiles were adequately described by a one compartment model with first order absorption and elimination processes, with estimates of the parameters in good agreement with previous studies [6, 43, 44]. The estimated inter-individual variance for the absorption constant was singularly large. We found a negative relationship between ritonavir clearance and the orosomucoid level in plasma. The affinity of ritonavir for orosomucoid protein as well as its impact on PI intracellular concentrations and efficacy has been described in both in vitro and in vivo studies [45–47]. In patients with high orosomucoid plasma level, the decrease in unbound fraction of ritonavir led to a lower clearance.
In the analysis of both protease inhibitors, the few concentrations (1.3% and 2% for indinavir and ritonavir, respectively) below the limit of quantification were discarded. This approach has been shown to provide using SAEM a less important bias than to set those to LOQ/2 [48] and in MONOLIX 2.1, no proper method to handle LOQ was implemented.
In the analysis of the link between indinavir and ritonavir concentrations, we chose not to include ritonavir as a covariate in the indinavir model, as performed in previous studies [10, 11]. Indeed, such parameterisation assumes unidirectional influence of ritonavir on in-dinavir which is not true. Ritonavir concentrations when ritonavir is given with lopinavir are lower than when ritonavir is given with indinavir [44]. We have instead underlined the different levels of interaction between indinavir and ritonavir PK, especially at the absorp-tion step, with the strong correlaabsorp-tion between their absorpabsorp-tion constant, but also in terms of bioavailability as the oral clearances and volumes of distribution were highly correlated. In order to properly model such an interaction between PI, a joint population analysis of concentrations of indinavir and ritonavir should be considered with correlated absorption constants and bioavailabilities.
We observed significant changes in viral load after two weeks of treatment and we con-firmed the association between high indinavir trough and mean concentrations and a greater decrease of viral load, which has already been described in PI naive patients [49–51]. We did not find any relationship between CYP3A4*1B polymorphism and viral load decrease. We also observed a significant increase, after four weeks of treatment, of total cholesterol, glycaemia and triglycerides, as already reported [52], which was, however, not significantly related to indinavir concentrations at week 2. Ritonavir was found in singularly high levels in the study and is known to affect metabolic profiles, yet we have found no evidence of an association between ritonavir levels and safety measurements. In patients’ homozygotes
for the CYP3A4*1B allele, the ritonavir-decreased inhibition on indinavir metabolism led to significantly lower indinavir Cmaxand appeared to impact at a metabolic level trough a
significantly lower increase in triglycerides in these patients.
5 Conclusion
We developed and validated models for indinavir and ritonavir PK with reduced sampling in indinavir HAART patients. Both the average and through concentrations were found to be predictor of the viral load decline. Only the CYP3A4*1B allele was found to influence indinavir absorption and biochemical safety, but no evidence was found of an impact of the five genetic polymorphisms under study on indinavir efficacy.
Acknowledgements Steering committee of COPHAR2 ANRS-111 trial: principal investigators: D. Salmon-C´eron, X. Duval, statistics: F. Mentr´e; other members: S. Auleley, M. Biour, M.J. Commoy, B. Diquet, C. Goujard, C. Katlama, C. Lascoux, M. Legrand, A. M´etro, G. Peytavin, E. Rey, A.M. Taburet, J.M. Tr´eluyer.
Safety committee: S. Auleley, M. Biour, A. M´etro, C. Lascoux, D. Salmon-C´eron. Pharmacological monitoring committee: X. Duval, E. Rey, J.M. Tr´eluyer. Independent committee: C. Rouzioux, C. Piketti, P. Flandre, M. Zenut, P. Marquet.
Clinical centers: Dr. Bentata, Dr. Mansouri, Mme Touam, Pr. Sereni, Dr. Lascoux, Dr. Pintado, Dr. Gou-jard, Mme Mole, Dr. Sellier, Dr. Bendenoun, Dr. Rami, Mme Parrinello, Dr. Jeantils, Mme Tassi, Pr. Vittecoq, Dr. Teicher, Mme Mallet, Pr. Dupont, Dr. Lahoulou, Soeur Azar, Pr. Rosembaum, Dr. Slama, Dr. Na¨ı-Ighil Baakili, Dr. Courtial-Destembert, Pr. Vild´e, Pr. Leport, Dr. Duval, Dr. Al Kaied, Pr. Salmon, Dr. Spiridon, Dr. Lesprit, Mme Chesnel, Pr. Katlama, Dr. Schneider, Mme Schoen, Pr. Molina, Dr. Ponscarme, Dr. Colin de verdi`ere, Pr. Morlat, Dr. Bonarek, Dr. Joly, Dr. Ralaimazava, Mme Meridda, Mme Le Gac, P. Raffi, Dr. Allavena, Mme H¨ue, Mme Sicot, Dr. Perr´e, Dr. Leautez, Dr. Aubry, Mme Suaud, Pr. Dellamonica, Dr. Rahe-linirina, Pr. Michelet, Dr. Bouvier, Pr. Bazin, Dr. Goubin, Pr. May, Dr. Boyer, Pr. Rouveix, Dr. Dupont, Mme Berth´e.
Pharmacological centers: Dr. Rey, Pr. Tr´eluyer, Dr. Abbara, Dr. Audoul, Dr. Tran, Dr. Sauvageon, Dr. Poirier, Dr. Taburet, Dr. Vincent, Dr. Aymard, Dr. Peytavin, Dr. Lamotte, Dr. Dailly, Dr. Garraffo, Dr. Lavrut, Dr. Mollimard, Dr. Titier, Dr. Tribut, Dr. Hulin, Dr. Huet, Dr. Delhotal, Dr. Hoizey.
Virological centers: Pr. Nicolas-Chanoine, Dr. Sousan, Pr. D´eny, Dr. Baazia, Dr. Alloui, Pr. Brun-V´ezinet, Dr. Chams, Pr. Fleury, Dr. Pellegrin, Dr. Garrigue, Pr. Fremut, Dr. Vabret, Pr. Lebon, Dr. Krivine, Pr. Calvez, Dr. Gourlain, Dr. Amellal, Pr. Bouvier-Alias, Pr. Norman, Dr. Idri, Pr. Chambreuil, Dr. Poirier, Pr. Mazeron, Pr. Le Faou, Dr. V´enard, Pr. Billaudel, Dr. Ferre, Pr. Rouzioux, Dr. Burgard, Pr. Lefevre, Dr. Cottalorda, Pr. Dussaix, Dr. Bensidhoum, Pr. Colimon, Dr. Ruffault, Dr. Maillard, Pr. Morinet, Dr. Palmer, Pr. Nicolas, Dr. Zalta.
Monitoring: S. Auleley, E. Marcault, F. Mentr´e. Statistics: E. Bougen, F. Mentr´e, X. Panhard.
The authors thank the study participants and the Agence de Recherche Nationale sur le SIDA (ANRS, Essai 111) for financial support.
We also acknowledge Dr. Emmanuelle Comets, Pr. Marc Lavielle and Dr. Emmanuelle G´enin for the precious advices they provided along the analysis.
During this analysis J. Bertrand was supported by a grant from Servier Research Group, France.
References
1. Solas C, Lafeuillade A, Halfon P et al. (2003) Discrepancies between protease inhibitor concentrations and viral load in reservoirs and sanctuary sites in human immunodeficiency virus-infected patients. An-timicrob Agents Chemother 47:238–43
2. Letendre S, Marquie-Beck J, Capparelli E et al. (2008) Validation of the CNS penetration-effectiveness rank for quantifying antiretroviral penetration into the central nervous system. Arch Neurol 65:65–70 3. Collin F, Chˆene G, Retout S et al. (2007) Indinavir trough concentration as a determinant of early
nephrolithiasis in HIV-1-infected adults. Ther Drug Monit 29:164–70 4. Flexner C (1998) HIV-protease inhibitors. N Engl J Med 338:1281–92
5. Von Moltke LL, Greenblatt DJ, Grassi JM et al. (1998) Protease inhibitors as inhibitors of human cy-tochromes P450: high risk associated with ritonavir. J Clin Pharmacol 38:106–11
6. Hsu A, Granneman GR , Bertz RJ (1998) Ritonavir. Clinical pharmacokinetics and interactions with other anti-HIV agents. Clin Pharmacokinet 35:275–91
7. Soriano V, Garcya-Gasco P, EVispo et al. (2008) Efficacy and safety of replacing lopinavir with atazanavir in HIV-infected patients with undetectable plasma viraemia: final results of the SLOAT trial. J Antimicrob Chemother 61:200–05
8. Collot-Teixeira S, De Lorenzo F, Waters L et al. (2009) Impact of different low-dose ritonavir regimens on lipids, CD36, and adipophilin expression. Clin Pharmacol Ther 375-8:85
9. Csajka C, Marzolini C, Fattinger K et al. Population pharmacokinetics of indinavir in patients infected with human immunodeficiency virus. Antimicrob Agents Chemother 48:3226–32
10. Brendel K, Legrand M, Taburet A et al. (2005) Population pharmacokinetic analysis of indinavir in hiv-infected patient treated with a stable antiretroviral therapy. Fundam Clin Pharmacol 19:373–83 11. Kappelhoff BS, Huitema ADR, Sankatsing SUC et al. (2005) Population pharmacokinetics of indinavir
alone and in combination with ritonavir in HIV-1-infected patients. Br J Clin Pharmacol 60:276–86 12. Solas C, Simon N, Drogoul MP et al. (2007) Minimal effect of MDR1 and CYP3A5 genetic
polymor-phisms on the pharmacokinetics of indinavir in HIV-infected patients. Br J Clin Pharmacol 64:353–62 13. Verstuyft C, Marcellin F, Morand-Joubert L et al. (2005) Absence of association between MDR1 genetic
polymorphisms, indinavir pharmacokinetics and response to highly active antiretroviral therapy. AIDS 19:2127–31
14. Anderson PL, Lamba J, Aquilante CL et al. (2006) Pharmacogenetic characteristics of indinavir, zi-dovudine, and lamivudine therapy in HIV-infected adults: a pilot study. J Acquir Immune Defic Syndr 42:441–49
15. Lamba JK, Lin YS, Schuetz EG et al. (2002) Genetic contribution to variable human CYP3A-mediated metabolism. Adv Drug Deliver Rev 54:1271–94
16. Lichterfeld M, Nischalke HD, Bergmann F et al. (2002) Long-term efficacy and safety of riton-avir/indinavir at 400/400 mg twice a day in combination with two nucleoside reverse transcriptase in-hibitors as first line antiretroviral therapy. HIV Med 3:37–43
17. Duval X, Mentre F, Lamotte C et al. (2005) Indinavir plasma concentration and adherence score are codeterminant of early virologic response in HIV-infected patients of the APROCO cohort. Ther Drug Monit 27:63–70
18. Dieleman JP, Gyssens IC, van der Ende ME et al. (1999) Urological complaints in relation to indinavir plasma concentrations in HIV-infected patients. AIDS 13:473–78
19. Duval X, Mentr´e F, Rey E et al. (2008) Benefit of therapeutic drug monitoring of protease inhibitors in HIV-infected patients depends on PI used in HAART regimen - anrs 111 trial. Fundam Clin Pharmacol in press
20. Hirt D, Mentr´e F, Tran A et al. (2008) Effect of CYP2C19 polymorphism on nelfinavir to M8 biotrans-formation in HIV patients. Br J Clin Pharmacol 65:548–57
21. Carrieri P, Cailleton V, Le Moing V et al. (2001) The dynamic of adherence to highly active antiretroviral therapy: results from the french national APROCO Cohort. J Acq Immun Def Synd 28:232–39 22. Cascorbi I, Gerloff T, Johne A et al. (2001) Frequency of single nucleotide polymorphisms in the
P-glycoprotein drug transporter MDR1 gene in white subjects. Clin Pharmacol Ther 69:169–74
23. Dally H, Edler L, Jager B et al. (2003) The CYP3A4*1B allele increases risk for small cell lung cancer: effect of gender and smoking dose. Pharmacogenetics 13:607–18
24. Crow J (1999) Hardy, Weinberg and language impediments. Genetics 152:821–25
25. Pritchard J, Stephens M , Donnelly P (2000) Inference of population structure using multilocus genotype data. Genetics 155:945–59
26. Kuhn E , Lavielle M (2005) Maximum likelihood estimation in nonlinear mixed effects models. Comput Stat Data Anal 49:1020–38
27. Lavielle M (2008) MONOLIX (MOd`eles NOn LIn´eaires `a effets miXtes). MONOLIX group, Orsay, France. http://software.monolix.org/index.php
28. Lavielle M , Mentr´e F (2007) Estimation of population pharmacokinetic parameters of saquinavir in HIV patients with the MONOLIX software. J Pharmacokinet Pharmacodyn 34:229–49
29. Gelman A, Carlin JB, Stern HS et al. (1995) Bayesian data analysis. Chapman & Hall, London 30. Bertrand J, Comets E , Mentr´e F (2008) Comparison of model-based tests and selection strategies to
detect genetic polymorphisms influencing pharmacokinetic parameters. J Biopharm Stat 18:1084–102 31. Manly B (1998) Randomization, bootstrap and monte carlo methods in biology. Chapman & Hall,
Lon-don
32. Goujard C, Legrand M, Panhard X et al. (2005) High variability of indinavir and nelfinavir pharma-cokinetics in HIV-infected patients with a sustained virological response on highly active antiretroviral therapy. Clin Pharmacokinet 44:1267–78
33. Fuhr U, Jetter A , Kirchheiner J (2007) Appropriate phenotyping procedures for drug metabolizing en-zymes and transporters in humans and their simultaneous use in the “cocktail” approach. Clin Pharmacol Ther 81:270–83
34. Ikezoe T, Hisatake Y, Takeuchi T et al. (2004) HIV-1 protease inhibitor, ritonavir: a potent inhibitor of CYP3A4, enhanced the anticancer effects of docetaxel in androgen-independent prostate cancer cells in vitro and in vivo. Cancer Res 64:7426–31
35. Zhou S, Yung Chan S, Cher Goh B et al. (2005) Mechanism-based inhibition of cytochrome P450 3A4 by therapeutic drugs. Clin Pharmacokinet 44:279–04
36. Rittweger M , Arast´eh K (2007) Clinical pharmacokinetics of darunavir. Clin Pharmacokinet 46:739–56 37. Spurdle A, Goodwin B, Hodgson E et al. (2002) The CYP3A4*1B polymorphism has no functional
significance and is not associated with risk of breast or ovarian cancer. Pharmacogenetics 12:355–66 38. He P, Court MH, Greenblatt DJ et al. (2005) Genotype-phenotype associations of cytochrome P450 3A4
and 3A5 polymorphism with midazolam clearance in vivo. Clin Pharmacol Ther 77:373–87
39. Hesselink DA, van Schaik RH, van der Heiden IP et al. (2003) Genetic polymorphisms of the CYP3A4, CYP3A5, and MDR-1 genes and pharmacokinetics of the calcineurin inhibitors cyclosporine and tacrolimus. Clin Pharmacol Ther 74:245–54
40. Tran A, Jullien V, Alexandre J et al. (2006) Pharmacokinetics and toxicity of docetaxel: role of CYP3A, MDR1, and GST polymorphisms. Clin Pharmacol Ther 79:570–80
41. Amirimani B, Ning B, Deitz AC et al. (2003) Increased transcriptional activity of the CYP3A4*1B promoter variant. Environ Mol Mutagen 42:299–305
42. Yeh K, Stone J, Carides A et al. (1999) Simultaneous investigation of indinavir nonlinear pharmacoki-netics and bioavailability in healthy volunteers using stable isotope labeling technique: study design and model-independent data analysis. J Pharm Sci 88:568–73
43. Lu JF, Blaschke TF, Flexner C et al. Model-based analysis of the pharmacokinetic interactions between ritonavir, nelfinavir and saquinavir after simultaneous and staggered oral administration. Drug Metab Dispos 30:1455–61
44. Kappelhoff BS, Huitema ADR, Crommentuyn KML et al. (2005) Development and validation of a pop-ulation pharmacokinetic model for ritonavir used as a booster or as an antiviral agent in hiv-1-infected patients. Br J Clin Pharmacol 59:174–82
45. Sch¨on A, del Mar Ingaramo M , Freire E (2003) The binding of HIV-1 protease inhibitors to human serum proteins. Biophys Chem 105:221–30
46. Jones K, Hoggard PG, Khoo S et al. (2001) Effect of alpha1-acid glycoprotein on the intracellular accu-mulation of the HIV protease inhibitors saquinavir, ritonavir and indinavir in vitro. Br J Clin Pharmacol 51:99–102
47. Zhang X, Schooley R , Gerber J (1999) The effect of increasing alpha1-acid glycoprotein concentration on the antiviral efficacy of human immunodeficiency virus protease inhibitors. J Infect Dis 180:1833–37 48. Samson A, Lavielle M , Mentr´e F (2006) Extension of the SAEM algorithm to left-censored data in nonlinear mixed-effects model: Application to HIV dynamics model. Comput Stat Data Anal 51:1562– 74
49. Fletcher CV (1999) Pharmacologic considerations for therapeutic success with antiretroviral agents. Ann Pharmacother 33:989–95
50. Burger DM, Hugen PWH, Aarnoutse RE et al. (2001) A retrospective, cohort-based survey of patients using twice-daily indinavir + ritonavir combinations: pharmacokinetics, safety and efficacy. J Acquir Immune Defic Syndr 26:218–24
51. Rayner CR, Galbraith KJ, Marriott JL et al. (2002) A critical evaluation of the therapeutic range of indinavir. Ann Pharmacother 36:1230–37
52. Behrens G, Dejam A, Schmidt H et al. (1999) Impaired glucose tolerance, beta cell function, and lipid metabolism: HIV patients under treatment with protease inhibitors. AIDS 13:F63–70
Table 1 Characteristics of the 40 studied patients
Median [Range]
Age (years) 36.5 [20.0 - 59.0]
BMI (kg/m2) 22.6 [17.5 - 35.8]
Weight (kg) 68.0 [45.0 - 103.0)
Creatinine clearance (mmol/L) 95.4 [57.4 - 245.1]
Albumin (g/L) 38.4 [25.5 - 47.4)
Orosomucoid (g/L) 1.0 [0.5 - 2.9]
Number of patients (%) Dose (400/600/800mg) 26 (65) / 8 (20) / 6 (15) Coadministration of AZT/3TC (y/n) 33 (83) / 7 (17) Coinfection VHB/VHC (y/n)∗ 7 (18) / 32 (82)
Good adherence (y/n) 15 (38) / 25 (62)
Sex (male/female) 27 (68) / 13 (32)
Ethnic group (African/Caucasian) 20 (50) / 20 (50) CDC classification for HIV infection (A or B/C) 30 (75) / 10 (25) ∗One patient had this information missing
Table 2 Distribution of the genetic polymorphisms within each ethnic group and P-values for the Hardy-Weinberg proportions test (H-W)
Number of patients (%) H-W P-value African ABCB1 exon 26 (CC/CT/TT) 11 (55) / 9 (45) / 0 (0) 0.43 ABCB1 exon 21 (GG/GT/TT) 19 (95) / 1 (5) / 0 (0) 0.99 CYP3A5 (4 *1/3 *1/≤2 *1) 0 (0) / 8 (40) / 12 (60) 0.53 CYP3A4*1B (*1A*1A/*1A*1B/*1B*1B) 9 (45) / 8 (40) / 3 (15) 0.86 Caucasian ABCB1 exon 26 (CC/CT/TT) 2 (12) / 12 (70) / 3 (18) 0.22 ABCB1 exon 21 (GG/GT/TT) 4 (21) / 11 (58) / 4 (21) 0.79 CYP3A5 (4 *1/3 *1/≤2 *1) 18 (100) / 0 (0) / 0 (0) 1 CYP3A4*1B (*1A*1A/*1A*1B/*1B*1B) 0 (0) / 3 (16) / 16 (84) 0.93
Note : One patient had missing information for all genotypes, ABCB1 exon 26 and
CYP3A4 genotypes were also both missing in another patient, in addition one
patient had missing genotype for ABCB1 exon 26
Table 3 Population pharmacokinetic parameters of indinavir for the basic and the final model: estimates and relative standard error (RSE)
Basic model (N = 40) Covariate model (N = 38) Parameters Estimates RSE (%) Estimates RSE (%)
ka(h−1) 1.3 33.7 2.1 44.1 βCY P3A4 ka - - -1.3 42.0 Cl/F (L/h) 21.9 6.9 22.2 6.9 V/F (L) 93.9 8.2 97.3 9.3 ωka(%) 118.0 22.9 98.2 28.7 ωCl/F(%) 34.4 15.0 34.9 15.0 ωV/F(%) 19.3 66.8 21.6 57.8 σ(%) 44.5 8.9 44.7 8.6
RSE = relative standard error
Table 4 Population pharmacokinetic parameters of ritonavir for the basic and the final model: estimates and relative standard error (RSE)
Basic model (N = 39) Covariate model (N = 39) Parameters Estimates RSE (%) Estimates RSE (%)
ka(h−1) 2.4 98.7 2.2 93.5 Cl/F (L/h) 8.7 9.4 8.3 9.0 βOrosomucoid Cl - - -0.8 46.5 V/F (L) 61.6 8.6 60.7 8.7 ωka(%) 357.7 21.9 346.8 21.5 ωCl/F(%) 55.9 12.2 52.4 12.4 ωV/F(%) 22.8 53.9 23.3 51.5 σ(%) 30.4 8.4 30.3 8.4
RSE = relative standard error
Table 5 Median [range] of the studied short-term efficacy and safety measurements and of the change from baseline
Baselinea W2 or W4b Difference from baseline
P-value
Efficacy
Log viral load (log copies/mL) 4.9 [3.4 - 6.3] 2.9 [1.8 - 4.1] -1.8 [-2.8 - -0.5] <0.001 Safety
Total cholesterol (mmol/L) 4.3 [1.9 - 7.4] 5.0 [2.9 - 7.5] 0.8 [0.8 - 4.7] <0.001 HDL cholesterol (mmol/L) 1.1 [0.5 - 1.8] 1.1 [0.4 -2.1] 0.1 [- 0.7 - 1.0] 0.09 Glycaemia (mmol/L) 4.7 [3.4 - 6.0] 4.9 [2.8 - 7.1] 0.2 [-1.0 - 2.7] 0.013 Triglycerides (mmol/L) 1.0 [0.4 - 3.0] 1.4 [0.6 - 4.0] 0.4 [-0.7 - 1.7] <0.001 Creatinine clearance (mL/min) 98.4 [62.0 - 195.7] 97.4 [62.8 - 252.0] -1.0 [-38.0 - 56.4] 0.5 aBaseline = D0 for log viral load and W-4 for safety
bW2 for log viral load and W4 for safety

![Table 5 Median [range] of the studied short-term efficacy and safety measurements and of the change from baseline](https://thumb-eu.123doks.com/thumbv2/123doknet/15001005.675722/18.892.110.668.406.577/table-median-studied-efficacy-safety-measurements-change-baseline.webp)
