Cell Reports, Volume
17
Supplemental Information
Lsd1 Ablation Triggers Metabolic Reprogramming
of Brown Adipose Tissue
Delphine Duteil, Milica Tosic, Franziska Lausecker, Hatice Z. Nenseth, Judith M.
Müller, Sylvia Urban, Dominica Willmann, Kerstin Petroll, Nadia Messaddeq, Laura
Arrigoni, Thomas Manke, Jan-Wilhelm Kornfeld, Jens C. Brüning, Vyacheslav
Zagoriy, Michael Meret, Jörn Dengjel, Tou
fike Kanouni, and Roland Schüle
Supplemental Informations
Lsd1 ablation triggers metabolic reprogramming of brown adipose tissue
Delphine Duteil, Milica Tosic, Franziska Lausecker, Hatice Z. Nenseth, Judith M. Müller, Sylvia Urban, Dominica Willmann, Kerstin Petroll, Nadia Messaddeq, Laura Arrigoni, Jan-Wilhelm Kornfeld, Jens C. Brüning, Vyacheslav Zagoriy, Michael Meret, Jörn Dengjel, Thomas Manke, and Roland Schüle
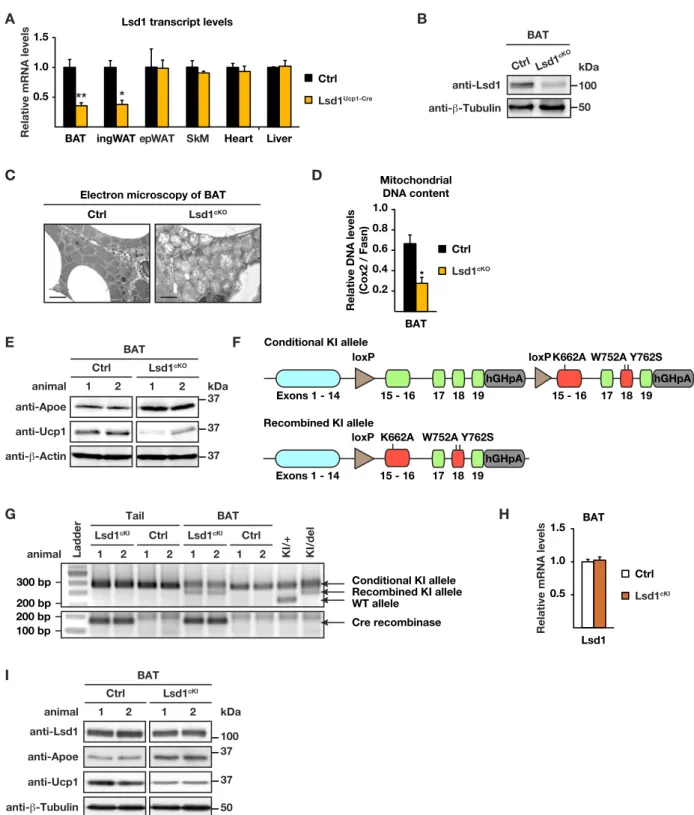
Figure S1 (related to Figure 1). Lsd1 represses the expression of WAT-selective genes in BAT.
(A) Relative Lsd1 mRNA levels in interscapular brown adipose tissue (BAT), inguinal white adipose tissue (ingWAT), epididymal white adipose tissue (epWAT), skeletal muscle (SkM), heart, and liver of control (Ctrl) and Lsd1cKO mice
(mean + SEM, *p<0.05, **p<0.01, Ctrl n = 9, Lsd1cKO n = 7).
(B) Western blot analysis of Lsd1 in BAT of Ctrl and Lsd1cKO mice. β-Tubulin was used as a loading control.
(C) Ultrastructure analysis of representative BAT sections of Ctrl and Lsd1cKO mice. Scale bar: 2 µm.
(D) Ratio of mitochondria to nuclear DNA content assessed by quantitative PCR of the mitochondria-encoded Cox2 and the nuclear-encoded Fasn gene in BAT of Ctrl and Lsd1cKO mice (mean + SEM, *p<0.05, n = 5).
(E) Western blot analysis of Apoe and Ucp1 in BAT of Ctrl and Lsd1cKO mice. β-Actin was used as a loading control. (F) Scheme depicting the Lsd1 knock-in (KI) allele.
(G) Genotyping of mouse tail and BAT biopsies of Ctrl and Lsd1cKO mice for the presence of Lsd1 conditional or
recombined KI alleles (upper panel), or Ucp1-Cre recombinase (lower panel) by semi-quantitative PCR. (H) Relative Lsd1 mRNA levels in BAT of Ctrl and Lsd1cKI mice (mean + SEM, Ctrl n = 7, Lsd1cKI n = 6).
(I) Western blot analysis of Lsd1, Apoe, and Ucp1 in BAT of Ctrl and Lsd1cKI mice. β-Tubulin was used as a loading control. A B E anti-β-Tubulin BAT anti-Lsd1 Ctrl Lsd1cKO G 0.5 1.0 1.5 Lsd1 I H Exons 1 - 14 15 - 16 17 18 19 hGHpA 15 - 16 17 18 19 hGHpA
loxP loxPK662AW752A Y762S
Conditional KI allele
Exons 1 - 14 15 - 16 17 18 19
hGHpA loxP K662A W752A Y762S Recombined KI allele BAT Tail WT allele Conditional KI allele Recombined KI allele Cre recombinase 300 bp 200 bp 200 bp
100 bp Relative mRNA levels
F
C
Ctrl Lsd1cKO
Electron microscopy of BAT
D animal 1 2 1 2 Ctrl Lsd1cKI 1 2 1 2 Ctrl Lsd1cKI
Ladder KI/+ KI/del
0.2 0.4 0.6 0.8 1.0 BAT
Relative DNA levels
(Cox2 / Fasn) Mitochondrial DNA content * BAT anti-Lsd1 kDa 100 37 anti-Ucp1 37 anti-Apoe anti-β-Tubulin 50 BAT animal 1 2 1 2 Ctrl Lsd1cKI anti-β-Actin BAT anti-Apoe anti-Ucp1 animal 1 2 Ctrl kDa 37 37 37 1 2 Lsd1cKO Ctrl Lsd1cKO Ctrl Lsd1cKI 0.5 1.0 1.5
BAT ingWAT Heart
Lsd1 transcript levels
Relative mRNA levels
** * Ctrl Lsd1Ucp1-Cre epWAT SkM Liver kDa 100 50
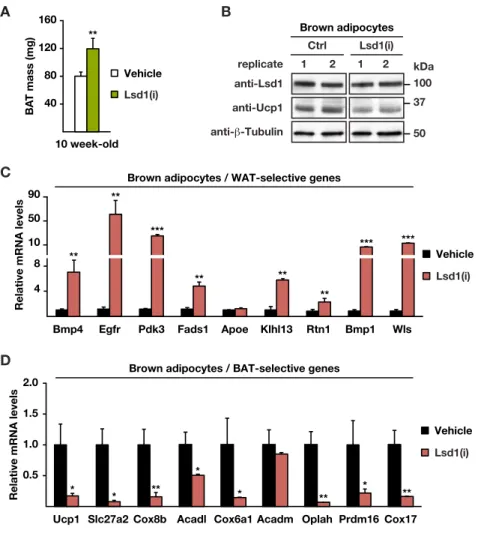
Figure S2 (related to Figure 2). The demethylase activity of Lsd1 is required to maintain BAT properties.
(A) Mass of BAT of 10 week-old mice treated with vehicle or Lsd1-specific inhibitor [Lsd1(i)] (mean + SEM, **p<0.01, vehicle n = 6, Lsd1(i) n = 7).
(B) Western blot analysis of Lsd1 and Ucp1 in brown adipocytes treated with vehicle or Lsd1(i). β-Tubulin was used as a loading control.
(C-D) Relative mRNA levels of (C) WAT- and (D) BAT-selective genes in brown adipocytes treated with vehicle or Lsd1(i) (mean + SEM, *p<0.05, **p<0.01, ***p<0.001, n = 6).
C B 40 80 120 160 10 week-old Vehicle Lsd1(i) B A T mass (mg) ** A D 10 50 90
Relative mRNA levels
** ***
** **
**
*** ***
Brown adipocytes / WAT-selective genes
4 8 ** 0.5 1.0 1.5 2.0
Relative mRNA levels * * ** ** ** *
* *
Brown adipocytes / BAT-selective genes anti-Lsd1 kDa anti-Ucp1 anti-β-Tubulin Brown adipocytes replicate 1 2 1 2 Ctrl Lsd1(i) 100 37 50 Vehicle Lsd1(i) Vehicle Lsd1(i)
Slc27a2 Cox8b Cox17
Ucp1 Prdm16
Bmp4 Egfr Pdk3 Apoe Klhl13 Rtn1 Bmp1 Wls
Acadm Oplah Acadl Cox6a1
Input anti-Lsd1 rbIgG IP anti-Nrf1 anti-Lsd1 kDa 100 50 A anti-Nrf1 anti-Lsd1 kDa 100 50 Input 26 28 30 32 34 36 38 40 42 44 46 48 Fractions 669 443 200 150 66 26 C
Size markers (kDa) 0.01 0.02 0.03 0.04 0.05 % Input anti-Nrf1rbIgG anti-Lsd1 Bmp1 0.01 0.02 0.03 0.04 0.05 0.06 0.07 % Input anti-Nrf1rbIgG anti-Lsd1 Pdk3 0.02 0.04 0.06 0.08 % Input anti-Nrf1rbIgG anti-Lsd1 Wls D
ChIP in brown adipocytes ChIP in brown adipocytes
Vehicle Lsd1(i) 1 2 3 4 Acadm % I np ut anti-H3K4me2 rbIgG Cox6a1 1 2 3 4 % I np ut anti-H3K4me2 rbIgG Oplah 1 2 3 4 % I np ut anti-H3K4me2 rbIgG B ** ** **** ns ns ns *** **** ns **** ** **** ns **** * **** ns **** E 0.3 0.6 0.9 1.2 Lsd1 Nrf1 siRNA Ctrl siRNA Lsd1 siRNA Nrf1
Relative mRNA levels
Brown adipocytes * **** ns ** G anti-Hdac1 50
Input anti-Lsd1 rbIgG
IP anti-Rcor3 anti-Lsd1 kDa 100 50 anti-Rcor1 75 anti-Hdac2 50 anti-Arid1a 250 H kDa 100 75 50 25 27 29 31 33 35 37 39 41 43 45 47 anti-Rcor1 anti-Lsd1 anti-Hdac1 Fractions 15 17 19 21 23 49 51 53 669 443 200 150 66 26 2000 5500 17000 5 7 9 11 13 1 3 kDa 25 27 29 31 33 35 37 39 41 43 45 47 Fractions 1 3 5 7 9 11 13 15 17 19 21 23 49 51 53 55 57 59 669 443 200 150 66 26 2000 5500 17000 anti-Rcor3 anti-Lsd1 100 75 kDa 26 28 30 32 34 36 38 40 42 44 46 48 Fractions 2 4 6 8 10 12 14 16 18 20 22 24 50 52 54 56 5860 669 443 200 150 66 26 2000 5500 17000 anti-Lsd1 anti-Hdac2 100 50 Size markers (kDa)
Size markers (kDa)
Size markers (kDa)
Input Input Input 61 64 52 163 75 44 112 Ab1 Ab2 Ab3 Mass spectrometry with different Lsd1 antibodies
Figure S3 (related to Figure 3). Lsd1 regulates the brown fat program through a dual mechanism
(A) ChIP analysis to detect promoter occupancy performed with anti-Lsd1 and anti-Nrf1 antibodies or rabbit IgG (rbIgG) in brown adipocytes for indicated genes. The precipitated chromatin was quantified by qPCR analysis with primers flanking Lsd1-binding sites in the indicated genes (mean + SEM, n = 3).
(B) ChIP analysis to detect promoter occupancy performed with anti-H3K4me2 antibody or rbIgG in brown adipocytes treated with Lsd1(i) or vehicle. The precipitated chromatin was quantified by qPCR analysis with primers flanking Lsd1-binding sites in the indicated genes (mean + SEM, n = 3).
(C) Western blot analysis of individual fractions of brown adipocyte nuclear extracts obtained after gel filtration. Membranes were decorated with Lsd1 or Nrf1 antibody.
(D) Immunoprecipitation of Nrf1 with Lsd1 antibody from BAT nuclear extracts. Membranes were decorated with Lsd1 or Nrf1 antibody. Rabbit IgG (rbIgG) served as a control.
(E) Relative mRNA levels of Lsd1 and Nrf1 in brown adipocytes transfected with siRNA Ctrl, siRNA Lsd1, or siRNA Nrf1 (mean + SEM, n = 3). In agreement with previous data (Duteil et al., 2014), knock-down of Lsd1 results in reduced mRNA levels of Nrf1.
(F) Venn diagram depicting the overlap between Lsd1 interacting proteins identified by immunoprecipitation using three
I
J
Brown adipocytes / Oil Red O staining siRNA Lsd1
siRNA Ctrl siRNA Rcor1 siRNA Rcor3
K 0.01 0.02 0.03 0.04 0.05 0.06 0.07 % Input
anti-anti-Lsd1anti-Rcor1Rcor3rbIgG Acadm
L
ChIP in brown adipocytes
0.01 0.02 0.03 0.04 0.05 0.06 % Input Oplah
anti-anti-Lsd1anti-Rcor1Rcor3rbIgG
0.01 0.02 0.03 0.04 0.05 % Input Cox6a1
anti-anti-Lsd1Rcor1anti-Rcor3rbIgG
0.025 0.005 0.075 0.100 0.125 anti-H3K9me2 mIgG % Input Pdk3 0.1 0.2 0.3 0.4 anti-H3K9me2 mIgG % Input Bmp1 0.05 0.10 0.15 0.20 anti-H3K9me2 mIgG % Input Wls ChIP in brown adipocytes
Vehicle Lsd1(i) anti-Lsd1 kDa 100 anti-β-Actin 37 siRNA Ctrl Lsd1 anti-Rcor1 kDa 75 anti-β-Actin 37 siRNA Ctrl Rcor1 anti-Rcor3 kDa 75 anti-β-Actin 37 siRNA Ctrl Rcor3 anti-Lsd1 100 anti-Lsd1 100 anti-Rcor1 75 anti-Rcor3 75 ** ns ns ** ns ns **** ns ns ****** ns ** ***** ns ns ***** ns *
(G) Immunoprecipitation of components of the CoREST complex with Lsd1 antibody from BAT nuclear extracts. Membranes were decorated with the indicated antibodies. Rabbit IgG (rbIgG) served used as a control.
(H) Western blot analysis of individual fractions of brown adipocyte nuclear extracts obtained after gel filtration. Membranes were decorated with the indicated antibodies.
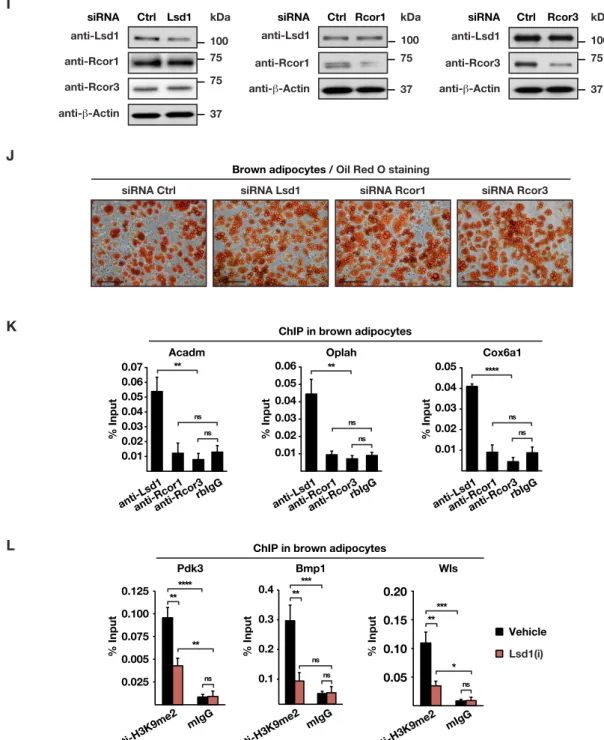
(I) Western blot analysis of Lsd1, Rcor1, and Rcor3 in brown adipocytes transfected with siRNA Ctrl, siRNA Lsd1, siRNA Rcor1, or siRNA Rcor3. β-Tubulin was used as a loading control.
(J) Oil red O staining of brown adipocytes transfected with siRNA Ctrl, siRNA Lsd1, siRNA Rcor1, or siRNA Rcor3. Scale bar: 50 µm.
(K-L) ChIP analysis to detect promoter occupancy performed with (K) anti-Lsd1, anti-Rcor1, and anti-Rcor3 antibody or rbIgG, and (L) anti-H3K9me2 antibody or mIgG in brown adipocytes treated with Lsd1(i) or vehicle. The precipitated chromatin was quantified by qPCR analysis with primers flanking Lsd1-binding sites in the indicated genes (mean + SEM, n = 3).
A β-oxidation Acaa1a Acaa1b Acadl Acadm Acads Acadvl Acat1 Acox1 Acox3 Acsl1 Acsl5 Acss1 Cd36 Cpt1a Cpt1b Cpt1c Cpt2 Echs1 Eci1 Eci2 Hadh Hadha Hadhb Slc25a20 Slc27a2 -1 0 1 Ctrl Lsd1cKO Mean centered normalized expression OXPHOS Ndufa1 Ndufa2 Ndufa3 Ndufa8 Ndufaf1 Ndufaf4 Ndufb11 Ndufb3 Ndufb5 Ndufb6 Ndufb7 Ndufb8 Ndufb9 Ndufc1 Ndufs2 Ndufs4 Ndufs6 Ndufs8 Ndufv2 Ndufv3 Sdhd Cyc1 Uqcrfs1 Uqcrc2 Uqcrh Uqcrb Uqcrq Uqcr10 Uqcr11 Cox4i1 Cox5a Cox6a1 Cox6b1 Cox7a2l Cox7b Cox7c Cox8a Coq3 Coq5 Coq6 Coq7 Coq9 Cox11 Cox15 Cox16 Cox17 Atp5e Atp5f1 Atp5g1 Atp5j2 Atp5l Atp5k Ucp1 Ucp2 Ucp3 B
Glut1 Glut3 Glut12
**
* *
* *
Relative mRNA levels
3 6 9 Glucose transporters Ctrl Lsd1cKO Ctrl Lsd1cKI Hk1 Aldoc
Relative mRNA levels
Glycolytic enzymes (Glucose processing)
Fbp1 Pfkm Pgam2 Eno3 *** ** *** *** *** *** *** *** * *** *** *** 3 6 9 Ctrl Lsd1cKO Ctrl Lsd1cKI C 2 4 6 8 10 12 mpH / min * Glycolytic reserve Vehicle Lsd1(i) ECAR 10 20 30 Glycolysis 10 20 30 40 Glycolytic capacity ECAR ECAR mpH / min mpH / min * * D
OCR (pmol / min)
Vehicle Lsd1(i) Oligomycin FCCP Rotenone & Antimycin A OCR 50 100 150 200 250 20 40 60 80 100 120 140 160 Time (min) E 20 40 60 80 100 120 Basal respiration 10 20 30 40 50 60 ATP production 10 20 30 40 50 60 Proton leak 20 40 60 80 100 120 140 160 Maximal respiration 5 10 15 20 25 30 35 40 45 Spare capacity OCR
OCR OCR OCR OCR
Vehicle Lsd1(i)
OCR (pmol / min)
OCR (pmol / min) OCR (pmol / min) OCR (pmol / min) OCR (pmol / min)
**
** *
Vehicle Lsd1(i)
Figure S4 (related to Figure 4). Lsd1 represses glycolysis in BAT.
(A) Heatmaps depicting mRNA levels of genes involved in β-oxidation and oxidative phosphorylation (OXPHOS) in BAT of 10 week-old control (Ctrl) and Lsd1cKO mice.
J
Input anti-Lsd1 MACS peak Refseq
Slc2a1 Hk1 Aldoa Dlat Got2
Gene name
Glycolysis
Slc2a3 Slc2a12 Eno3 Pfkm Got1
G
[0-25]
F
Got2
Relative mRNA levels
Glycolytic and pyruvate processing enzymes
Got1 Mpc1 Mpc2 Dlat Pdhx *** *** * * ** *** *** *** *** *** *** *** 3 6 9 10 20 30 40 pmol of O2 / s Mitochondria respiration BAT ** Pck2 *** *** Ctrl Lsd1cKO Ctrl Lsd1cKI Ctrl Lsd1cKO 0.5 1.0 1.5 2.0
Relative mRNA levels
Glycolytic and pyruvate processing enzymes
* *
Glut1 Glut3
* ***
Glucose transporters
Mpc1 Mpc2 Dlat Pdhx Got1 Got2
** ** *** *** *** * *** Pck2 Vehicle Lsd1(i) Hk1 Aldoc 2 4 6 8
NAD+/NADH ratio
Ctrl Lsd1cKO I H * 0.50 1.00 1.50 2.00 % Input Eno3 0.02 0.04 Vehicle Lsd1(i) 0.05 0.10 0.15 0.20 0.25 % Input Got2 Vehicle Lsd1(i)
K ChIP in brown adipocytes
0.40 0.80 1.20 1.60 % Input Glut1 0.02 0.04 Vehicle Lsd1(i) anti-Lsd1 anti-H3K4me2 rbIgG anti-Lsd1 anti-H3K4me2 rbIgG anti-Lsd1 anti-H3K4me2 rbIgG **** **** ns **** ns ******** * ** **** **** ns **** ns **** **** * ** *** **** ns *** ns ******** *** *** 0.02 0.04 0.06 anti-H3K9me2 mIgG % Input Got1 0.02 0.04 0.06 0.08 0.10 anti-H3K9me2 mIgG % Input Hk1 Vehicle Lsd1(i) Vehicle Lsd1(i) ChIP in brown adipocytes
L ******* ns ** ******* ns **
(B) Relative mRNA levels of genes encoding glucose transporters and glycolytic enzymes in BAT of Ctrl, Lsd1cKO, and
Lsd1cKI mice [mean + SEM, *p<0.05, **p<0.01, ***p<0.001, Ctrl (black bars) n = 9, Lsd1cKO (orange bars) n = 7, Ctrl (white bars) n = 7, and Lsd1cKI (red bars) n = 6].
(C) Glycolysis, maximal glycolytic capacity and glycolytic reserve deduced from extracellular acidification rate (ECAR) (mean + SEM, *p<0.05, n = 6).
(D-E) Oxygen consumption rate (OCR) of vehicle- or Lsd1(i) treated brown adipocytes determined by the Seahorse Extracellular Flux Analyzer (mean + SEM, *p<0.05, n = 9).
(F) Mitochondrial respiration of BAT extracts from Ctrl and Lsd1cKO mice assessed with a high-resolution respiratory
Oxygraph-2K system (mean + SEM, **p<0.01, n = 5).
(G) Relative mRNA levels of genes encoding glycolytic and pyruvate processing enzymes in BAT of Ctrl, Lsd1cKO, and Lsd1cKI mice [mean + SEM, *p<0.05, **p<0.01, ***p<0.001, Ctrl (black bars) n = 9, Lsd1cKO (orange bars) n = 7, Ctrl
(white bars) n = 7, and Lsd1cKI (red bars) n = 6].
(H) Determination of the NAD+/NADH ratio in BAT of Ctrl and Lsd1cKO mice at 10 weeks of age (mean + SEM,
**p<0.01, ***p<0.001, n = 6).
(I) Relative mRNA levels of selected genes encoding glucose transporters, glycolytic, and pyruvate processing enzymes in BAT of mice treated with vehicle or Lsd1(i) [mean + SEM, *p<0.05, **p<0.01, ***p<0.001, Vehicle n = 6, Lsd1(i) n = 7].
(J) Localization of Lsd1 at the promoter of representative genes encoding glucose transporters, glycolytic and pyruvate processing enzymes in brown adipocytes.
(K-L) ChIP analysis to detect promoter occupancy performed with (K) anti-Lsd1 and anti-H3K4me2 antibody, or rbIgG or (L) anti-H3K9me2 antibody, or mIgG in brown adipocytes treated with vehicle or Lsd1(i). The precipitated chromatin was quantified by qPCR analysis with primers flanking Lsd1-binding sites in the indicated genes (mean + SEM, two-way ANOVA, ns: p>0.05, *p<0.05, **p<0.01, ***p<0.001, ****p<0.0001, n = 3).
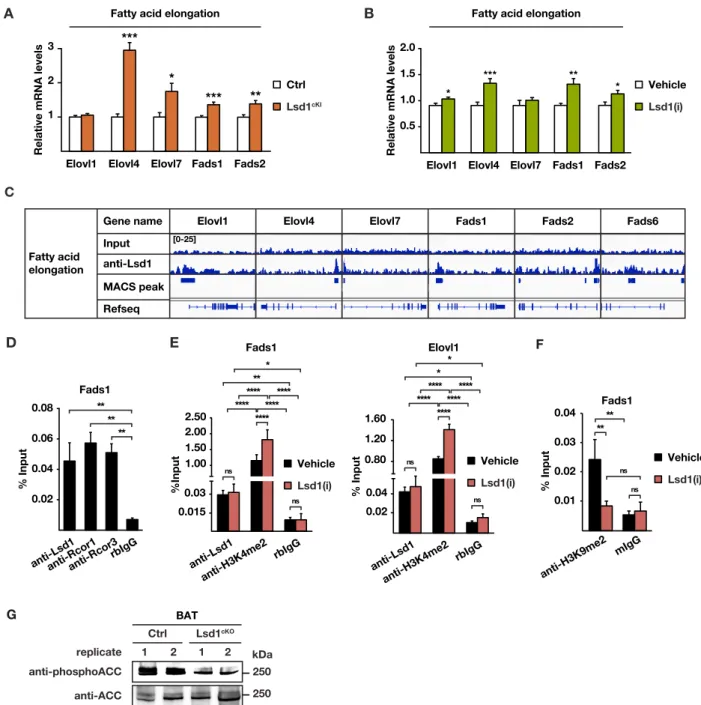
Figure S5 (related to Figure 5). Lsd1 limits fat accumulation in BAT.
(A-B) Relative mRNA levels of indicated enzymes involved in fatty acid elongation in BAT of (A) Ctrl and Lsd1cKI mice
and (B) mice treated with vehicle or Lsd1(i) [(A-B) mean + SEM, *p<0.05, **p<0.01, ***p<0.001; (A) Ctrl n = 7, Lsd1cKI
n = 6; (B) Vehicle n = 6, Lsd1(i) n = 7].
(C) Localization of Lsd1 at the promoter of representative genes encoding enzymes involved in fatty acid elongation in brown adipocytes.
(D-F) ChIP analysis to detect promoter occupancy performed with with (D) anti-Lsd1, anti-Rcor1, and anti-Rcor3 antibody or rbIgG in brown adipocytes, (E) anti-Lsd1 and anti-H3K4me2 antibody, or rbIgG, or (F) anti-H3K9me2 antibody, or mIgG in brown adipocytes treated with vehicle or Lsd1(i). The precipitated chromatin was quantified by qPCR analysis with primers flanking Lsd1-binding sites in the indicated genes (mean + SEM, (D) one-way ANOVA, (E-F) two-way ANOVA, ns: p>0.05, *p<0.05, **p<0.01, ***p<0.001, ****p<0.0001, n = 3).
(G) Western blot analysis of phosphor-ACC and total ACC in BAT of Ctrl and Lsd1cKO mice.
1 2 3
Elovl1 Elovl4 Elovl7
Relative mRNA levels
*** *
Fads1 Fads2
*** **
Fatty acid elongation
Elovl1 Elovl4 Elovl7
Relative mRNA levels
*** *
Fads1 Fads2 **
* Fatty acid elongation
0.5 1.0 1.5 2.0 A B Input anti-Lsd1 MACS peak Refseq Elovl1 [0-25]
Elovl4 Elovl7 Fads1 Fads2 Fads6
Gene name Fatty acid elongation D Ctrl Lsd1cKI Vehicle Lsd1(i) E 0.80 1.20 1.60 % Input Elovl1 0.02 0.04 Vehicle Lsd1(i) anti-Lsd1 anti-H3K4me2 rbIgG **** **** ns **** ns ******** * * 0.01 0.02 0.03 0.04 anti-H3K9me2 mIgG Fads1 % Input Vehicle Lsd1(i) **** ns ns 0.02 0.04 0.06 0.08
anti-anti-Lsd1Rcor1anti-Rcor3rbIgG
% Input Fads1 ** ** ** 1.00 1.50 2.00 2.50 %Input Fads1 0.015 0.03 Vehicle Lsd1(i) anti-Lsd1 anti-H3K4me2 rbIgG **** **** ns **** ns **** **** *** C F anti-phosphoACC kDa anti-ACC BAT replicate 1 2 1 2 Ctrl Lsd1cKO 250 250 G
1 2 3 4 Food (g / day) 2 4 6 8 10 12 Drink ( ml / day)
Sum per day
A B 50 100 150 200 30 week-old B A T mass (mg) *** 250
Sum per day
200 400 600 Mean Total Activity ( count / h) C 3 6 9
G G1P G6P F6P 3PGl Gl Pyr Mal Glu Gly3P Glyc
Relative compund levels
* * * ** ** ** ** ** *** ** D E * F TAG42:0 TAG44:0 TAG44:1 TAG48:4 TAG50:0 TAG50:3 TAG52:0 TAG52:3 TAG52:5 TAG52:7 TAG54:4 TAG54:6 TAG54:7 TAG56:0 TAG56:8 TAG56:9 DAG34:1 DAG34:2 DAG36:2 DAG36:3 DAG36:4 DAG36:4 DAG36:6 DAG38:6 -0.5 0 0.5 Ctrl Lsd1cKO
Mean centered normalized expression Lipidomics (30 week-old) Metabolomics (30 week-old) 50 100 150 30 week-old Ctrl Lsd1cKI Ctrl Lsd1cKO ** I Lsd1cKI Ctrl Lsd1cKO BAT (30 week-old) H&E staining anti-Perilipin rbIgG anti-Ucp1 Ctrl Lsd1cKO Ctrl Lsd1cKO Ctrl Lsd1cKO
Macroscopic view of BAT (30 week-old)
Ctrl Lsd1cKI G Ctrl Lsd1cKO Ctrl Lsd1cKO Females 0 10 20 30 40 0 10 20 30 40 Ctrl Lsd1cKO Week-old Body weight (g) H
Figure S6 (related to Figure 6). Lsd1cKO mice have a higher glucose uptake despite an increased body weight. (A) Body weight of control and Lsd1cKO female mice at indicated age (mean + SEM; two-way ANOVA with repeated
measures; factor interaction: pgenotype/time: ns; Ctrl n = 6, Lsd1cKO n = 6).
(B-D) (B) Food consumption, (C) drink consumption, and (D) total activity of 30 week-old control (Ctrl) and Lsd1cKO
mice (mean + SEM, Ctrl n = 9, Lsd1cKO n = 7).
(E-F) (E) Mass and (F) macroscopic view of BAT of 30 week-old Ctrl, Lsd1cKO, and Lsd1cKI mice [(D) mean + SEM, **p<0.01, ***p<0.001, Ctrl n = 9, Lsd1cKO n = 7, and Ctrl n = 7, Lsd1cKI n = 6].
(G) H&E staining and perilipin or Ucp1 immunofluorescence of representative sections of BAT of 30 week-old Ctrl, Lsd1cKO, and Lsd1cKI mice. Nuclei were counterstained with DAPI. Rabbit IgG (rbIgG) was used as negative control.
(H) Lipidomic analysis of BAT from 30 week-old Ctrl and Lsd1cKO mice (mean + SEM, n = 5).
(I) Relative abundance of indicated metabolites in BAT of Ctrl and Lsd1cKO mice. G: glucose, G1P: glucose-1-phosphate,
G6P: glucose-6-phosphate, F6P: fructose-6-phosphate, 3PGl: 3-phosphoglycerate, Gl: glycerate, Pyr: pyruvate, Mal: malate, Glu: glutamate, Gly3P: glycerol-3-phosphate, Glyc: glycerol (mean + SEM, n = 5, *p<0.05, **p<0.01, ***p<0.001).
(J-O) (J-K) VO2, (L-M) VCO2, and (N-O) energy expenditure of 30 week-old control and Lsd1cKO mice represented
related to the metabolic body weight (J, L, and N) (mean + SEM, *p<0.05, **p<0.01, Ctrl n = 8, Lsd1cKO n = 7) or as a
linear regression (K, M, and O) for which an ANCOVA analysis was performed.
(P) Intraperitoneal insulin sensitive test (IPIST) for 10 week-old or 30 week-old control and Lsd1cKO mice starved for 6 hours prior to analysis (mean + SEM, two-way ANOVA, Ctrl 10 week-old vs Lsd1cKO 10 week-old: ns p>0.05; Ctrl 10
week-old vs Ctrl 30 week-old: **p<0.01, ***p<0.001, ****p<0.0001; Lsd1cKO 10 week-old vs Lsd1cKO 30 week-old: #
p<0.05, ### p<0.001, #### p<0.0001; Ctrl 30 week-old vs Lsd1cKO 30 week-old: ns p>0.05; Ctrl n = 8, Lsd1cKO n = 7).
(Q) Serum insulin levels of 30 week-old control (Ctrl) and Lsd1cKO mice (mean + SEM, Ctrl n = 9, Lsd1cKO n = 7). Scale bars: (F) 7 mm, (G) H&E staining 100 µm, immunofluorescence 20 µm.
Q 0 20 40 60 80 100 120 0 20 40 60 80 100 Glucose (mg / dl)
Time after insulin injection (min) IPIST 0.5 1.0 1.5 2.0 2.5 Insulin U / l Ctrl Lsd1cKO Ctrl 10 weeks Lsd1cKO 10 weeks Ctrl 30 weeks Lsd1cKO 30 weeks P ns ***# ns ** ns ns ns ns ns ns ns ns* ###ns ****ns ####ns 0 1 2 3 4 5 25 26 27 28 29 30 0 1 2 3 4 25 26 27 28 29 30 0 0.1 0.2 0.3 0.4 0.5 25 26 27 28 29 30 J K L 0 120 140 160 Heat production kcal / h / kg ^0.75 30 weeks ** Ctrl Lsd1cKO 0 1100 1300 1500 VO2 ml / h / kg ^0.75 30 weeks ** Ctrl Lsd1cKO 0 700 900 1100 VCO2 30 weeks ** ml / h / kg ^0.75 Ctrl Lsd1cKO V O2 (m l / h ) / L ea n mass (g) Ctrl Lsd1cKO Ctrl Lsd1cKO Ctrl Lsd1cKO VC O2 (m l / h ) / L ea n mass (g) EE (m l / h ) / L ea n mass (g) M N O ANCOVA: r2 = 0.16 p = 0.00481 ANCOVA: r 2 = 0.53 p = 0.026524 ANCOVA: r 2 = 0.22 p = 0.010909
Supplemental Tables
Table S1 (related to Figure 1). mRNA ratios [represented as log(fold change), logFC] for BAT- (yellow) and
WAT-selective (bleu) genes in BAT and WAT of 10 week-old control mice (BAT / WAT) and in BAT of 10 week-old Lsd1cKO
and control mice (cKO / Ctrl).
Table S2 (related to Figure 3). List of the 163 Lsd1 interacting proteins identified by immunoprecipitation followed by
mass-spectrometry. The calculation of log2-value is described in Materials and Methods.
Gene Sense Primer 5'-3'
Lsd1 WT/L2 fw CCTCAGTAGGCCTGGTTTGT
Lsd1 WT/L2 rev TTGGTTTTGGTTGACCCTTC
Lsd1 L- fw CCGTGGAAATTCGTGCACTC
Lsd1 L- rev GCAGGCGGTTTGAAATGTATTC
Lsd1 WT/KI fw CCAGCTGCTTGTTGGTGC
Lsd1 WT/KI rev TGGAGTGAAGTGGTTACCTGC
Ucp1-Cre fw CCTCTGCACTGGCACTACCT
Ucp1-Cre rev TCTTCTTCTTGGGCACCATC
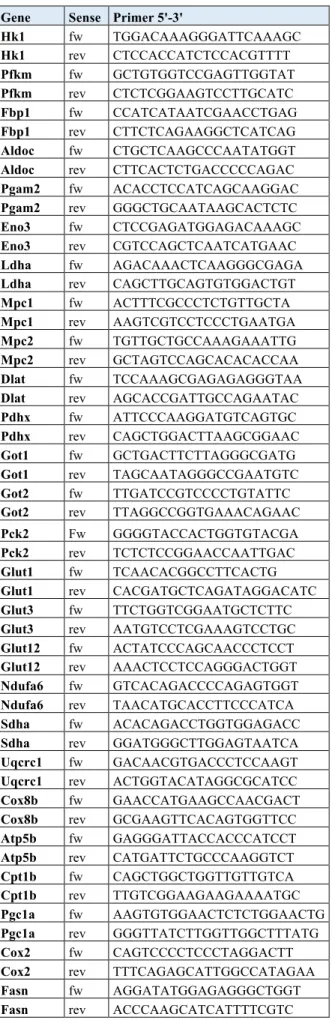
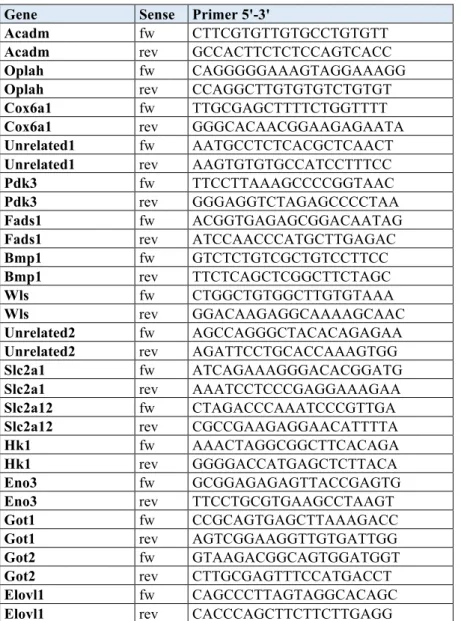
Table S4. Primers used for qPCR analysis Gene Sense Primer 5'-3'
Tbp fw GAAGCTGCGGTACAATTCCAG Tbp rev CCCCTTGTACCCTTCACCAAT 36b4 fw GCGTCCTGGCATTGTCTGT 36b4 rev GCAAATGCAGATGGATCAGCC Hprt fw AGGGCATATCCAACAACAAACTT Hprt rev GTTAAGCAGTACAGCCCCAAA Lsd1 fw GTGTTCTGGGACCCAAGTGT Lsd1 rev TAATGCCAGCAGCTTCTCCT Bmp4 fw GCTGGAATGATTGGATTGTGG Bmp4 rev ATGGCATGGTTGGTTGAGTTG Egfr fw ACACTGCTGGTGTTGCTGAC
Egfr rev CCCAAGGACCACTTCACAGT
Pdk3 fw TTTGAGAGGCTGCCAGTTTT
Pdk3 rev CGTCTCTGGTTGACTTGCAG
Fads1 fw AAGGCCAACCACCTCTTCTT
Fads1 rev ACTGACAGGTGCCCAAAGTC
Apoe fw GGTTCGAGCCAATAGTGGAA
Apoe rev TATTAAGCAAGGGCCACCAG
Klhl13 fw AGAATTGGTTGCTGCAATACTCC Klhl13 rev AAGGCACAGTTTCAAGTGCTG Rtn1 fw TCCGCATCTACAAGTCCGTT Rtn1 rev AAAAGCCTCCGTAGCTCCTT Bmp1 fw CAAGGCCCACTTCTTCTCAG Bmp1 rev TTGTGTTCACAGCCAGCTTC Wls fw ATTTGACTGGACCTGGATGC Wls rev TTCCAGTACCCTGCAATGTG Ucp1 fw TGGCAAAAACAGAAGGATT
Ucp1 rev CGAGTCGCAGAAAAGAAGC
Slc27a2 fw ATGCCGTGTCCGTCTTTTAC
Slc27a2 rev CGATGATGATTGATGGTTGC
Acadm fw GGATGACGGAGCAGCCAATG
Acadm rev ATACTCGTCACCCTTCTTCT
Oplah fw CTTCACGCACGTCTCCTTGT
Oplah rev GCATCTGCACAGGCCGTAT
Acadl fw TTGGTGGGGACTTGCTCTCA
Acadl rev CTGTTCTTTTGTGCCGTAAT
Cox6a1 fw TGCTCAACGTGTTCCTCAAG
Cox6a1 rev TAAGGGTCCAAAACCAGTGC
Prdm16 fw CCCCCAACGCTCTCGGATCC
Prdm16 rev CCGAAGCAGCGGTTGCACAG
Cox17 fw ATAGTTGCTTTCGCCTGGAA
Cox17 rev ACAAAGTAGGCCACCACGTC
Elovl1 fw TTCCAACTTCGAGGCTTCAT
Elovl1 rev GCTCAATGACCTTGGAAAGC
Elovl4 fw ACTATGGGCTGACTGCGTTC
Elovl4 rev TTCCGGTTTTTGACTGCTTC
Elovl7 fw TCATCCTGGGCCTCTATGTC
Elovl7 rev ACCATCCTCATTGCTCTTGG
Fads2 fw GCTCTCAGATCACCGAGGAC
Fads2 rev AGTGCCGAAGTACGAGAGGA
Gene Sense Primer 5'-3'
Hk1 fw TGGACAAAGGGATTCAAAGC Hk1 rev CTCCACCATCTCCACGTTTT Pfkm fw GCTGTGGTCCGAGTTGGTAT Pfkm rev CTCTCGGAAGTCCTTGCATC Fbp1 fw CCATCATAATCGAACCTGAG Fbp1 rev CTTCTCAGAAGGCTCATCAG Aldoc fw CTGCTCAAGCCCAATATGGT
Aldoc rev CTTCACTCTGACCCCCAGAC
Pgam2 fw ACACCTCCATCAGCAAGGAC
Pgam2 rev GGGCTGCAATAAGCACTCTC
Eno3 fw CTCCGAGATGGAGACAAAGC
Eno3 rev CGTCCAGCTCAATCATGAAC
Ldha fw AGACAAACTCAAGGGCGAGA
Ldha rev CAGCTTGCAGTGTGGACTGT
Mpc1 fw ACTTTCGCCCTCTGTTGCTA
Mpc1 rev AAGTCGTCCTCCCTGAATGA
Mpc2 fw TGTTGCTGCCAAAGAAATTG
Mpc2 rev GCTAGTCCAGCACACACCAA
Dlat fw TCCAAAGCGAGAGAGGGTAA
Dlat rev AGCACCGATTGCCAGAATAC
Pdhx fw ATTCCCAAGGATGTCAGTGC
Pdhx rev CAGCTGGACTTAAGCGGAAC
Got1 fw GCTGACTTCTTAGGGCGATG
Got1 rev TAGCAATAGGGCCGAATGTC
Got2 fw TTGATCCGTCCCCTGTATTC
Got2 rev TTAGGCCGGTGAAACAGAAC
Pck2 Fw GGGGTACCACTGGTGTACGA
Pck2 rev TCTCTCCGGAACCAATTGAC
Glut1 fw TCAACACGGCCTTCACTG
Glut1 rev CACGATGCTCAGATAGGACATC
Glut3 fw TTCTGGTCGGAATGCTCTTC
Glut3 rev AATGTCCTCGAAAGTCCTGC
Glut12 fw ACTATCCCAGCAACCCTCCT
Glut12 rev AAACTCCTCCAGGGACTGGT
Ndufa6 fw GTCACAGACCCCAGAGTGGT
Ndufa6 rev TAACATGCACCTTCCCATCA
Sdha fw ACACAGACCTGGTGGAGACC
Sdha rev GGATGGGCTTGGAGTAATCA
Uqcrc1 fw GACAACGTGACCCTCCAAGT
Uqcrc1 rev ACTGGTACATAGGCGCATCC
Cox8b fw GAACCATGAAGCCAACGACT
Cox8b rev GCGAAGTTCACAGTGGTTCC
Atp5b fw GAGGGATTACCACCCATCCT
Atp5b rev CATGATTCTGCCCAAGGTCT
Cpt1b fw CAGCTGGCTGGTTGTTGTCA
Cpt1b rev TTGTCGGAAGAAGAAAATGC
Pgc1a fw AAGTGTGGAACTCTCTGGAACTG
Pgc1a rev GGGTTATCTTGGTTGGCTTTATG
Cox2 fw CAGTCCCCTCCCTAGGACTT
Cox2 rev TTTCAGAGCATTGGCCATAGAA
Fasn fw AGGATATGGAGAGGGCTGGT
Gene Sense Primer 5'-3'
Acadm fw CTTCGTGTTGTGCCTGTGTT
Acadm rev GCCACTTCTCTCCAGTCACC
Oplah fw CAGGGGGAAAGTAGGAAAGG
Oplah rev CCAGGCTTGTGTGTCTGTGT
Cox6a1 fw TTGCGAGCTTTTCTGGTTTT
Cox6a1 rev GGGCACAACGGAAGAGAATA
Unrelated1 fw AATGCCTCTCACGCTCAACT
Unrelated1 rev AAGTGTGTGCCATCCTTTCC
Pdk3 fw TTCCTTAAAGCCCCGGTAAC
Pdk3 rev GGGAGGTCTAGAGCCCCTAA
Fads1 fw ACGGTGAGAGCGGACAATAG
Fads1 rev ATCCAACCCATGCTTGAGAC
Bmp1 fw GTCTCTGTCGCTGTCCTTCC
Bmp1 rev TTCTCAGCTCGGCTTCTAGC
Wls fw CTGGCTGTGGCTTGTGTAAA
Wls rev GGACAAGAGGCAAAAGCAAC
Unrelated2 fw AGCCAGGGCTACACAGAGAA
Unrelated2 rev AGATTCCTGCACCAAAGTGG
Slc2a1 fw ATCAGAAAGGGACACGGATG
Slc2a1 rev AAATCCTCCCGAGGAAAGAA
Slc2a12 fw CTAGACCCAAATCCCGTTGA
Slc2a12 rev CGCCGAAGAGGAACATTTTA
Hk1 fw AAACTAGGCGGCTTCACAGA
Hk1 rev GGGGACCATGAGCTCTTACA
Eno3 fw GCGGAGAGAGTTACCGAGTG
Eno3 rev TTCCTGCGTGAAGCCTAAGT
Got1 fw CCGCAGTGAGCTTAAAGACC
Got1 rev AGTCGGAAGGTTGTGATTGG
Got2 fw GTAAGACGGCAGTGGATGGT
Got2 rev CTTGCGAGTTTCCATGACCT
Elovl1 fw CAGCCCTTAGTAGGCACAGC
Elovl1 rev CACCCAGCTTCTTCTTGAGG
Supplemental Experimental Procedures
Generation of conditional Lsd1 knock-out and knock-in mice
All experiments were performed in C57/Bl6N background. The targeting strategy for the conditional deletion of the first exon of Lsd1 (Lsd1tm1Schüle) is available upon request (Zhu et al., 2014). Briefly, conditional Lsd1 mice were mated with Ucp1-Cre mice to selectively ablate Lsd1 in brown adipose tissue (Figures S1A and S1B). Homozygous conditional mice were used as controls. Mice were genotyped with primers for detection of conditional Lsd1 alleles and Cre recombinase (Table S3).
Lsd1 knock-in (KI) mice were generated by Taconic [C57BL/6-Kdm1atm2931(K662A, W752A, Y762S)Arte]. The targeting
vector has been engineered as follows (Figure S1F). Wild-type Lsd1 exons 15 to 19, including the complete 3‘ untranslated region (UTR), were flanked by loxP sites. An additional polyadenylation signal (hGHpA: human Growth Hormone polyadenylation signal) was inserted between the 3’ UTR and the distal loxP site in order to prevent downstream transcription of the mutated Lsd1 exons 15 to 19. The size of the loxP-flanked region is 5.1 kb. Exons 15 to 19, including the splice acceptor site of intron 14, were duplicated and inserted downstream of the distal loxP site. Intron 15 was removed from the wild-type and the duplicated region in order to create a fusion of exon 15/16. K662A mutation was introduced into the duplicated exon 15, W752A and Y762S mutations were introduced into the duplicated exon 18. A second hGHpA cassette was inserted downstream of the duplicated 3‘ UTR. Positive selection markers were flanked by FRT (Neomycin resistance) and F3 (Puromycin resistance) sites, and inserted into intron 14 and downstream of the second hGHpA, respectively. The targeting vector has been generated using BAC clones from the C57BL/6J RPCIB-731 BAC library and transfected into the Taconic Artemis C57BL/6N Tac ES cell line. Homologous recombinant clones were isolated using double positive (NeoR and PuroR) selection (in order to increase the efficiency of co-integration of both loxP sites and the point mutations). The conditional KI allele was obtained after Flp-mediated deletion of the selection markers. This allele expresses wild-type Lsd1 protein. The presence of the first hGHpA cassette downstream of the wild-type exon 19 should prevent transcription of the mutated exons 15 to 19. Conditional Lsd1KI/KI mice were crossed to Ucp1-Cre mice to selectively express mutated Lsd1 in brown adipose tissue (Lsd1cKI mice). Homozygous conditional Lsd1KI/KI mice were used as controls. Mice were genotyped with primers for detection of conditional KI alleles and Cre recombinase (Figure S1G and Table S3).
RNA preparation, qRT-PCR, and RNA sequencing (RNA-seq)
RNA was isolated with TRIzol Reagent (Invitrogen) and processed as described (Duteil et al., 2014). Data were analyzed using the standard curve method (Bookout et al., 2006). 36b4, Hprt, or β-actin were used for normalization. Primer sequences are given in Table S4.
RNA samples were sequenced by the standard Illumina protocol to create raw sequence files (.fastq files). We annotated these reads to the mm10 build of the mouse genome using TopHat version 2. The aligned reads were counted with the homer software (analyze RNA) and DEGs were identified using EdgeR and DESeq version 1.8.3. Differentially regulated genes (reads > 50, p < 0.01) were further used for pathway analysis in WebGestalt (Heinz et al., 2010; Wang et al., 2013).
Protein analyses
Western blot analysis, co-immunoprecipitation assays, gel filtration, and mass spectrometry experiments were performed as described (Duteil et al., 2014; Metzger et al., 2016). For gel filtration, brown adipocytes were harvested and suspended in isolation buffer (10 mM HEPES-KOH, pH 7.9, 1.5 mM MgCl2, 10 mM KCl, 0.5 mM
DTT, and complete protease inhibitor cocktail, Roche), allowed to swell on ice for 10 min, and pelleted. Isolated nuclei were resuspended in 20 mM HEPES-KOH, pH 7.9, 25 % glycerol, 420 mM NaCl, 1.5 mM MgCl2, 0.2 mM
EDTA, 0.5 mM DTT, and complete protease inhibitor cocktail, incubated on ice for 20 min and centrifuged at 14,000 r.p.m. for 10 min. Nuclear complexes were separated by gel filtration on a Superose 6TM 10/300 GL column
(GE Healthcare) using the ÄKTA pure 25 system (GE Healthcare). The void volume was 7.2 mL. 60 fractions of 300 µL were collected from an elution volume of 4.8 mL. The gel filtration buffer was composed of 50 mM KCl, 50 mM NaCH3COOH, pH 7.2 including protease inhibitors and phosphatase inhibitors (Roche Diagnostics).
Column calibration was done using carbonic anhydrase (26 kDa), bovin serum albumin (66 kDa), alchol dehydrogenase (150 kDa), b-amylase (200 kDa), apoferritin (443 kDa), and thyroglobulin (669 kDa) as markers according to the method provided by the supplier. Western blot membranes were decorated using following antibodies: anti-Lsd1 [3544 , Schüle laboratory (Duteil et al., 2014), 1/1000], anti-Ucp1 (Abcam, ab10983, 1/1000), anti-Apoe (Santa Cruz, M-20, 1/200), anti-Nrf1 (Abcam, ab55744, 1/500), anti-Hdac1 (Abcam, ab7028-50, 1/1000), anti-Hdac2 (Santa Cruz, sc-7899, 1/2500), anti-Rcor1 (Abcam, ab32631, 1/400), anti-Rcor3 (Abcam, ab76921, 1/2000), anti-Arid1a (Santa Cruz, sc-373784, 1/200), anti-phosphoAcc (Cell signaling, 11818, 1/1000), anti-Acc (Cell signaling, 3676, 1/1000), anti-b-Tubulin (Sigma, T6074, 1/10000), and anti-b-Actin (Sigma, A1978, 1/10000). Secondary antibodies conjugated to horseradish peroxidase (GE Healthcare) were detected using an enhanced chemiluminescence detection system (GE Healthcare). For immunoprecipitation assay, 500 mg of
protein extracts were incubated with 5 µg of anti-Lsd1 (Sigma, L-4481) and processed as described (Metzger et al., 2010). Mass spectrometry experiments were performed as described (Metzger et al., 2016). Lsd1 antibodies used for immunoprecipitation were Sigma L-4481 (Ab3 in Figure S3F), and the two Lsd1 antibodies 20752 and 3544 (Ab1 and Ab2 in Figure S3F, respectively) that we previously characterized (Duteil et al., 2014). The number of peptides obtained for each protein after Lsd1 immunoprecipitation was subtracted from the number of peptides obtained with IgG. The resulting number was then normalized to the number of Lsd1 peptides on a log2 basis. The calculation of log2-value is presented in Table S2. GO cellular component analysis was performed using the Panther algorithm (Ashburner et al., 2000).
Primary cell isolation and cell culture
BAT was cut in small pieces and incubated with 2 mg/ml collagenase I (CLS-1, Worthington) for 45 min. The cell suspension was filtered through a 150 µm nylon mesh and the stromal-vascular fraction (SVF) was isolated by low-speed centrifugation. For FACS analysis, the erythrocyte-free SVF was incubated with a mix of antibodies against different surface markers as described previously (Duteil et al., 2014; Wu et al., 2012) and sorted using an Aria flow cytometer (BD Biosciences). Dead cells were removed using DAPI staining (1/10000). Primary adipocytes were cultured in DMEM High Glucose containing 20 % fetal calf serum (FCS) and 2 % of 1 M Hepes buffer in dishes coated with collagen. Alternatively, preiBA cells were cultured in DMEM containing sodium pyruvate and glutamine (GIBCO 11995-065) supplemented with 10 % FCS. Differentiation of primary adipocytes and preiBA cells was induced by treatment of confluent cells with an adipogenic mixture consisting of 850 nM insulin (Gibco), 1 µM dexamethasone (Calbiochem), 1 µM rosiglitazone (Cayman), 125 nM indomethacin (Sigma), 1 nM T3 (Sigma), and 500 µM isobutylmethylxanthine (Serva) in the presence of 10 % FCS. The differentiation medium was replaced 2 days later with medium supplemented with 10 % FCS, 850 nM insulin, and 1 nM T3 for 2 days. Subsequently, cells were cultured in the same medium for 4 more days and considered as differentiated. Differentiated cells were transfected with 1 mM siRNA against Lsd1, Nrf1, Rcor1, Rcor3, or unrelated control (Invitrogen) using Lipofectamine RNAimax (Invitrogen) according to the manufacturer’s instructions. siRNA oligonucleotide sequences were as follows:
Lsd1 siRNA: 5’-CCCAAAGAUCCAGCUGACGUUUGAA-3’; Nrf1 siRNA: 5’-UAUGGUAGCCAUGUGUUCAGUUUGG-3’; Rcor1 siRNA: 5’-GCGCAGUCAAGAACGAGACAAUCUU-3’; Rcor3 siRNA: 5’-UCCCAGAUGCCAAAUUGGAUGAAUA-3’;
unrelated control siRNA: 5’-UUCUUAGCAAGACUGGUCUCUAGGG-3’.
Lsd1 inhibitor QC6688 was applied to differentiated cells at 100 nM (in EtOH) for 3 days. EtOH was used as a vehicle. Brown adipocytes were either harvested and snap-frozen for RNA, protein, and chromatin immunoprecipitation experiments, fixed for 1 h with 4 % PFA and stained with Oil Red O, or fixed for 5 min with 1 % PFA for chromatin immunoprecipitation experiments (see bellow).
Chromatin immunoprecipitation (ChIP) and ChIP sequencing (ChIP-seq)
Chromatin immunoprecipitation experiments were performed using Lsd1 (20752, Schüle laboratory), anti-Nrf1 (Abcam, ab55744), anti-Rcor1 (Abcam, ab32631), anti-Rcor3 (Abcam, ab76921), H3K9me2 (Diagenode, Mab-154-050), or H3K4me2 (Diagenode, CS-035-100) antibodies, or a rabbit IgG negative control on protein G-Sepharose 4B (GE Healthcare) essentially as described (Metzger et al., 2008). For ChIP experiments, ChIPed DNA was processed by qPCR analyses with the primers described in Table S5. For ChIP-seq analysis, libraries were prepared from Lsd1-immunoprecipitated DNA according to standard methods. ChIP-seq libraries were sequenced using a HiSeq 2000 (Illumina) and mapped to the mm10 reference genome using bowtie 2 (Langmead et al., 2009). Data were analyzed using the peak finding algorithm MACS 1.41 (Zhang et al., 2008) using input as control. All peaks with a FDR greater than 0.3 % were excluded from further analysis. The uniquely mapped reads were used to generate the genome-wide intensity profiles, which were visualized using the IGV genome browser (Thorvaldsdottir et al., 2012). HOMER (Heinz et al., 2010) was used to annotate peaks, to calculate overlaps between different peak files, and for motif searches. The genomic features (promoter, exon, intron, 3’ UTR, and intergenic regions) were defined and calculated using Refseq and HOMER.
Histological and immunofluorescence analysis
Tissues were fixed in 10 % buffered formalin and embedded in paraffin. 5 µm paraffin sections were deparaffinised and rehydrated. Hematoxylin and eosin staining was performed as described (Duteil et al., 2014). For immunofluorescence analyses, rehydrated sections were boiled in antigen unmasking solution (Tris buffer pH 9) for 20 min, cooled to room temperature, washed 3 times with PBS, 0.1 % Triton-X100 for 5 min, blocked for 1 h in 5 % FBS (Gibco, 10270-106) in PBS, 0.1 % Triton-X100, and incubated overnight at 4°C with anti-Lsd1 (1/1000), anti-Ucp1 (Abcam, ab10983, 1/500), or anti-Perilipin (Abcam, ab3526, 1/400) antibodies. Slides were
medium (Fluoromount-G, SouthernBiotech, 0100-01) with DAPI (Sigma, D-9542, 1/1000). Ultrastructural analyses were performed as described (Duteil et al., 2014).
Measuring activities of metabolic enzymes
Glucose uptake, hexokinase, phosphofructokinase, enolase, lactate dehydrogenase, glutamate oxaloacetic transaminase, NAD+/NADH ratio, hormone-sensitive lipase, LPL, and fatty acid synthase activities were assessed
by the Glucose Uptake Assay Kit (ab136955, abcam), Hexokinase Colorimetric Assay Kit (MAK091, Sigma), the Phosphofructokinase Colorimetric Assay Kit (MAK093, Sigma), the Enolase Activity Colorimetric/Fluorometric Assay Kit (K691-100, Bio Vision), the Lactate Dehydrogenase Activity Assay Kit (Sigma, MAK066), the Glutamate-oxaloacetate transaminase kit (K753-100, Bio Vision), the NAD/NADH Assay Kit (ab65348, abcam), the Lipase Activity Assay Kit (MAK046, Sigma), the LPL Activity Assay kit (MAK109, Sigma), and Fatty Acid Synthase ELISA kit (ABIN425666, antibodies-online), respectively. All activities were measured using 20-50 mg of BAT according to the manufacturer recommendations.
Metabolomic and lipidomic analyses
Tissue samples were grinded with a Retsch MM440 instrument and further extracted as described in (Giavalisco et al., 2009). LC-MS measurements were performed using a Waters ACQUITY UPLC system coupled to a Thermo-Fisher QExactive mass spectrometer. Lipophilic compounds were separated using a C8 and hydrophilic compounds using a C18 reverse phase column, respectively. The mobile phase composition and electrospray parameters are described in (Giavalisco et al., 2009). Chromatograms were recorded in survey MS mode (Mass Range [100 - 1500]) for hydrophilic compounds and in DDA MS/MS (40 eV collision energy) mode for lipophilic compounds. GC-MS measurements were performed as follows. An aliquot of lower polar extraction phase was dried and the dry residue was sequentially derivatized by methoxyamine/MSTFA and injected onto DB35 GC column (Agilent Technologies GC machine) coupled to Leco Pegasus HT mass spectrometer with EI ionization source. Gas elution was performed for two minutes at 85 °C with a further temperature gradient of 15 °C per minute untill a final temperature of 360 °C was reached.
Peak-picking and background removal of the LC-MS data from measurements of hydrophilic extraction phase was accomplished with the Genedata REFINER MS® 7.5 software. Chromatogram alignment and filtering were completed using in-house R-based software. Filtering included removal of isotopic peaks, in-source fragments, and additional lower intense adducts of the same analyte. The annotation of the content of the sample was accomplished by matching the extracted data from the chromatograms with our library of reference compounds in terms of accurate mass and retention time, and the most abundant adduct was used for relative quantification of a metabolite. For GC-MS data of the same extraction phase NetCDF files were exported from the Leco Pegasus software to “R”. The package TargetSearch was used to transform retention time to retention index (RI), to align the chromatograms, extract the peaks, and annotate them by comparing the spectra and the RI to the Golm metabolome database. A unique mass was used to relatively quantify each identified metabolite. For those metabolites, which were annotated in both GC-MS and LC-MS data the value with smallest deviation was kept. Peak-picking of the LC-MS/MS data from measurements of the lipophilic extraction phase was accomplished with the Genedata REFINER MS® 7.5 software without alignment. Identification of lipid species was performed using output.mgf files with dedicated in-house R-based software. Acyl composition of di- and triacylglycerols was established from the [Acyl + NH4] neutral loss in positive ion mode using a pre-formed library of accurate masses for all possible precursor and fragment peaks.
Mitochondrial respiration
10 mg (wet weight) of BAT were minced and incubated in Mir05 with 50 µg/mL Saponin for 30 min at 37 °C to permeabilize the cell membrane. Mir05 is composed of 0.5 mM EGTA, 3 mM MgCl2, 60 mM K-lactobionate, 20
mM Taurine, 10 mM KH2PO4, 20 mM HEPES, 110 mM Sucrose, and 1 g/L BSA fatty acid free. Respiration of
permeabilized brown adipocytes was measured by high-resolution respiratory using Oxygraph-2K (OROBOROS INSTRUMENTS, Innsburk, Austria) at 37 °C in 2 mL glass chambers. For each experiment, one control mouse and one Lsd1cKO mouse were processed in parallel in the 2 chambers. Mitochondrial respiration was assessed in
Mir05 buffer supplemented with 5 mM glutamate and 2 mM malate substrates to activate mitochondrial complex I. After stabilization of mitochondrial respiration, 10 mM succinate were added to activate complex II. Maximal respiration rate was then recorded. 0.5 µM rotenone were finally added to inactivate mitochondrial complex I and measure complex II specific activity. Respiration rates were expressed in pmol / s and reported to 1 mg of tissue. Results presented correspond to maximal mitochondrial respiration rate. Alternatively, mitochondrial respiration was analyzed using 100 µM palmitoyl-L-carnitin as substrate.
Supplemental References
Ashburner, M., Ball, C.A., Blake, J.A., Botstein, D., Butler, H., Cherry, J.M., Davis, A.P., Dolinski, K., Dwight, S.S., Eppig, J.T., et al. (2000). Gene ontology: tool for the unification of biology. The Gene Ontology Consortium. Nat Genet 25, 25-29.
Bookout, A.L., Cummins, C.L., Mangelsdorf, D.J., Pesola, J.M., and Kramer, M.F. (2006). High-throughput real-time quantitative reverse transcription PCR. Curr Protoc Mol Biol Chapter 15, Unit 15 18.
Duteil, D., Metzger, E., Willmann, D., Karagianni, P., Friedrichs, N., Greschik, H., Gunther, T., Buettner, R., Talianidis, I., Metzger, D., et al. (2014). LSD1 promotes oxidative metabolism of white adipose tissue. Nat Commun 5, 4093.
Giavalisco, P., Kohl, K., Hummel, J., Seiwert, B., and Willmitzer, L. (2009). 13C isotope-labeled metabolomes allowing for improved compound annotation and relative quantification in liquid chromatography-mass spectrometry-based metabolomic research. Anal Chem 81, 6546-6551.
Heinz, S., Benner, C., Spann, N., Bertolino, E., Lin, Y.C., Laslo, P., Cheng, J.X., Murre, C., Singh, H., and Glass, C.K. (2010). Simple combinations of lineage-determining transcription factors prime cis-regulatory elements required for macrophage and B cell identities. Mol Cell 38, 576-589.
Langmead, B., Trapnell, C., Pop, M., and Salzberg, S.L. (2009). Ultrafast and memory-efficient alignment of short DNA sequences to the human genome. Genome Biol 10, R25.
Metzger, E., Imhof, A., Patel, D., Kahl, P., Hoffmeyer, K., Friedrichs, N., Müller, J.M., Greschik, H., Kirfel, J., Ji, S., et al. (2010). Phosphorylation of histone H3T6 by PKCbeta(I) controls demethylation at histone H3K4. Nature 464, 792-796.
Metzger, E., Willmann, D., McMillan, J., Forne, I., Metzger, P., Gerhardt, S., Petroll, K., von Maessenhausen, A., Urban, S., Schott, A.K., et al. (2016). Assembly of methylated KDM1A and CHD1 drives androgen receptor-dependent transcription and translocation. Nat Struct Mol Biol 23, 132-139.
Metzger, E., Yin, N., Wissmann, M., Kunowska, N., Fischer, K., Friedrichs, N., Patnaik, D., Higgins, J.M., Potier, N., Scheidtmann, K.H., et al. (2008). Phosphorylation of histone H3 at threonine 11 establishes a novel chromatin mark for transcriptional regulation. Nat Cell Biol 10, 53-60.
Thorvaldsdottir, H., Robinson, J.T., and Mesirov, J.P. (2012). Integrative Genomics Viewer (IGV): high-performance genomics data visualization and exploration. Brief Bioinform.
Wang, J., Duncan, D., Shi, Z., and Zhang, B. (2013). WEB-based GEne SeT AnaLysis Toolkit (WebGestalt): update 2013. Nucleic Acids Res 41, W77-83.
Wu, J., Bostrom, P., Sparks, L.M., Ye, L., Choi, J.H., Giang, A.H., Khandekar, M., Virtanen, K.A., Nuutila, P., Schaart, G., et al. (2012). Beige adipocytes are a distinct type of thermogenic fat cell in mouse and human. Cell 150, 366-376.
Zhang, Y., Liu, T., Meyer, C.A., Eeckhoute, J., Johnson, D.S., Bernstein, B.E., Nusbaum, C., Myers, R.M., Brown, M., Li, W., et al. (2008). Model-based analysis of ChIP-Seq (MACS). Genome Biol 9, R137.
Zhu, D., Holz, S., Metzger, E., Pavlovic, M., Jandausch, A., Jilg, C., Galgoczy, P., Herz, C., Moser, M., Metzger, D., et al. (2014). Lysine-specific demethylase 1 regulates differentiation onset and migration of trophoblast stem cells. Nat Commun 5, 3174.