Rhythmic characteristics of voice between and
within languages
Volker Dellwo1 and Adrian Fourcin2
1
Phonetisches Laboratorium der Universität Zürich 2
Speech, Hearing and Phonetic Sciences, University College London
Die vorliegende Studie untersuchte die Rolle von stimmhaften Intervallen (d.h. Intervalle laryngaler Aktivität) rhythmische Charakteristika im Sprachsignal zu kodieren. Die Dauercharakteristika stimmhafter und stimmloser intervalle (%VO, deltaUV, VarcoUV, VarcoVO, n-PVI_VO, r-PVI_UV) wurden analysiert. Aufgrund der untersuchten Sprachen konnten wir zeigen, dass stimmhafte Dauercharakteristika effektiv zu einer Klassifizierung von Sprachen führen, die einer auditorischen Klassifizierung der Sprachen in Rhythmusklassen (akzentzählend, silbenzählend) entspricht. Weiterhin fanden wir Variation zwischen den Sprechern einer Sprache (Deutsch). Wir argumentieren, dass unsere Methode direkt verwandt mit der möglicherweise auditiv hervortretensten Komponente der menschlichen Stimme (das Stimmsignal) ist. Methodische Vorteile sind, dass die stimmlichen Dauercharakteristika verlässlich automatisch aufgrund des Stimmsignals berechnet werden können. Implikationen unserer Befunde zum Erwerb prosodischer Phänomene und zur Wahrnehmung von Sprache durch Neugeborene werden diskutiert.
1. Introduction
In this paper we report on work-in-progress about the contribution of voice-timing to the rhythmic organisation of speech, in particular about the durational variability of voice patterns between different languages. Our working hypothesis is that durational aspects of voiced and voiceless intervals are highly salient in terms of our perception of speech rhythm. In sections 2 and 3 the paper contains a revised version of results published previously in electronic form (Fourcin and Dellwo, 2009). In section 4 we report on within-language (speaker individual) variability of voiced and unvoiced interval characteristics.
Why do we believe that durational characteristics of voiced intervals and intervals combining unvoiced plus silence play a role in the organization of speech rhythm? The acoustic cues of speech rhythm are to date not very well understood. Early studies on speech rhythm (James, 1929; Pike, 1945; Abercrombie, 1967) proposed the hypothesis that languages vary in their perceptual rhythmic characteristics. Some languages like English or Arabic were thought to sound rather irregularly timed (similar to the irregular timing patterns of Morse code; hence: Morse-code rhythm; James, 1929) other languages, like French or Yoruba, to sound more regularly timed (similar to the regularity of bullet sounds from a machine-gun; hence: machine-gun rhythm; James, 1929). At a later stage this terminology was
relabelled into stress-timed and syllable-timed rhythm respectively as it was believed that in stress-timed languages inter-stress intervals (intervals between two stressed syllables) are regularly timed and in syllable-timed languages the syllables of a speech signal are of similar durations (isochrony-hypothesis; Pike, 1945; Abercrombie, 1969). The rationale for the percept of irregularity in Morse-code languages is probably motivated by the fact that stressed syllables can be expected to be of a higher duration than unstressed syllables. Additional durational variability occurs when the criterion of equal inter-stress intervals is met as there are different numbers of syllables between the stressed syllables that need to be adjusted in duration to meet the overall interval duration. In summary, according to the isochrony-hypothesis it seems plausible that the percept of rhythmic regularity in speech (machine-gun and Morse code rhythm) is created by more or less regular syllabic durations in different languages. About 30 years of research, however, between the 1960th and the 1990th have not found acoustic evidence for this hypothesis (Dauer, 1983, 1987; Bolinger, 1981; Roach, 1982). One of the major shifts in studies of speech rhythm after the 1990th was therefore the change of focus from the syllable as a unit of analysis to consonantal (C-) and vocalic (V-) intervals. Ever since it has been demonstrated repeatedly that a variety of global durational characteristics of these intervals (mainly related to their
variability) can separate languages of different rhythmic classes (Ramus et
al., 1999; Grabe and Low, 2002). For example, syllable-timed languages
typically have a higher standard deviation of C-intervals (deltaC) and a lower percentage of time over which speech is vocalic (%V) than
stress-timed languages (Ramus et al., 1990). Syllable-timed languages also reveal
higher average differences between consecutive C- and V-intervals, measured by the Pairwise Variability Index (PVI; Grabe and Low, 2002). Variants of these measures were developed for the analysis of speech, revealing rate variability, as, for example, the coefficient of variation of C- and V-interval durations (VarcoC, see Dellwo, 2006; VarcoV, see White and Mattys, 2007). In many respects these more recent measures are similar (sometimes identical) to measures that have been used previously for analysing durational variability of syllables, like the standard deviation of syllabic or foot durations — which were not found to reveal differences between stress- and syllable-timed languages (Roach, 1982).
Measures based on durational C- and V-interval characteristics of speech, however, are not without problems. To a certain degree results can be replicated, like the finding that %V is higher in Italian than it is in German, for example. The authors are not aware of a dataset showing contradictory results. However, whether languages can be categorised into so called stress- and syllable-timed languages is a matter of heavy debate and there is evidence showing that there is strong systematic variability within
languages as a function of speaker or sentence, for example (Wiget et al., 2010; Yoon, 2010) and that different languages can contribute to different rhythmic classes depending on the measures used (Arvaniti, 2012). In addition the hypothesis of whether languages can be classified into different rhythm classes on an auditory basis has often been questioned. All in all this means that the concept of rhythm classes must be taken with caution. For simplicity reasons we have stayed with the terminology in the present paper.
As discussed above, in the present research we concentrate on a different unit that contributes to the temporal organization of speech: we use the durations of voiced (VO-) and unvoiced (UV-) intervals in the speech signal. Voiced intervals between the on- and offset of consecutive glottal activity. Unvoiced intervals are intervals between the offset of glottal activity and the onset of the following glottal activity. The main difference between this choice of intervals and C-and V-intervals is that all voiced consonants are part of the VO-intervals and only unvoiced consonants and the silences they contain will make up the UV-intervals. This distinction does not rely on any linguistic knowledge about the language and can be based entirely either on the acoustic signal or the output from an electrolaryngograph. What are the advantages in using VO-/U intervals rather than C- and V-intervals? There are mainly two reasons motivating this work, (a) a practical or methodological reason and (b) a perceptual reason. In regard to (a): it has been shown in the past that measurements of C- and V-interval durations are labour consuming since interval durations need to be manually labelled or at least corrected. Fast automatic algorithms have been shown to be very error prone. Techniques based on forced alignment have been used but these, once more, require a transcription of the spoken data to be reliable. This again is time consuming and indeed only feasible if the recorded material is the same across speakers. An analysis based on VO- and UV-intervals can be performed fully automatically because it relies on acoustic information alone. This can be achieved on the basis of a fundamental frequency analysis of the acoustic signal or, even more reliably, using a signal directly derived from vocal fold vibration (e.g. with an electro-laryngograph). Both methods have been applied and compared in the present study. With respect to (b): behavioural experiments have shown that adult human listeners (Ramus and Mehler, 1999), as well as
newborns (Nazzi et al., 1998; Ramus, 2002), monkeys (Ramus et al., 2000,
Rincoffet et al., 2005), and rats (Toro et al., 2003) can distinguish between
languages from different rhythmic classes on the basis of the durational characteristics of C- and V-intervals. The perceptual tasks in these experiments were typically performed with [sasasa] delexicalised speech type tokens, in which all C-intervals were turned into [s] sounds and all V-intervals into [a]. Listeners were thus given cues about the exact durations
of C- and V-intervals. In the present paper we argue that listeners without any linguistic knowledge of the language (such as infants, monkeys, or rats) may have difficulty making these distinctions between C- and V-intervals in real speech, in particular when 'consonantal' is attributed to segments which reveal acoustically similar features to vowels (e.g. approximants and nasals). Additionally it happens frequently that consonantal features in clear speech are reduced to short V- intervals. A voiced fricative between two vowels may lose all its frication and become more vowel like. We therefore conclude that if listeners make use of interval durational features in speech rhythm classification, these intervals will be highly influenced by whether they are physically voiced or voiceless.
The rationale for choosing VO und UV intervals as rhythmical units is very similar to that underlying the choice of C- and V-intervals: Speech rhythm is partly a product of the phonotactic structure of a language (Bolinger,
1981; Dauer, 1983, 1987; Roach, 1983; Ramus et al., 1999; Grabe and Low,
2002). For C- and V- intervals this means that languages using less complex consonant clusters (e.g. French and Italian) show less durational C- and V- variability than languages employing a more complex syllable structure with C-intervals often consisting of consonant strings. A similar situation is possible for VO- and UV- intervals. Languages with a simple syllable structure could be typified by single consonant UV- intervals, whilst languages with a complex syllable structure would have multiple consonant UV- intervals. For this reason we may detect proportionally similar differences of C-intervals and UV-interval variability between languages of different rhythmic class (monitored for example by deltaC, rPVI and %V). For measures of V- interval variability like deltaV and nPVI the situation is less clear. It has been argued that both these measures may be
influenced by vocalic reduction (Ramus et al., 1999, for deltaV and Grabe
and Low, 2002, for nPVI). Canonical syllable-timed languages typically do not reveal vocalic reductions which is why they show less durational V-interval variability than canonical stress-timed languages in which vowels in unstressed positions are typically reduced in quality and duration (e.g. English or German). In VO- interval measurements, however, V- intervals which are separated by voiced consonants will appear only as long voiced stretches and full and reduced vowels will in such cases be connected by the physical continuity of vocal fold vibration in these consonants. It is unclear whether the vocalic reductions present in some of the components of the voiced interval would still be salient enough to influence the overall variability of such intervals.
In Dellwo et al. (2007) we presented the first results of this analytic
approach. We applied the percentage over which speech is vocalic (%V) and the rate normalised standard deviation of C-interval durations (deltaC) to voiced and voiceless stretches in speech and calculated the percentage
over which speech is voiced (%VO) and the standard deviation of unvoiced intervals (deltaUV). We showed that the stress-timed languages English and German differ significantly from syllable-timed French and Italian according to these voice dimensions. The aim of the present research was to extend this analysis to other datasets and a wider range of measures. We have now also looked at the variability of VO-intervals by calculating measures that were previously used to capture the variability of V-intervals, like deltaV and nPVI. Additionally we have now also looked at rate normalised variants of the measures that have been shown to correlate with speech rate (varcoC, varcoV; see Dellwo, 2006; White and Mattys, 2007). In doing this we have addressed the following two questions:
(a) How do rhythmical measurements of UV- and VO-intervals compare to their C- and V- interval peers in distinguishing languages of different rhythm classes?
We sought to answer this question by comparing the results of measurements of durational C- and V- interval characteristics with the results of measurements of UV- and VO- intervals for the same speech material. The material used for this part of the study came from sentences produced in isolation in languages classified as stress-, syllable- and mora-timed languages. These sentences were compiled for one of the key studies on speech rhythm measures
(Ramus et al., 1999) and then served subsequently as a basis for a
number of follow up studies (e.g. Rincoff et al., 2005; Toro et al.,
2003).
(b) Can rhythm-class specific characteristics of VO- and UV-intervals be derived from larger unedited speech recordings automatically? This second question was addressed by recording and measuring a larger set of spoken material from 3 speakers in 4 different stress- and syllable-timed languages using an electrolaryngograph. This method provided us with direct access to what is ordinarily heard as “voicing” and gives a more reliable basis for the detection of periodic vocal fold activity, henceforward 'voice', and gave a robust basis for an automatic analysis of VO- and UV- patterns.
(c) Is there within-language variability of durational characteristics of VO- and UV-Intervals?
This point was addressed by analysing 15 speakers of German from
2. Comparing measurements based on consonantal and vocalic intervals with measurements based on voiced/voiceless intervals
In a first step we adopted the measurements developed by Ramus et al.
(1999), %V and deltaC, and the measurements developed by Grabe and Low (2002), nPVI and rPVI and applied them to voiced and voiceless intervals (VO and UV intervals). The newly derived measurements are thus called:
• %VO: The percentage of time over which speech is voiced • deltaUV: The standard deviation of voiceless intervals.
• nPVI-VO: The rate normalised average differences between
consecutive voiced intervals.
• rPVI-UV: The non-rate normalised average differences between consecutive unvoiced intervals.
In the following section 2.2, we calculate and compare the above measures along with their original CV peers (%V, deltaC, nPVI, and rPVI) to test whether they are equally well suited to distinguish rhythm classes.
2.1
Data and measurement procedures
The dataset used for this part of our work is the same as in Ramus et al.’s
(1999) study on rhythmic differences between languages. This was based on the use of eight languages, two stress-timed languages (English and Dutch), three syllable-timed languages (French, Italian, and Spanish), one mora-timed language (Japanese) and two languages for which expert listeners dispute the classification (Polish and Catalan). The speech material in this database consists of four speakers per language reading five sentences (no repetitions). Sentences were normalised for speech rate by selecting examples of roughly 15 syllables and 18 seconds duration across all languages. For the present study Polish and Catalan were not included because their rhythmic class attributes are unclear.
To measure durational characteristics of VO- and UV-intervals each sentence was analysed automatically using Praat (Boersma, 2001). The sentence recordings were in one file each and had no pause preceding or following the signal. In a first pass, fundamental frequency periods were identified by using Praat's 'PointProcess' method. Any interval between two consecutive f0 markers larger than 20 ms was labelled 'unvoiced' (UV), sequences of f0 markers less then 20 ms apart were labelled 'voiced' (VO). This was done automatically by using Praat's To TextGrid (VUV) function. Due to the erroneous detection of periodic content during aperiodic parts of the signal (e.g. during voiceless fricatives) sometimes voiced periods of
very short duration were mis-labelled by the algorithm. For this reason, results from the automatic labelling procedure were corrected manually.
2.2
Results and Discussion
The results for all measures specified above are summarised in Figure 1 where the mean and the standard error (+-1) are plotted for the three rhythm classes (1 = stress-timed, 2 = syllable-timed, 3 = mora-timed) for each measure. Inferentially we tested the variability between groups for each measure with a one-way ANOVA using 'rhythm class' as a fixed factor.
Figure 1: Mean values with standard errors (+-1) for the Ramus et al. (1999) measures top and the Grabe and Low (2002) measures bottom. These measurements are based on the Ramus-corpus.
Differences between individual groups were revealed by Tukey’s post-hoc test of 'rhythm class’. A comparison between %V and %VO shows that %VO is on average around 30% higher than %V in each rhythm class; however, for both measures mora-timed languages reveal the highest values and stress-timed languages the lowest with syllable-timed languages somewhere in between. This effect is significant for both %V (F[2, 19]=52.0, p<.001) and %V0 (F[2, 19]=52, p<.001). Post-hoc analysis of the data reveals highly significant differences for each group comparison. The measurements deltaC and deltaUV show a similar pattern.
While the absolute measurements are rather similar between deltaC and deltaUV for each rhythm class, the general pattern, according to which stress-timed languages reveal the highest variability followed by syllable- and then by mora-timed languages, is persistent. The effect is highly significant for deltaC (F[2, 19]=17.1, p<.001) and significant for deltaUV (F[2, 19]=3.6, p=.03). This post-hoc analysis shows that all groups differ highly significantly in the case of deltaC and deltaUV (p for each group comparison <.005). For the nPVI comparison the pattern is rather different. While nPVI (V) is highest for stress-timed languages and lowest for mora-timed Japanese, the nPVI (UV) is highest for syllable mora-timed languages. For the nPVI (V) the effect is highly significant (F[2, 19]=30.8, p<.001); however, in the post-hoc analysis the syllable-timed group does not differ from mora-timed Japanese (p=.45). For the nPVI (VO) the effect is not significant (F[2, I9]=1.3, p=.28). In the case of rPVI (C) we find that stress-timed languages have the highest rPVI and mora-timed languages the lowest. This effect is highly significant (F[2, 19]=15.6, p<001) and post-hoc we found that all groups differ from each other significantly. Descriptively we can see in Figure 1 that this trend also exists for rPVI (UV). The ANOVA shows that there are significant group differences (F[2, 19]=5, p=.008); however, post-hoc we only find significant differences between groups 1/3 (p=.008) and 2/3 (p=.01).
2.3
Discussion
In summary, the results show that for the dataset used in Ramus et al.
(1999), %VO and deltaUV are equally powerful in distinguishing between the three rhythm-classes as their CV peers %V and deltaC. This result is in accordance with the results from our previous study where we found that stress-timed English and German vary significantly from syllable-timed French and Italian according to a speech rate normalised version of deltaUV, the varcoUV (see Dellwo, 2006, and White and Mattys, 2007, for the concept of the ‘varco’).
In the case of nPVI the data revealed that measurements based on VO- and UV- intervals show a different pattern from C- and V-interval measures. The
variability of UV-intervals is higher in syllable-timed languages than in stress-timed languages, while the V-interval measure is lower in syllable- as compared to stress-timed languages (which is the expected pattern, see Grabe and Low, 2002). In the following section we show the results of processing a number of other measures capturing V- and VO- interval variability to study whether this effect can be replicated.
3. Studying less constrained data
For our second dataset, speech from two stress-timed (English and German) and two syllable-timed languages (French and Spanish) was recorded using an electrolaryngograph (Fourcin and Abberton, 2008). This technique monitors vocal fold contact conductance during phonation via two electrodes which are applied to either side of the speaker’s thyroid cartilage. The current flow over time (Lx waveform) provides a robust indication of the physical presence or absence of voicing. The same USB Laryngograph Ltd. laptop data acquisition system was used throughout in all countries.
3.1
Data gathering and measurement procedures
Three speakers were recorded for each language, reading a set of five different texts, one longer text (about 400 words in each language) and 4 shorter texts (about 55 words each). All texts were translations into the languages from common English themes. One of the short texts was the
BonnTempo reading text (Dellwo et al, 2004); the three other short texts
were taken from the EUROM Database (Chan et al., 1995). The longer text is
The story of Arthur the Rat in a version designed to avoid the use of character voices.
Before recordings took place, speakers were asked to familiarise themselves with the texts by reading the set in silence. They were then instructed to read all texts in a way they consider normal in their native language. Speakers were asked to re-read a sentence in the event that they realised they had made a mistake or had a major hesitation. Such incomplete sentences were subsequently deleted from the final recording. Small hesitations were rare and were not edited. Both the laryngograph waveform (Lx) and the acoustic signal were recorded, each in one channel of a stereo file. Speakers were recorded in different places in a quiet environment.
To analyse the speech content only, reading pauses that typically occur between intonation phrases had to be removed. This was done by, first, extracting the intensity contour of the acoustic speech waveform (Praat function: 'To intensity...') and, second, by identifying all regions in this
intensity contour which are 25dB below the peak intensity and have a minimum duration of 100 ms. These regions were identified as speech pauses and automatically labelled using Praat's 'To TextGrid (silences)' function. Only speech between two pauses (inter-pause interval, henceforth: IPI) was included in the analysis.
The VO- and UV-intervals were detected automatically in the same way as in the Ramus-corpus (see above); however, this time the detection of fundamental period markers was not based on the acoustic speech signal but on the laryngograph waveform (Lx waveform). This method is more robust than methods based on acoustic signals and thus erroneous detection of voicing in aperiodic signals did not occur.
Some of the IPIs consisted only of one VO- and one UV- interval and standard deviations cannot be calculated for these numbers. We therefore only included IPIs containing at least 2 VO-intervals and 2 UV-intervals. An average of 28 (+-7) IPIs were excluded from the analysis because of this constraint. The total number of IPIs per language were (number of IPIs in brackets): English (209), French (205), German (475), and Spanish (253). The average number of VO- and UV-intervals per IPI in each language were: English (13.3), French (15.0), German (16.1), and Spanish (17.7). The proportional standard deviation of each of these mean values (coefficient of variation) was 24.2% (+-4). This implies that the total number of VO- and UV-intervals was drastically higher in German than in any other language and the figures confirm this: English (2603), French (2929), German (7075), and Spanish (4203). Given these figures the possibility arose that the high number of German intervals may be an artefact of the automatic processing. For this reason all IPI intervals were checked manually — whether (a) they were correct IPIs in the sense of containing speech between two pauses and (b) whether the automatic voiced/voiceless labelling produced intervals corresponding to the respective regions in the laryngograph (and acoustic) signal. It was found that the automatic procedures worked correctly and that German speakers simply produce a much larger number of VO-/UV-intervals for reading material of comparable length. A comparison between the individual speakers revealed that this not a result of a particular individual but that pauses are pretty evenly distributed across speakers.
3.2
Measurements
In section 2 the data was analysed using the classic rhythm measures %V, deltaC, and the n and r PVI. In this part of our work we used data that had not been labelled according to C- and V-interval durations, thus we only applied the rhythm measures to VO- and UV-intervals.
Previous research revealed that in particular measures based on the standard deviation of interval durations (deltaX) correlate strongly with speech rate (Dellwo, 2006; White and Mattys, 2007). This is also true for the non-normalised consonantal rPVI (see White and Mattys, 2007, and Dellwo, 2010). This is of special importance for the present analysis since we are dealing with non-rate-controlled speech. For this reason we have also included the rate normalised versions of these measures:
• VarcoUV (in analogy to varcoC, Dellwo, 2006): The coefficient of variation of voiceless interval durations.
• nPVI-UV: A rate normalised version of the rPVl-UV using the same rate normalisation procedure as presented for the nPVI in Grabe and Low (2002).
We further included deltaV, the standard deviation of vocalic intervals
which has led to ambiguous results in previous studies (Ramus et al.; 1999,
Ramus, 2003). We wanted to know how such a measure would behave when it is applied to VO-intervals. So we added the measure:
• delta VO (in analogy to Ramus et al., 1999): The standard deviation
of voiced interval durations.
In addition we added the rate normalised version of this measure:
• VarcoVO (in analogy to varcoV, White and Mattys, 2007): the coefficient of variation of voiced interval durations.
3.3
Results and Discussion
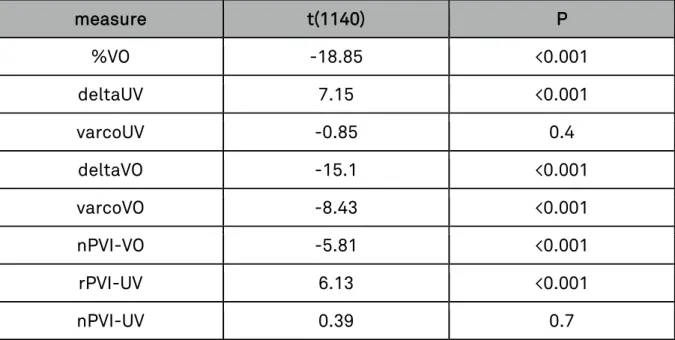
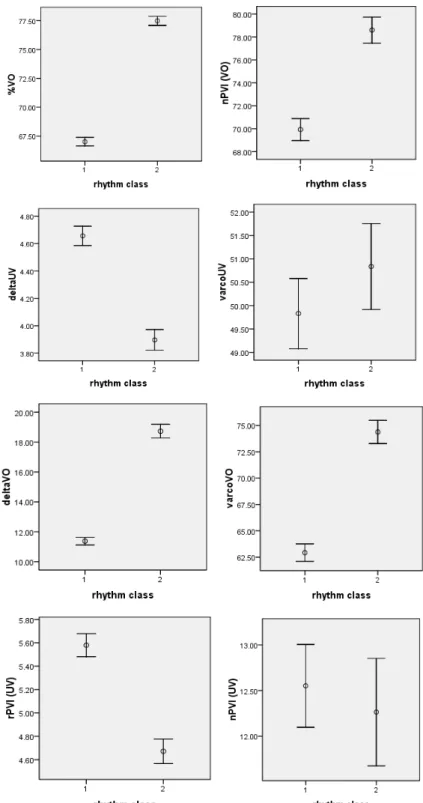
The results for all rhythm measures (%VO, deltaUV, varcoUV, deltaVO, varcoVO, nPVI-VO, rPVI-UV and rPVI-VO) are plotted in Figure 2 (mean values with standard errors [+-1] plotted over stress-timed [1] and syllable-timed languages [2]). The between group variability was tested using an independent samples t-test, the results of which can be viewed in Table 1.
measure t(1140) P %VO -18.85 <0.001 deltaUV 7.15 <0.001 varcoUV -0.85 0.4 deltaVO -15.1 <0.001 varcoVO -8.43 <0.001 nPVI-VO -5.81 <0.001 rPVI-UV 6.13 <0.001 nPVI-UV 0.39 0.7
Table 1: Results for the independent samples t-test with 'rhythm class' as a grouping variable (group 1: stress-timed, group 2: syllable-timed). Column 1 contains the measure names, column 2 the t-value for 1140 degrees of freedom and column 3 the probability (p).
Results for %VO and deltaUV replicate the patterns found in the Ramus-corpus (see above). %VO is higher for syllable-timed than for stress-timed languages and deltaUV is lower for syllable- than for stress-timed languages. So the classic pattern of stress-timed languages being proportionally less vocalic but more variable in their consonantal interval durations also holds for their voicing: stress timed languages are proportionately less voiced and their unvoiced periods are more variable than in syllable timed languages.
Figure 2: Measurements from the LX-corpus showing mean values and (+- 1) standard errors for each rhythm class (1 = stress-timed, 2 = syllable-timed).
For the voiced interval variability measure, stress-timed languages vary significantly from syllable-timed, however, the pattern is reversed in regard to vocalic variability: while vocalic variability is typically higher in stress-timed languages the variability of voiced intervals is lower (compared to syllable-timed languages). All vocalic variability measures, whether they are rate normalised (nPVI-VO, varcoVO) or not (deltaVO) show evidence for being more variable in syllable-timed languages. This finding is interesting
and cannot easily be explained at the current stage, especially since we would rather assume the opposite to happen. In the VO-UV segmentation all voiced consonantal content is assimilated to vocalic portions in speech. Now, vocalic intervals in speech are more variable in stress- than in
syllable-timed languages and so are consonantal-intervals (see Ramus et
al., 1999; Grabe and Low, 2002, and the results under section 2 of this
paper). By summing two intervals that are more variable we would not expect to produce new intervals which are less variable. A possible reason for this could be that by adding the variability of C- and V- intervals together the variability in resulting voiced intervals is cancelled out. This, however, can only happen when longer intervals are systematically combined with shorter intervals, to make the overall duration less variable and such an organisation could only be made on a phonotactic level.
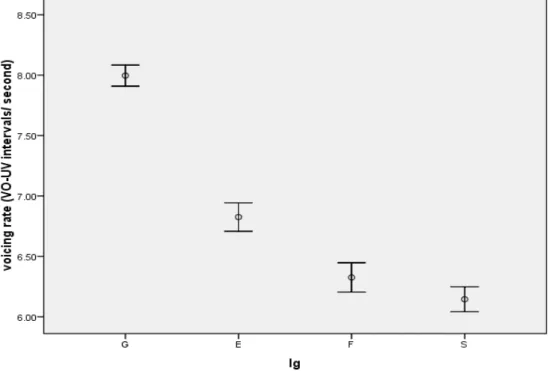
Figure 3: Voicing rate measured in voiced and unvoiced intervals per second. The graph plots the mean values with standard error (+-1) for the languages German (G), English (E), French (F), and Spanish (S).
Why would this happen? From a production point of view it seems conceivable that the durations for turning voicing on and off are easier to control for the speaker when they happen at regular intervals. So possibly the phonotactics of the language are influenced by such a desire to keep voiced interval durations at equal durations. We have found tentatively in
other cross language work (Fourcin and Abberton, 2008; Fourcin, 2010) that
voice produced in reading representative texts at a comfortable rate may be subject to powerful temporal constraints that tend to give an equal balance between the total time speech is voiced and the total time allocated to voiceless consonants together with silences. This is to say that
there is evidence that voicing patterns have the tendency to be similarly organised across languages. Such an organisation may either arise of temporal articulatory constraints or simply because keeping a certain durational voiced:unvoiced ratio provides a more effective way of articulating.
If the argument was true that higher rates result in a lower variability of VO and UV intervals we should find that at languages with less variable VO-UV intervals should also reveal a higher rate of these intervals. We have tested this and plotted the results in Figure 3. The figure shows that rate of voiced and unvoiced intervals per second for the languages German, English, French and Spanish (mean and standard error). The results reveal that voicing rate varies strongly between languages probably in a comparable
way to rate variability of consonantal and vocalic intervals (Dellwo et al.,
2006; White and Mattys, 2007; Dellwo, 2010). It can be seen that stress-timed English and German have generally a lower rate of voiced and voiceless intervals than syllable-timed French and Spanish. This effect is highly significant (ANOVA: language * rate: F[3,1141]=78.9, p<.001). A Tukey's post-hoc test reveals that there are no significant differences between the two syllable-timed languages (p=0.7) but highly significant difference between any other group comparison. In summary, it is possible that the higher variability of VO and UV intervals found in syllable-timed languages is an effect of the higher rates at which theses languages are articulated.
4. Within-language variability of voicing
By now there is quite a wide body of evidence that temporal characteristics of consonantal and/or vocalic segments can vary within a language, for example as a function of speaker (Dellwo and Koreman, 2008; Dellwo,
Ramyead and Dancovicova, 2009; Wiget et al., 2010; Yoon, 2010; Arvaniti,
2012). Wiget et al. (2010) found that the percentage over which speech is
vocalic can vary as much between speakers of the same language as it varies between languages of different rhythmic classes. In the present section of this paper we explored whether speakers also vary within a language as a function of temporal characteristics of their voice. The data analysed in sections 2 and 3 of the present paper are not very suitable for this analysis since the number of speakers were low. In 2 we only had 4 speakers per language producing 5 sentence and in 3 speakers produced more speech but there were only 3 speakers per language and it is unclear what the probability is that these three speakers are very similar in respect to the temporal characteristics of speech. In summary, we want to look at a database that contains more speakers For this reason we chose to look at
the BonnTempo Corpus (Dellwo et al., 2004) which offers 15 speakers for
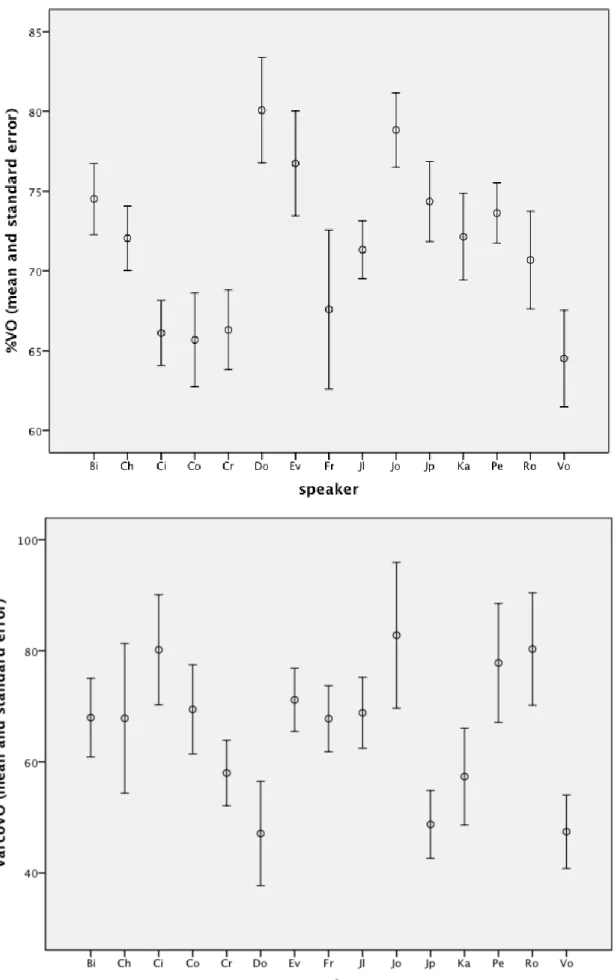
Figure 4: %VO (top) and VarcoVO (bottom) as a function of 15 different speakers in the BonnTempo Corpus (mean values and standard-errors).
4.1
Data and measurement procedures
15 speakers from the BonnTempo Corpus (Dellwo et al., 2004) were chosen
for the analysis. Speakers read a German text under 5 different intended tempo conditions (very slow, slow, normal, fast, very fast). As we are only interested in normal speech at present we analysed the normally produced version of the text only. Speakers read a small text including seven sentences.
For each sentence the percentage over which speech is voiced (%VO) and the standard deviation of voiced interval durations (DeltaVO) was calculated. As speech rate may have the same influences on the standard deviation of voiced intervals as on comparable intervals (Dellwo, 2006) we calculated the coefficient of variation instead of the raw standard deviation (VarcoVO).
4.2
Results and Discussion
Figure 4 shows the mean and standard error for %VO (top graph) and VarcoVO (bottom graph). It is apparent from the graphs that speakers vary to a great degree in both variables. For %VO this effect is highly significant (ANOVA: F[14,103]=2.77; p=0.002), for VarcoVO the effect is significant (ANOVA: F[14,103]=1.88; p=0.04). This means that there is not only significant variability of voicing intervals between languages but also within languages as a factor of speaker.
The magnitude of the within language variability is surprising. Speaker ‘Do’ for example has 80% and speaker ‘Vo’ 63% of proportional voicing. In absolute terms this difference is higher than the difference obtained between stress- and syllable-timed languages in section 2 and nearly as high at the one obtained in section 3. So all in all it can be said that variability as a function of speaker is comparable in magnitude to the variability as a function of language. This effect is accordance with the type of variability between speaker that has been found for consonantal and vocalic durational characteristics by Wiged et al. (2010).
5. General discussion
In the present paper we presented results from three analyses. In section 2 we showed that languages of different rhythmic characteristics (stress-timed and syllable-(stress-timed, for example) vary in the way their voiced intervals are organised. While we find more regularly distributed patterns of voicing in syllable timed languages (patterns of lower durational variability) these patterns are more irregular in stress-timed languages. As the data in section 2 was very controlled (5 sentences of about 15 syllables per speaker) we studied less contrained data in section 3 (longer texts from
different genres). We found that we could replicate the general results from section 2 that the voicing patterns in stress-timed languages are more variable than in syllable-timed languages. In section 4 we looked at the durational variability of voicing patterns within languages and found considerable variability between speakers of German taken from the BonnTempo corpus. So in summary our research showed that some languages can be robustly distinguished from others (e.g. stress- and syllable-timed languages) simply on the basis of physically defined voiced and unvoiced intervals and this is also true for some of the speakers within the languages. In the following we will discuss the particular advantages and more general implication of this segmentation procedure.
The methodological advantage of the present method is that rhythmic classification of languages can be carried out with precision and relatively little effort. Manual labelling of consonantal and vocalic intervals is labour intensive and because of the considerable level of phonological knowledge involved in this process (e.g. is a retroflex approximant vocalic or consonantal?) automatic procedures have so far given unsatisfactory results. Such procedures would require specific training for individual languages when applied cross linguistically. Also, because of the level of phonological knowledge involved in the labelling of vocalic and consonantal intervals, between-labeller disagreement can be significant This disagreement is even stronger across different languages or when accentual pronunciation variability occurs. Detecting voiced and voiceless parts of the signal is a much easier and more reliable method and it is applicable on a cross language basis with fewer assumptions. To obtain additional precision obtaining the 'voice'-data, technology monitoring vocal fold activity directly can be used (e.g. laryngograph).
Since fewer assumptions are required to distinguish stress- and syllable-timed languages on the basis of voiced and voiceless cues this may also have implications in regard to our understanding of both how adults and
indeed infants distinguish between rhythm-classes (Ramus et al., 1999).
After all, infants receive most of their initial familiarization with speech acoustics in the mother's womb where they are exposed to a highly low pass filtered signal (larynx to otic capsule vibrotactile transmission) and no visual cues are available. In such an environment voice cues are much more salient than any other acoustic feature of speech. For this reason we propose the hypothesis that infants may prefer voice variability cues over consonantal and vocalic interval variability cues to distinguish between speech rhythm classes. And we can probably take another step. Since we saw that voicing characteristics vary between speakers of the same language it might be well possible that such characteristics are also salient to the infant at an early stage and that for example the ability to distinguish the mother from other women or the father from other men is based on
exactly these variables. It would be interesting to test these hypothesis in perceptual experiments with infants.
Voice, in relation to laryngeal vibration, is one of the most dominant perceptual components of speech; thus its durational characteristics may make a substantial contribution to the perceptually salient temporal organisation of speech, i.e. to our impression of rhythm in speech. The temporally structured quasi periodic nature of vocal fold vibration distinguishes voice from other sounds in the foetal environment and it is beginning to appear that our auditory system employs neuro-temporal mechanisms that are especially suited to voice perception (Sayles and Winter, 2008 — using a human related animal model). These mechanisms exist in the adult and their low frequency importance is enhanced by cranial bone conduction and they are likely to dominate auditory processing in the foetus. Normal cochlear place analysis is not available to the foetus, since the amniotic fluid, that fills the middle ear and external canal, occludes the round window and foetal hearing is, in consequence, physically only able to provide percepts of pitch and loudness arising from the operation of these neuro-temporal mechanisms. Although neural synchrony with acoustic input is detectable up to 5kHz (e.g. Johnson, 1980) these mechanisms operate best only over the voice range of frequencies
(see, for example, the mistuned harmonic experiments by Hartman et al,
1990).
These simple facts contribute to an explanation for the early development of infant prosodic skills. Neuro-temporal processing effectively focusses auditory attention on the vocal fold / voice component of speech. This selective attention is of importance not only to the perception but also to the production of voice. Vocal fold vibration is likely to be given especial importance because it is perceptually salient. To the extent that this is true, we may expect that the use of laryngeal timing information will provide the most robust basis for both the perceptual and computational discrimination of language rhythmic timing differences.
Acknowledgements
We wish to thank Franck Ramus for sharing the speech data used in Ramus
et al. (1999). We further wish to thank Sandra Schwab, Evelyn Abberton and Patti Adank for helpful comment on draft versions of this paper. Further thanks goes to one anonymous reviewer of the paper for TRANEL.
Bibliography
Abercrombie, D. (1967): Elements of General Phonetics. Edinburgh (Edinburgh University Press). Arvaniti, A. (2012): The usefulness of metrics in the quantification of speech rhythm. Journal of
Phonetics, 40, 351-373.
Boersma, P. (2001): Praat, a system for doing phonetics by computer. Glot International, 5 (9/10), 341-345.
Bolinger, D.L. (1981): Two kinds of vowels, two kinds of rhythm. Bloomington/Indiana (Indiana University Linguistics Club).
Chan, D., Fourcin, A., Gibbon, D., Granstrom, B., Huckvale, M., Kokkinakis, G., Kvale, K., Lamel, L., Lindberg, B., Moreno, A., Mouropoulos Senia, F., Trancoso, I., Veld, C., Zeiliger, J. (1995): EUROM Spoken Language Resource for the EU. Proceedings of Eurospeech'95, 867-870. Dauer, R.M. (1983): Stress-timing and syllable-timing reanalyzed. Journal of Phonetics, 11, 51-69. — (1987): Phonetic and phonological components of language rhythm. Proceedings of the 11th
ICPhS, 447-450.
Dellwo, V. (2006): Rhythm and speech rate: A variation coefficient for ΔC. In: Pawel Karnowski and Imre Syigeti (eds.), Language and Language-processing. Proceedings of the 38th Linguistic Colloquium. Frankfurt am Main (Peter Lang), 231-241.
— (2010): Influences of speech rate on acoustic correlates of speech rhythm: An experimental investigation based on acoustic and perceptual evidence." PhD thesis, Bonn University, Germany (http://hss.ulb.uni-bonn.de:90/2010/2003/2003.htm).
Dellwo, V., Fourcin A, Abberton E. (2007): Rhythmical classification of languages based on voice parameters. Proceedings of the International Congress of Phonetic Sciences (ICPhS), 1129-1132.
Dellwo, V. and Koreman, J. (2008): How speaker idiosyncratic is measurable speech rhythm? Abstract collection of IAFPA 2008, Lausanne, Switzerland.
Dellwo, V., Ramyead, S., and Dancovicova, J. (2009): The influence of voice disguise on temporal characteristics of speech. Abstract collection of IAFPA 2009, Cambridge, UK.
Dellwo, V. and Wagner, P. (2003): Relationships between speech rhythm and rate. Proceedings of the 15th ICPhS, 471-474.
Dellwo, V. Aschenberner, B., Dancovicova, J. and Wagner, P. (2004): The BonnTempo-Corpus and Tools: A database for the combined study of speech rhythm and rate. Electronic Proceedings of the 8th ICSLP.
Fourcin A, Abberton, E. (2008): Hearing and phonetic criteria in voice measurement: Clinical applications. Logopedics Phoniatrics Vocology 33, 35-48.
Fourcin, A. and Dellwo, V. (2009): Rhythmic classification of languages based on voice timing. Speech, Hearing and Phonetic Sciences, UCL: London, UK
Fourcin, A (2010): A note on voice timing and the evolution of connected speech, Logopedics Phoniatrics Vocology, 35, (2) , 74-80.
Grabe, E, Low L, (2002): Durational Variability in Speech and the Rhythm Class Hypothesis.– In: Carlos Gussenhoven/Natasha Warner (eds.), Papers in Laboratory Phonology 7, Berlin (Mouton de Gruyter), 515-546.
Hartmann, W. (1990): Hearing a mistuned harmonic in an otherwise periodic complex tone. Journal of the Acoustical Society of America, 88, (4), 1712-1724.
Johnson, D. (1980): The relationship between spike rate and synchrony in responses of auditory-nerve fibers to single tones. Journal of the Acoustical Society of America, 68 (4), 1115-1122. Nazzi, T., Ramus, F. (2003): Perception and acquisition of linguistic rhythm by infants. Speech
Communication, 41, 233–243.
Nazzi, T., Bertoncini, J., and Mehler, J. (1998): Language discrimination by newborns: Toward an understanding of the role of rhythm. Experimental Psychology, 24, (3), 756-766.
Pike, K. (1945): Intonation of American English. Ann Arbor (University of Michigan Press).
Ramus, F. (2002): Acoustic correlates of linguistic rhythm: Perspectives. Proceedings of Speech Prosody, 11-13.
Ramus, F., Hauser, M.D., Miller, C, Morris, D., and Mehler, J. (2000): Language discrimination by human newborns and cotton-top tamarin monkeys. Science, 288, 349-351.
Ramus, F., Nespor, M., and Mehler, J. (1999): Correlates of linguistic rhythm in the speech signal. Cognition, 73, 265-292.
Ramus, F. and Mehler, J. (1999): Language identification based on suprasegmental cues: A study based on resynthesis. Journal of the Acoustical Society of America, 105, (1), 512-521.
Rincoff, R., Hauser, M., Tsao, F., Spaepen, G., Ramus, F., and Mehler, J. (2005): The role of speech rhythm in languages discrimination: further tests with a non-human primate. Developmental Science, 8, (1), 26-35.
Roach, P. (1982): On the distinction between 'stress-timed' and 'syllable-timed' languages," In D. Crystal (ed.): Linguistic controversies, London (Edward Arnold), 73-79.
Sayles, M., and Winter, I. (in press): Ambiguous Pitch and the Temporal Representation of Inharmonic Iterated Rippled Noise in the Ventral Cochlear Nucleus. Journal of Neuroscience.
Toro, J.M., Trobalon, J.B., and Sebastian-Galles, N. (2003): The use of prosodic cues in language discrimination tasks by rats. Animal Cognition, 6, (2), 131-136.
White, L. and Mattys, S. (2007): Calibrating rhythm: First language and second language studies. J. Phonetics, 35, (4), 501-522.
Wiget, L., White, L., Schuppler, B., Grenon, I., Rauch, O., and Mattys, S. L. (2010): How stable are acoustic metrics of contrastive speech rhythm. J. Acoust. Soc. Am., 127, (3) , 1559-1569. Yoon, T. J. (2010): Capturing inter-speaker invariance using statistical measures of speech