Publisher’s version / Version de l'éditeur:
Vous avez des questions? Nous pouvons vous aider. Pour communiquer directement avec un auteur, consultez la première page de la revue dans laquelle son article a été publié afin de trouver ses coordonnées. Si vous n’arrivez pas à les repérer, communiquez avec nous à [email protected].
Questions? Contact the NRC Publications Archive team at
[email protected]. If you wish to email the authors directly, please see the first page of the publication for their contact information.
https://publications-cnrc.canada.ca/fra/droits
L’accès à ce site Web et l’utilisation de son contenu sont assujettis aux conditions présentées dans le site LISEZ CES CONDITIONS ATTENTIVEMENT AVANT D’UTILISER CE SITE WEB.
Research Report (National Research Council of Canada. Institute for Research in Construction), 2005-03-01
READ THESE TERMS AND CONDITIONS CAREFULLY BEFORE USING THIS WEBSITE.
https://nrc-publications.canada.ca/eng/copyright
NRC Publications Archive Record / Notice des Archives des publications du CNRC :
https://nrc-publications.canada.ca/eng/view/object/?id=20acfa38-74b8-4721-9643-305af7f534d3 https://publications-cnrc.canada.ca/fra/voir/objet/?id=20acfa38-74b8-4721-9643-305af7f534d3
Archives des publications du CNRC
For the publisher’s version, please access the DOI link below./ Pour consulter la version de l’éditeur, utilisez le lien DOI ci-dessous.
https://doi.org/10.4224/20378365
Access and use of this website and the material on it are subject to the Terms and Conditions set forth at
Managing Volatile Organic Compounds and Indoor Air Quality in Office Buildings - An Engineering Approach: Final Report 5.2
N a t i o n a l R e s e a r c h C o u n c i l C a n a d a
M a na ging Volat ile Orga nic
Com pounds a nd I ndoor Air
Qua lit y in Offic e Buildings – An
Engine e ring Approa ch
R R - 2 0 5
S h a w , C . Y . ; W o n , D . ; R e a r d o n , J .
March 2005
A version of this document is published in / Une version de ce document se trouve dans:
Final Report 5.2 – CMEIAQ-II: Consortium for Material Emission and IAQ Modelling II
Consortium for Material Emissions and Indoor Air Quality Modelling II (CMEIAQ-II)
In 2000, the Institute for Research in Construction, National Research Council Canada (IRC/NRC) launched the second phase of the Material Emissions and Indoor Air Quality Modelling project (CMEIAQ-II). The second phase of this project is the direct result of the support and suggestions from the first phase’s consortium members for continued work on this research topic. In the second phase, the research is directed towards two principal objectives. The first is to develop the knowledge and tools needed to estimate concentrations of volatile organic compounds (VOCs) generated by the emissions from building materials and furnishings in order to gain a better understanding of the effects of those products on indoor air quality (IAQ). The second is to provide the scientific bases needed to enhance indoor air quality guidelines for office and residential buildings. An important addition to the project in this phase was the Health and End Users Advisory Committee, which was tasked to provide much needed input from the health sector and advice to help tailor the project outputs to better meet the needs of end-users.
Phase II Tasks
The specific tasks of the phase II research were:
• To assemble a target VOC list on which to focus our efforts for the analysis of the emission test results. The list includes chemicals which are known to be emitted from various materials, and, especially, chemicals known to have health effects;
• To determine the ranges of variation of the emissions from selected materials, which may result from material variability or environmental influences; • To expand the database to include a total of 69 materials, and to re-analyze the
existing data to cover as many VOCs on the new target list as possible; • To refine the Material Emission DataBase and Indoor Air Quality
(MEDB-IAQ) simulation program to make it more user-friendly;
• To develop and validate empirical and mass-transfer based source models; and • To develop a best practice guide for managing VOCs/IAQ in office buildings.
Significance of the Project
A recent report by a multidisciplinary group of European scientists (EUROVEN) based on existing and limited literature, recommends that outdoor air supply rates need to be increased to 30 L/s per person from the current ASHRAE recommendation of 10 L/s per person to improve indoor air quality for health, comfort, and productivity concerns. On the other hand, a previous NRC experimental study indicates that increasing the
ventilation rate to speed up the removal of air-borne VOCs, even when energy use is not a concern, is not effective. The most efficient strategy to maintain indoor air quality is to remove the contaminants at the source (source control) and then to rely on ventilation (dilution) to remove the air-borne VOCs.
This research contributes to improved indoor air quality by developing knowledge and tools for effectively applying source control to reduce ventilation needs (and hence, save
energy). The work provides the relative contribution by a given product to up to 90 VO concentrations (some of which are known to have adverse health effects), allowing intelligent, informed choices of building materials and indoor consumer products. Product manufacturers will benefit by learning how their products can be improved respect to VOC emissions, and where their products stand relative to others in
simulations of their actual use. The information collected in Phase II will also make it easier for investigators to diagnose possible IAQ problems in buildings, and ex
trade-offs between increased ventilation and source control. The consortium for Phase II (which has a Steering Committee
C
with
plore
, a Technical Advisory ommittee, and a Health & End Users Advisory Committee) was established to set the
lic
t team:
ty f
Report 1.2 Methodology for Analysis of VOCs in Emission Testing of ls
Report 2.2 ental Factors on VOC Emissions from a Wet
Material
Report 3.2 n 4.1 Beta
Wet
Report 5.2 ging VOCs and Indoor Air Quality in Office Buildings: An C
research priorities and help fund the project. Members of the consortium include: Pub Works & Government Services Canada, Natural Resources Canada, Canada Mortgage and Housing Corporation, Health Canada and the National Research Council. In addition, the following organizations have made significant in-kind contributions to the consortium project through close research collaboration with the IRC/NRC projec Canadian Composite Panel Association, Carleton University, Chemical Manufactures Association (Rohm & Haas), Dalhousie University, Gypsum Board Association, Saskatchewan Research Council, Syracuse University, University of Calgary, Universi of Miami, U.S. Environmental Protection Agency (EPA), U.S. National Institute o
Standards and Technology (NIST), and Virginia Polytechnic Institute & State University. The CMEIAQ-II final research reports include:
Report 1.1 Target VOC list Building Materia
Report 2.1 Specimen Variability: A Case Study Effects of Environm
Material
Report 2.3 Effects of Material Temperature on VOC Emissions from a Dry Building
Report 3.1 Material Emission Data: Small Environmental Chamber Tests MEDB-IAQ Versio
Report 4.1 Model Development for VOC Emissions from Wet Building Materials
Report 4.2 Validation of a Mass-transfer Model for VOC Emissions from Building Materials
Report 4.3 Validation of Empirical Models with Long-term Emission Testing Data
Report 5.1 Indoor Air Quality Guidelines and Standards Mana
Report pr
method for the VOCs and 2.2 present research outcomes on both herent and environmental factors inducing variability in material emissions. Report 2.3 discusses VOC emissions as a function of surface temperatures, which can be applied to emissions from a radiant floor heating system. Report 3.1 provides material emission testing data and the resulting coefficients for empirical emission models for the expansion of IAQ simulation software. Report 3.2 is a user manual for the revised MEDB-IAQ. Reports 4.1 and 4.2 deal with the development of a mass-transfer based model for wet building materials and the validation of the model with experimental data. Report 4.3 compares empirical models based on short-term emission testing data with those based on long-term data. Report 5.1 contains summaries of existing guidelines and standards associated with indoor air quality. Report 5.2 is a manual for property
managers and building operators for their duties in managing VOCs in office buildings. s 1.1 and 1.2 ovide the information on the Target VOC list and the analysis
on the list. Reports 2.1 in
Managing Volatile Organic Compounds and Indoor Air Quality in
Office Buildings: An Engineering Approach
Summary
There is a growing awareness of the importance of maintaining good indoor
environments, and, with that awareness, a growing need to understand the parameters contribute to a building's indoor air quality (IAQ) and the effect of IAQ on occupant well-being. This report gives a brief overview of various parameters affecting IAQ. It also provides some practical recommendations for maintaining good IAQ with a focus on
that
inimizing the airborne concentrations of volatile organic compounds (VOCs) in uildings.
This report is intended for use mainly by building owners, property managers, and building operators. It covers the following topics:
• parameters affecting indoor environments, • VOCs and their sources,
• main causes of occupant complaints,
• VOCs emitted from office furniture and their concentrations in buildings, • proactive plans for minimizing VOC effects,
• diagnostic techniques for identifying potential IAQ and ventilation problems, • the balance between acceptable IAQ and energy use, and
• best practices for managing IAQ/VOCs in buildings.
A brief summary of the main recommendations for managing VOCs in buildings is given below.
•
• Use low-emitting building materials/products.
• During renovation, seal the affected area and vent the space through leeward side windows (summer only), a smoke shaft, or stair shafts with open outside door at the roof level. Use portable exhaust fans to assist venting.
• Immediately after renovation, operate the HVAC system with a ventilation rate of up to 20 L/s/person (40 cfm), depending upon the system capacity and outdoor air temperature (watching closely for warnings of coil freezing) for two to four weeks. • Avoid contaminated ventilation air by locating air intakes as high as possible in the
building and away from pollution sources such as cooling towers and exhaust outlets. • Provide designated exhaust for localized emission sources.
• Take advantage of free-cooling, weather permitting.
• Control ventilation rates using occupant-generated CO2 , if feasible.
• Develop a preventative maintenance manual including:
− preventative maintenance procedures and schedules for implementation, − calibration instructions and schedules for various sensors,
m b
− −
− equipmen er’s help
hotlines.
HVAC fault identification and location procedures, and
t information such as warranty coverage and manufactur •
• Develop a proactive program for managing IAQ/VOCs by conducting an annual walk-through building inspection. During which:
−
− ntion to inadequate airflow from supply air diffusers, locations of air intake, drafts, noise, glare on VDTs, odours, and wet surfaces.
−
− if feasible, measure concentrations of CO2 and TVOC.
pay atte
•
• Consult technical personnel if the levels of COC 2 and TVOC exceed 800 ppm and 2.5 mg/m3,respectively. (Note: occupant complaints may occur at lower levels, i.e., 600 ppm CO2 and/or 1.0 mg/m3 TVOC.)
Table of Contents
mary Sum . .... iv Int ... 1 Par ... 2 I 2 C V ... 3Typical VOC Sources ... 3
Potential Effects of VOCs on Health and Well-being ... 3
Levels of VOCs in Buildings... 4
Part II – Actions Determining the Indoor Environment... 7
Proactive Plans for Minimizing VOC Effects ... 7
Low-emitting building materials/products... 7
Minimizing material emission effects during installation/renovation ... 9
Diagnostic techniques for identifying potential IAQ and ventilation problems ... 10
Visual inspection... 10
Detailed measurement... 11
Balancing between acceptable IAQ and energy use ... 12
Air cleaning... 12
Source control ... 13
Ventilation... 14
Part III – Best Practice for Managing IAQ-VOCs in Office buildings... 20
Select low-emission building materials and products... 20
Minimize material emission effects during installation and renovation activities ... 21
Balance IAQ with energy use through effective use of ventilation ... 21
Establish an effective preventive maintenance program ... 22
Act proactively to manage IAQ & VOCs ... 23
Acknowledgement ... 23
References... 23
... ... roduction... t I – Background Information ... ndoor Environment (IE) and Indoor Air Quality (IAQ) ... ommon Causes of IAQ Problems... 2 olatile Organic Compounds (VOCs)...
List of Figures
Figure 1. Measured concentrations of TVOC and selected VOCs emitted from an office
workstation furniture system... 5
supplied Dr. Gemma Kerr, InAir Environmental Ltd.) ... 9
Fi Fi Fi Figu Figu Li Tabl Tabl Ta Tabl Tabl Figure 2. TVOC profile immediately after recarpeting an office (This graph was Figure 3. TVOC profile during and after a major renovation of a conference room... 10
Figure 4. Gas chromatograms of a contaminated building and an automobile exhaust . 11 Figure 5. TVOC profile for a typical working day in a photocopying unit of a library .. 13
gure 6. Daily maximum TVOC concentration vs. air change rate ... 14
gure 7. Floor plan of a typical floor in a five-storey apartment building ... 15
gure 8. Ventilation air distribution on a typical floor ... 16
re 9. CO2 profiles in the floor space and return duct of different floors... 18
re 10. Relationship between daily maximum (or average) CO2 concentration and air change rate ... 19
st of Tables e 1. VOCs emitted from the office workstation... 5
e 2. VOCs in Canadian Workplaces and Houses (mg/m3) ... 6
ble 3. Maximum Emission Factors under CCI/CRI Carpet Labelling Program... 7
e 4. Default TVOC Values for Specifying Low-Emission Materials... 8
Managing Volatile Organic Compounds/Indoor Air Quality in Office
rang
Acceptable and cost-effective indoor environments depend on the performance of
s that control noise, heating, cooling, material off-gassing, ventilation and
building systems that support the indoor envi nment also needs to be addressed. An integral approach that addresses heating, ventilating, air-conditioning, noise, lighting, material emissions, energy, and human and organizational aspects in a systematic manner is needed to design and maintain a satisfactory indoor environment at a minimal cost. Since the early 1980s, the Institute for Research in Construction has conducted several multi-year studies, including the phase I and phase II of the Material Emissions and Indoor Air Quality Modelling projects, to systematically address the impacts of the aforementioned factors on indoor environments and occupant satisfaction. While the results of these studies have been communicated to the scientific community, little effort has been made to transfer the findings in a manner appropriate for use by building owners, property managers, and building engineers, who are the end users of the results. To fill the apparent information gap, a special working group was established under the Health and End Users Advisory Committee of the Material Emissions and Indoor Air Quality Modelling project (Phase II). The main objective of this working group was to bring together building researchers, building owners and managers, and health officials to review past and current research findings related particularly to source control and
ventilation, and to disseminate it in a manner that can be readily used by building practitioners.
This report is the product of the working group. It consists of three parts. Part I presents background information required to answer occupants' questions about indoor air quality and health. Part II provides the information required to identify potential IAQ problems and assess the IAQ level in buildings. It also presents some evidence supporting the recommendations for managing buildings. Part III lists best practices for managing IAQ
Buildings: An Engineering Approach
Introduction
Occupant health, comfort, and productivity are primary considerations for commercial building owners and operators, because occupants' salaries dominate the life cycle cost of such buildings. There is strong theoretical evidence, although limited data, indicating that improvements to indoor environments can result in significant improvements to health and productivity. Estimates of potential annual savings plus productivity gains in the USA are between $30 and $170 billion with benefits outweighing costs by a factor
ing from 18 to 47. building system
illumination. These systems must be properly designed and maintained in order to provide continuing comfort, air quality, and operating economy. To achieve this, in addition to physical factors such as temperature, air distribution, and relative humidity, it is necessary to understand occupants' reactions to their indoor environments and the effects of environmental, human, and organizational factors on their productivity. Also, as pressures continue to reduce greenhouse gas emissions, the energy efficiency of
in
technologies and exp dustrial buildings,
ch as multi-family residential build lve specific roblems and improve indoor air quality.
art I – Background Information
(IE) and Indoor Air Quality (IAQ)
noise, good
d
istribution, or both. Indoor air contaminants have many sources including
etc., buildings. While the report focuses primarily on office buildings, the resulting
ertise are also applicable to other types of non-in ings, schools and hospitals, to so su
p
P
This part of the report contains information that can be used by building owners, managers, and engineers when answering indoor air quality related questions from the occupants of their buildings. A main focus of the discussion is on volatile organic compounds (VOCs), their sources and potential health effects.
Indoor Environment
The conditions of indoor environments are affected by three main physical factors:
lighting, and IAQ. In addition, occupants’ perceptions of their environments may also be affected by many other factors including job stress and satisfaction. Furthermore, a and practical design to achieve an acceptable indoor environment has to consider additional factors such as costs, health and safety.
Of all the IE related problems, the most familiar and least understood one is IAQ. IAQ is closely related to thermal comfort, ventilation, indoor contaminants, and material
emissions. It is primarily controlled by the design and operation of HVAC systems an the selection of building materials and furnishings. Even though IAQ is not directly related to noise, lighting, and human factors, stuffy air or poor air quality has been frequently used by occupants to express their dissatisfaction with the noise level, poor lighting, and, sometimes, career development and well-being. To effectively address occupants' complaints, it is necessary to remember that not all complaints are caused by poor IAQ.
Common Causes of IAQ Problems
The main causes of IAQ problems are inadequate ventilation and indoor contaminants. Poor lighting, noise, and human and organizational factors (e.g., job stress, job
satisfaction, and personal problems) can also lead to occupants’ complaints. This type of complaint is known as a perceived IAQ problem, and should be addressed together with appropriate experts.
Inadequate ventilation is usually the result of inadequate ventilation rate (for office buildings, the recommended ventilation rate is 20 cfm or 10 L/s per person), poor ventilation air d
building materials and furnishings, occupant activities, and building HVAC systems. Major indoor air contaminants are:
• allergens, such as house dust, pet dander, etc.,
• inorganic gaseous contaminants, such as CO, CO2 , ozone, SO2, nitrogen dioxide,
• viable particulate matter such as moulds and spores, • radon, and
• VOCs.
Volatile Organic Compounds (VOCs)
ot p, nge: 0oC to 50-100oC, es, ding . The
ffects of VOCs on Health and Well-being
It appears that there is no well-substantiated evidence linking a large number of health concerns, particularly for occupants
n
, 1999). Unless there are special contamination sources, it is xpected that this statement might apply equally well to Canadian homes and offices.
r air (guidelines for office buildings are not yet or 0.10 ppm and a Target Level of
e led to VOCs include a large group of contaminants that are of particular concern when
ddressing IAQ issues. VOCs are chemical compounds that are gaseous at room a
temperature and contain, at least, one carbon atom and one hydrogen atom.
Formaldehyde is a VOC but is often treated separately from other VOCs because it is n detected by the gas chromatographic methods commonly used to measure VOCs. VOCs can be grouped into three classes based on their boiling points (Yu and Crum 1998):
• very volatile organic compounds (VVOCS); boiling point ra • volatile organic compounds (VOCs); boiling point range: 50-100o
C to 240-260oC, • semi-volatile organic compounds (SVOCs); boiling point range: 240-260 o
C to 380-400 oC.
Typical VOC Sources
Typical VOC sources include building materials and furnishings, occupant activiti cleaning agents and office machines. Some sources, such as glues used for carpet and wallpapers, are not obvious. Contaminants generated outdoors can also get into a buil through the outdoor air intakes. The HVAC system itself may be a source of VOCs most common sources of odorous VOCs are air filters and ducts.
Potential E
individual VOCs found in the indoor air to
with normal health. An article prepared by the Institute for Environment and Health states that "the majority of individual VOCs that make up the spectrum of VOCs found i the air of UK homes has no reported health effects, even at levels orders of magnitude higher than those generally found in homes. These VOCs include aliphatic hydro carbons such as undecane, most aromatic hydrocarbons such as toluene, esters and alcohols" (MRC IEH
e
However, some VOCs detected in the indoor air are recognized carcinogens.
Formaldehyde, for example, is one of them. It is a colourless gas. At a concentration of 1 ppm a pungent odour can be detectable. Health Canada's current exposure guidelines for formaldehyde in residential indoo
available) consist of an Action Level of 120 μg/m3
60μg/m3 or 0.05 ppm (HC, 1989). These levels were under review by Health Canada at the time of writing. There are also reports that exposure to other VOCs hav
symptoms varying from headache, nausea, dizziness, eye, skin, and throat irritations, and n n to general discomfort (Jones, 1999). The odour associated with some
also cause complaints.
Some individuals, especially those who suffer from asthma and environmental
ersons with normal health. Recently, there d to
ong-evel.
s: res and Health Effects" (WHO, 1983). Common symptoms of SBS include
st
p ptoms are not clinically verifiable. Also, BRI is usually accompanied by BS complaints among co-workers. A random survey indicated that about one-quarter of
d to have IAQ problems in their offices and 20% of all ).
VOC concentrations various types of buildings. IRC has also undertaken two multi-year projects on
below. a on itions entified se sory irritatio VOCs may
hypersensitivity, are more susceptible than p
has been an increased number of IAQ conferences at which the attendees are aske refrain from using perfume or deodorant. There is also increased concern for the l term health effects of various combinations of VOCs, each present at a very low l
For office buildings, the term "Sick Building Syndrome” (SBS) has been frequently used describe the IAQ-related complaints by office workers. SBS appeared to be first used to
by the members of a WHO Working Group in their report entitled "Indoor air pollutant Exposu
headache, nausea, nasal congestion, mucous membrane irritations of nose, eyes and throat, fatigue, and less frequently, dry or itchy skin. SBS is characterized by its rapid disappearance of symptoms, within minutes to hours, after leaving the building. SBS is di inguished from more medically serious building-related illness (BRI) in that the
orted sym re
S
US office workers perceive
respondents believed that their performance was hampered by poor IAQ (Woods, 1989
Levels of VOCs in Buildings
ince the 1980s, IRC has conducted several studies to measure the S
in
material emissions. A brief summary of the results is reported
VOC Emissions from an Office Workstation
Office furniture can emit a large number of VOCs. A series of tests were conducted in full-scale stainless steel chamber (5 m x 4 m x 2.75 m high) to determine the emissi source and sink characteristics of an office workstation furniture system under cond commonly maintained in office buildings (Zhang et al., 1997). During the test, the
hamber was maintained at 23 ºC, 50% RH, and 5 ac/h supply air rate including 0.5 ac/h c
ventilation (outdoor air supply) rate. Emissions of a total of 45 VOCs were id (listed in Table 1).
Table 1. VOCs emitted from the office workstation
Aliphatic Hydrocarbons Butane; Pentane; alpha-Pinene; Decane; Limonene; Branched C11;
Undecane; Branched C12; Dodecane; Derivative of neoprene; Hexadecane. Aromatic Hydrocarbons Benzene; Toluene; Ethylbenzene; o-, m-, p -Xylene; Styrene
Propylbenzene; Trimethylbenzenes; 4-Phenylcyclohexene (4-PC). ;
Aldehydes Pentanal; Hexanal; Heptanal; Octanal; Nonanal; (E)-2-Nonenal; Decanal. Ketones Acetone; 2-Butanone; Acetophenone.
Chlorinated Hydrocarbons
Trichloromonofluoromethane; Methylene Chloride; 1,4-dichlorobenzene. Alcohol Methanol; Ethanol; Isopropanol; 2-butoxy-ethanol; Undecanol.
Others Carbon disulfide; Acetic Acid; Propanoic acid, 3-ethoxy-, ethyl ester; Phenol; 2,6-t-Butylo, p-chinon; Butylated Hydroxytoluene (BHT).
Of the 45 VOCs, the six most abundant compounds were: nonanal, phenol, toluene, isopropanol, pentane, and acetone. Figure 1 shows the emission rates of the TVOC and these six most abundant VOCs. As shown, at a constant ventilation rate, after reaching its peak value, the concentration of each VOC decreased rapidly for about 10 hours an became relatively constant afterwards.
d 4.0 0.0 0.5 1.0 0 1.5 2.0 12 24 36 48 60 72 Time (h)
Chamber air conc. (mg/m
3.5
- Office workstation - Full-scale chamber (55 m3) - Air change rate: 0.5 ach - Loading ratio: 0.52 m2/m3 2.5 3.0 3 ) TVOC Pentane Toluene i-Propanol Phenol Nonanal Acetone
Static test Dynamic test
Figure 1. Measured concentrations of TVOC and selected VOCs emitted from an office workstation furniture system
It should be noted ct". Sink effect
refers to the proc s in the air and
i clothing that remains lon
e test
workstation, the degree ng
point . In ot
points octano
such nzene
VOC le buildin
ir samples were taken in 24 Canadian workplaces and 25 Canadian houses and analyzed OCs
Table 2. VOCs in Canadian Workplaces and Houses (mg/m3)
that the test office workstation also exhibited "sink effe ess by which some materials and furnishings adsorb VOC
re-emit them at a later t me. An example is the smell of cigarette smoke in hairs and g after leaving a public place where smoking is allowed. Sink effect increases the time required for VOCs to approach their stable levels. For th
of sink effect was found to be directly proportional to the boili of the VOC her words, the sink effect for VOCs with relatively high boiling
,
as dichlorobe
such as 1 l was greater than that for compounds with lower boiling points, and decane.
vels in gs
A
for their VOC content (Tsuchiya and Kanabus-kaminska, 1990). Of the total of 66 V detected, 34 were found in the workplaces and 56 were detected in homes. The VOCs that were detected at least four times, and in both workplaces and homes, are listed in Table 2.
VOC 24 Offices (mean) 25 Houses (mean)
Benzene 0.001-0.021 (0.008) 0.002-0.064 (0.017) Toluene 0.002-0.072 (0.028) 0.003-0.159 (0.049) Xylene 0.003-0.071 (0.020) 0.002-0.167 (0.033) C3benzene 0.003-0.095 (0.027) 0.003-0.054 (0.016) CCl3CH3 0.004-0.071 (0.034) 0.003-0.063 (0.029) C2Cl4 0.001-0.026 (0.011) 0.009-0.070 (0.032) Dichlorobenzene 0.001-0.085 (0.020) 0.012-0.327 (0.115) Ethanol 0.019-0.387 (0.119) 0.022-0.561 (0.183) isoPropanol 0.05-0.13 (0.102) 0.014-0.897 (0.274) Propanone 0.001-0.447 (0.074) 0.005-0.196 (0.069) TVOC 0.1-13.3 (2.5) 0.1- 8.6 (1.8) TVOC without copier (1.2)
Part II – Actions Determining the Indoor Environment
This part of the report provides building owners, managers, and engineers with the technical information and skills that are required to manage their buildings. Issues such as preparation of specifications for low-emitting building materials/products,
identification of potential IAQ problems, and evidence supporting the best building operation practices for achieving acceptable indoor air quality are discussed.
Proactive Plans for Minimizing VOC Effects
The best solution to minimize VOC effects in office buildings is to develop a proactive
ow-emitting building materials/products
ing s/pro ts is ask a
ateria p ame
erials ng a poten al ma
milar
ampl l fo esting ffice M
Table 3
g p ogram
miss n Fac nder CCI/CRI Carpet Labelling Program
Chemical Emissions (mg/m2/h)
plan that focuses on eliminating VOC sources rather than treating the symptoms. Two measures that have been successfully used to reduce VOC concentrations in the indoor air are the use of low-emitting materials/products and the venting of airborne
contaminants associated with renovation and installation activities directly outside.
L
The best way to identify low-emitt material duc to ll potential suppliers to submit their m l/product sam les to the s laboratory for testing. Given that hundreds of mat are used in buildings, testi ll ti terial samples may not always be practical. A more practical way is to ask potential suppliers to submit emission test reports or si information. It appears that in anticipating such demands, several manufacturers' associations have developed protocols for helping their members to evaluate their products. The Business and Industry Furniture Manufacturers Association (BIFMA), for ex e, has developed a protoco r t o furniture (BIF A, 2000). The Carpet and Rug Institute (CRI) has developed a carpet labelling program for its members. shows the maximum emission factors of total VOCs (TVOC) and selected VOCs under the Canadian carpet labellin r (CCI, 1993).
Table 3. Maximum E io tors u
4-Phenylcyclohexene (4-PC) 0.1
Formaldehyde 0.05 Styrene 0.4 TVOC 0.6
Large organizations may consider developing a material emission database for internal use, by contracting laboratories to conduct emission testing on frequently used materials and products. In addition, the technical personnel can use software such as MEDB-IAQ (Zhang et al., 1999) to predict the effects of these materials and products on the IAQ level
of a reference building to determine the maximum allowable emission rates of new d ventilation rategy. ed for ials IRC/NRC materials and products or to explore trade-offs between material selection an
st
As an interim measure, Table 4 provides some default TVOC values that may be us specifying low-emitting materials (Tucker 1990, Zhang et al. 1997).
Table 4. Default TVOC Values for Specifying Low-Emission Mater
USEPA EF @ 30 d (mg/m2/h) 1,2 Material/Product Max EF (mg/m2/h)1 Material/Product Min Max
Flooring 0.6 Vinyl flooring 0.05 1.71
Underpad 0.02 0.19
Carpet 0.01 0.46
Floor coatings 0.6 Wood stain 0.01 0.54
Polyurethane coating 1.01 12.06
Floor wax 0.17 0.99
Paint/Primer 0.32 6.39
Wall covering 0.4
Partitions 0.4 Office Furniture 2.5 mg/h per WS
Office Machines 0.25 mg/m3/h
Workstation 0.5 mg/h
Others Particleboard 0.50 1.87
Plywood 0.12 0.29
Oriented strand board 0.18 3.72
Solid wood 0.06 2.15 Gypsum board 0.02 0.23 Acoustic tile 0.018 0.023 Adhesive 0.0 109.7 Caulking sealant 18.7 928.2 1
The unit is mg/m2/h unless otherwise specified.
2
The emission factors at 30 days were estimated using a power-law model determined data. The values are the minimum and maximum emission factors among those determined from three products in each category.
Minimizing material emission effects during installation/renovation
Installation and renovation activities lead to a significant increase in the VOC levels indoors. Because this increase is temporary, special measures can be used to minimize the effect. Figure 2 shows the TVOC profile immediately following recarpeting in an office.
The results indicate that the TVOC level
installa ble
alue after 10 days.
is the highest immediately following the tion of the new carpeting, then decreases sharply with time, approaching a sta v
igure 2. TVOC p ofile immedia rpetin ffice (This graph was supp d Dr. Gemma Enviro al L
Fig ence
oo ry building (Zhu et al. 1999). Similar to the results of Figure 2, e TVOC concentration shown in Figure 3 is the highest immediately following
novation. It then decreases sharply with time, becoming relatively stable at around mg/m3 after about one week. It decreases continuously at a much slower rate to a value of 0.14 mg/m3 after 14 weeks.
The results shown in these two figures collectively illustrate the benefit of removing the increased amount of VOCs generated from renovation activities. Makeshift exhaust systems such as open windows, portable exhaust fans, and smoke shafts, should be used to vent VOCs directly to outside during renovation (time of highest VOC concentrations). Immediately following the renovation, for a period of one to two weeks, the VOC
F r tely after reca g
n nt an o
lie Kerr, InAir me td.)
ure 3 shows the TVOC profile during and after a major renovation of a confer m in an office-laborato
r th re 1
concentration is expected to be moderately greater than the level normally experienced in on rate, hould be capable of handling the extra VOC load.
the building. The building’s HVAC system, operated with an increased ventilati s 0.1 1 10 100 1000 0 500 1000 1500 2000 2500 Elapsed time (h) TVOC (mg/m3)
C arpet installation started C arpet installation com pleted
w eekend
M eeting in progress Lighting and ceiling
installation com pleted N ew chairs
H V AC failure
N ew tables
T V O C levels during and after renovation of a conference room
Figure 3. TVOC profile during and after a major renovation of a conference room
Diagnostic techniques for identifying potential IAQ and ventilation problems
he most effective way to maintain an acceptable indoor air quality in buildings is to a
). The inspection team usually includes the property
Visual inspection
T
adopt a preventive approach by regularly conducting a visual inspection, also known as walk-through inspection, together with an assessment of the operation of the building’s HVAC systems. A walk-through inspection allows potential environmental problems to be identified and corrective actions to be taken before significant problems develop. A step-by-step procedure for conducting such an inspection is given in the first of the three PWGSC/NRC Manuals entitled, "Managing Indoor Air Quality – A Manual for Property
anagers" (PWGSC/NRC, 1990 M
manager, building operator, health and safety officer, consultant, and other interested parties.
Detailed measurement
Unfortunately, not all potential problems can be identified by a walk-through inspection: tests and measurements are required sometimes. The methods commonly required for
onducting detailed measurements are given in the second PWGSC/NRC Manual ntitled, "Controlling Indoor Air Quality - Ventilation Engineering Guide" c
e
(PWGSC/NRC, 1992).
It should be pointed out that not all test results will lead to concrete conclusions. The measurement of VOC levels in buildings is an example. A detailed VOC test involves taking air samples and analyzing them to identify the VOCs and determine their concentrations. However, there is a lack of established criteria for determining "acceptable" VOC concentrations in office and residential buildings.
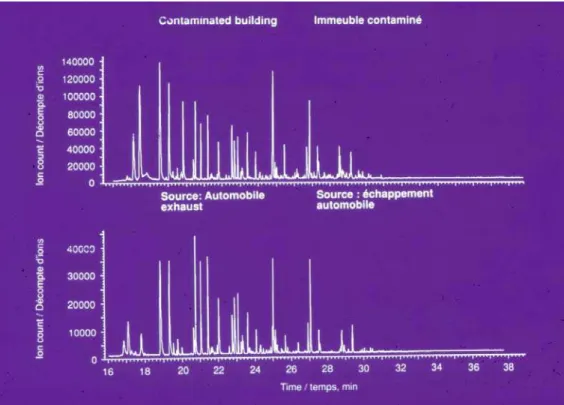
Figure 4shows a meaningful way to use the VOC test that does not require the identification of "acceptable or unacceptable" VOC levels.
Figure 4. Gas chromatograms of a contaminated building and an automobile exhaust
There are two gas chromatograms shown in Figure 4. The upper one was obtained from a contaminated building. Since it was suspected that the main contamination source w the autom
as obile exhaust from an adjacent parking lot, the gas chromatogram of the xhaust gas of an automobile is shown on the same figure. The close resemblance of these two gas chromatograms clearly confirms that some of the automobile exhaust did e
enter into the building through a nearby air intake. Because this method does not require
geous easure and practical to use. Unfortunately, the
r sed as an ntrations ts' complaints) is eeded to draw the correct conclusions in attempting to diagnose suspected IAQ
alancing between acceptable IAQ and energy use
The m tion (dilu ired. Air clean ay ost the comm s for offi range from 0.
Because viruses need a host in attached to bacteria or an object.
a quantitative analysis of VOCs it is suitable for use by non-technical people. The search for a simple pass and fail criterion for assessing indoor air quality has prompted the use of TVOC levels as an IAQ index. Using TVOC levels is advanta because they are relatively easy to m
advantages do not outweigh the major disadvantage that there is little scientific basis fo using TVOC as an IAQ indicator. The TVOC level does not recognize that VOCs have different toxicities. However, until a better index can be found, TVOC may be u indicator for possible IAQ problems. Additional information (CO2 levels, conce
of individual VOCs, walk-through inspection results, details of occupan n
problems.
B
ost commonly used strategy for controlling VOCs / IAQ in buildings is ventila tion). To maintain an acceptable IAQ, a large amount of ventilation air is requ On the other hand, to conserve energy, the ventilation rate should be as low as possible. Therefore, to satisfy both, air cleaning and source control must be used together with ventilation to maintain acceptable IAQ.
Air cleaning
ing is the use of filtration techniques to remove contaminants from both the ventilation (outdoor) air and the indoor air. These techniques are essential for buildings located in urban centres or near industrial plants where the quality of the outdoor air m be worse than that of the indoor air. In office buildings, air filters are installed in alm all HVAC systems to remove dust and other particulate contaminants. A brief review of
only used air filters is given below (Miller, 2002).
High Efficiency Particulate Air filters (HEPA filters) are installed in HVAC system ce buildings, laboratory buildings, hospitals, and clean rooms. HEPA filters are 99.97% efficient in capturing 0.3 micron particles. The sizes of most known bacteria
2 to 0.3 microns, and those of viruses range from 0.01 to 0.3 microns. which to live, they are usually
High efficiency air filters have a similar construction to HEPA filters. The efficiency ranges from 60% to 95% for bacteria and water droplets carrying viruses with sizes varying from 0.2 to 0.5 microns. For particles 1 micron or larger (e.g., anthrax), the efficiency increases to 99% or higher.
Activated carbon filters are used to remove odours and gaseous contaminants. This type of filter is not effective at adsorbing VOCs in the ppb (parts per billion) concentration
nge which are normally found in indoor air.
ency
to the his can be achieved by minimizing the use of building materials and roducts with high emissions and by venting VOCs from identified sources directly
is yet to be recognized idely by building owners and managers as evidenced by the oft-used statement "the ra
Electrostatic air cleaners with UV emitters are currently used in buildings, laboratories, and restaurants for removing contaminants and cigarette smoke. Their capture effici is 95% at 1 micron and decreases to 33% at 0.3 micron.
Source control
The primary function of source control is to prevent contaminants from getting in indoor air. T
p
outside, if practical. This method is the most economical and effective strategy for controlling VOCs/IAQ in buildings. Its usefulness, however,
w
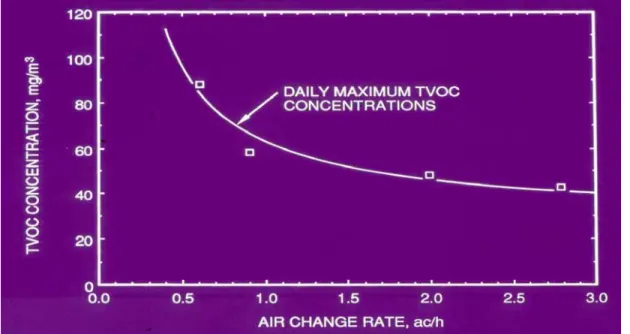
solution to pollution is dilution." Figures 5 and 6 illustrate the benefit of source control.
Figure 5. TVOC profile for a typical working day in a photocopying unit of a library
ea ks, ods hen most of the photocopying was being done. Figure 5 shows the measured TVOC profile of a typical workday in a problem work ar where a number of photocopiers were located. The results showed that two large pea indicating high concentrations of VOC’s, occurred at 9 a.m. and at 2 p.m. These peri corresponded closely with the periods w
To determine whether ventilation alone could eliminate this pollution problem, the ventilation rate in the building was increased six-fold in stages from 0.5 to 3 air change per hour and the TVOC concentrations were mo
s nitored for each air change rate. Figure 6 hows the relationship observed between TVOC concentration and air change rate. The
e TVOC concentration to 5 ppm.
s
results indicated that as ventilation rate increased from 0.5 to 1 air change per hour, the TVOC level decreased by about 30 ppm from 90 ppm to 60 ppm. A further increase in ventilation rate from 1 to 3 air changes per hour reduced th
4
an
Figure 6. Daily maximum TVOC concentration vs. air change rate
The results suggest that the initial increase in the air change rate (from 0.5 to 1 ac/h) was very effective in reducing the TVOC concentration. Further increases in the air change were not nearly as effective. The results suggest that ventilation alone may not be able to lower the contamination level to a pre-set value when a prominent source of
contaminants is present. In the case of an identifiable contaminant source such as a photocopier, a combination of source control, i.e., venting the exhaust of the photocopier directly to outside, plus ventilation to dilute generally dispersed contaminants is usually
effective approach to manage of the IAQ.
Ventilation.
The most frequently used strategy, and in most cases the only one available to building operators, is ventilation. Ventilation costs money because the outdoor air drawn into the building needs to be heated in winter and cooled in summer. To conserve energy, care
ust be taken to maximize the efficiency of the ventilation system. In this regard, a m
number of factors come into play. The factors affecting ventilation and energy use include air leakage and adequate ventilation.
Air leakage - air leakage is the infiltration of air through the building envelope. This uncontrolled flow of air through accidental openings in the building envelope can interfere with the intended function of the HVAC systems. Leaky buildings are more costly to heat and more difficult to ventilate properly than relatively airtight buildings. Figures 7 and 8 illustrate the effect of air leakage on ventilation air distribution and
nergy use
e .
m
Figure 7 shows a typical floor plan of a five-storey apartment building, indicating the locations of individual apartments. For this building, ventilation air is supplied to the corridor, and intermittently operated exhaust fans are located in each apartment. The design intention is to pressurize the corridor so that the ventilation air supplied to the corridor will flow into each apartment unit, preventing airflows from apartments into the corridor.
The tracer gas decay method was used to determine how well the design works. The ethod involves the injection of a small amount of tracer gas into the supply system and periodic measurements of the tracer gas concentrations at six locations on each floor. The detection of tracer gas at a measuring location means that the ventilation air has reached that location. The movement of the ventilation air could be best illustrated by comparing the measured tracer gas concentrations at two locations: Apts._02 and _08, one on each side of the corridor.
Floor plan of a typical floor in a five-storey apartment building Figure 7.
Figure 8 shows that immediately after the injection of tracer gas, the tracer gas was detected at Apt.208 but not at Apt.202. This suggests that the units on one side of the
its ied
r. corridor were over-ventilated (because they also received the ventilation air for the un across the corridor) and that those on the other side were either under-ventilated or rel on air leakage for ventilation. As a result, additional energy was needed to heat that ai For proper ventilation, it is necessary to minimize air leakage.
Figure 8. Ventilation air distribution on a typical floor
Adequate ventilation - adequate ventilation, from the engineering point view, should ree conditions: acceptable outdoor air supply, adequate ventilation rate, and proper air distribution.
Acceptable outdoor air supply means that the outdoor air supply should not be inated by nearby pollution sources, such as parking lots, cooling towers, large green space where fertilizer and pesticides are frequently used, etc. For HVAC
engineers, this means that air intakes should be located as high in the building as practical and as far from adjacent contaminated sources as possible. Adequate ventilation rate is achieved when the ASHRAE recommendations are met (ASHRAE Standard 62, Ventilation for Acceptable Indoor Air Quality, 1999). For office buildings, the
ventilation rate should be 10 L/s per person or 20 cfm per person. Proper air distribution requires ventilation air to be delivered to the occupants, i.e., throughout the occupied satisfy th
contam
space.
CO2 demand-controlled ventilation - A CO2 demand-controlled ventilation system can
elp balance indoor air quality with energy consumption by regulating the ventilation air rate based on the number of occupants in the building or in a particular space in the building. The feasibility of using such a system to control the ventilation rate in office building is briefly discussed below.
The American Society of Heating, Refrigerating, and Air-Conditioning Engineers (ASHRAE) recommends ventilation rates for buildings based on the maximum (design) number of occupants. For buildings such as office complexes and schools, where the number of occupants varies significantly over time (i.e., the building is typically occupied only during the day), it may be possible to control ventilation rates based on the number
f occupants at a given time. One approach for office buildings is the demand-controlled ventilation system, which uses occupant-generated CO as the control index. The
l the ts therm off. A CO e according rate, a bu • • The CO2 co throughout
the space, a 2 ors, (where
the concentrations of CO2 are representative of those throughout the building, or the
space, i.e., the interior air should be well-mixed).
s criteria, IRC conducted a study in a 22-storey office tower with
3
of imeter,
g to the
drops somewhat during the lunch hour, then picks up as the employees return to ork and peaks again around 4 p.m. Once the occupants begin to leave, the
ed r, nt provides a good indication of the CO2
o
2
ventilation controllers used in such systems are similar to thermostats used to contro furnaces in homes. Thermostats are located in places where the temperature represen roughly the average temperature of the whole house. As the temperature at the
ostat location rises and falls, the thermostat sends a signal to turn the furnace on and
2–based demand-controller senses the CO2 concentration at a representativ
location in a building and sends a signal to turn on or turn off the ventilation fans ly.
Studies in office buildings have shown that the concentration of CO2 increases and
decreases with the number of occupants. Therefore, it is possible to control ventilation rates based on measured CO2 concentrations.
In order for occupant-generated CO2 concentrations to be used to control the ventilation
ilding, or a space, should meet the following three conditions:
The CO2 concentration must be proportional to the actual number of occupants.
ncentration must be approximately the same on all floors, or nd there must be suitable locations for placing the CO sens
• There must a relationship between the CO2 concentration and the air change rate.
Using these conditions a
an interior volume of approximately 113,700 m . The building has seven all-air constant-volume supply-air systems and two return-air systems. Four of the supply systems provide air to the interior zones of the east and west floors in the upper and lower half the building. The remaining three supply systems provide air to the southern per the east and eastern half of the northern perimeter, and the west and western half of the northern perimeter, for the entire height of the building.
The results shown in Figure 9 confirm that the CO2 concentration varies accordin
number of occupants and the first condition is met. The CO2 concentration is low during
the night. It begins to rise as the employees arrive in the morning and peaks around noon. It
w
concentration drops continuously until it reaches the nightly level.
On all test floors, the CO2 concentrations measured at various locations in the occupi
spaces agreed closely with the concentration measured at the return-air shaft of that floo suggesting that the latter measureme
concentration for the entire floor. Similarly, the CO2 concentrations measured at the
ops of return-air intakes of individual floors agreed closely with the measurements at the t the two main return-air shafts. The finding suggests that the tops of return-air shafts are suitable locations for CO2 sensors. The second condition is met.
Measured CO2 Concentrations at Floorspace Locations
400 500 600 700 800 900 e ntra tion [ppm] 2F 5F 8F 11F 18F 100 200 300 CO2 Conc 20F Outdoors 0 0 4 8 12 16 20 24 Time of Day [h]
Measured CO2 Concentrations in Return Air Plenum Locations
900 800 200 300 400 500 600 CO2 Concentration [ppm] 700 2R 5R 8R 11R 18R 20R SHAFT ROOF 0 100 0 4 8 12 16 20 24 Time of Day [h]
The final step in the above study was to establish the relationship between the measur CO
ed
CO2 concentrations
nd the air change rates. Thus, a CO2-based demanded-controlled system can be used to
ontrol the building’s ventilation rate and provide potential energy savings by helping to
2 concentrations and the air change rate. Figure 10 shows the daily maximum and the
daily average CO2 concentrations at the various air change rates (ventilation rates). The
results suggest that a good correlation exists between the measured a
c
avoid periods of excess ventilation.
Figure 10. Relationship between daily maximum (or average) CO2 concentration
Part III – Best Practice for Managing IAQ-VOCs in Office
buildings
Select low-emission building materials and products • Ask potential suppliers and /or manufacturers to supply:
− emission test reports (VOC emission rates, testing laboratory, and test methods and conditions);
•
− data useful for assessing potential emissions;
− simulation results demonstrating the impact on the IAQ of existing buildings. Develop a database for internal use by:
− conducting emission testing on materials and products from potential suppliers and manufacturers;
− using the MEDB-IAQ software tool to predict the effects on the IAQ .
In the absence of measured data, use the values (USEPA and IRC/NRC) in Table 5 as default emission factors for simulation calculations to estimate the IAQ consequences of various material and product choices. The emissions of each source are considered constant in this case.
Table 5. Emission factors (EF in mg/m2/h) for TVOC
USEPA IRC/NRC 2
EF @ 24 h 1 EF @ 96 h 1 Material/Product
Max EF 1 Min Max Min Max
Flooring Particleboard 0.6 3.87 6.90 2.12 4.35
0.46
Plywood 0.22 0.67 0.19
1.76
Oriented strand board 0.27 0.98
3.55 Solid wood 0.07 4.53 0.05 2.73 Vinyl flooring 0.05 3.77 0.07 Underpad 0.10 0.45 0.28 Carpet 0.20 1.91 0.07 0.99
Floor coatings Wood stain 0.6 18.2 124.4 52.3
Polyurethane coating 88.1 154.5 3.88 359.3
Floor wax 51.4 409.0 5.55 26.0
Paint/Primer 29.9 216.2 0.34 19.0
Wall/ceiling Gypsum board 0.4 0.07 4.50 0.05 3.55
covering Acoustic tile 0.06 0.17 0.04 0.23
Partitions 0.4
Office Furniture 2.5 mg/h per WS
Office Machines 0.25 mg/m3/h
Workstation 0.5 mg/h
Others Adhesive 3.28 659.1 3.88 359.3
Caulking sealant 448.0 10467.2 51.13 3842.6
1
The units are mg/m2/h unless otherwise specified.
2
The values are the minimum and maximum emission factors among those determined from testing three products in each category.
Minimize material emission effects during installation and renovation
llation and renovation:
ply air system operating; ummer only), a smoke − st fans to assist this venting.
•
r city and outdoor air temperature (watching − ks, depending on outdoor air temperature, return the HVAC
kes as high as possible in the building;
− locating uch as cooling
towers, exhaust system
, street traffic, and plum ks;
− install drains, louvers, wire-mesh screens inside air ent ra als from entering the HVAC system.
ly air to zone and avoid rt-circuiting supply air to return grilles. Improve building envelope airtightness.
Provide dedicated exhaust for localized em sion sourc
Take advantage of free-cooling, when weather conditio rmit. Control ventilation rates using occupant-generated CO asib
to depressu
bui ze the pa attenda ooth utdo r.
Pressurize sta bies serving the garage floors by: − using tigh -closing doors,
g aro pipes that ex through arage her a stalling and alarm; link them to venti syst ntrol
rize the reas adjacent to the loadin ck with a separate supply air system by: sily closed access doors with self-closing devices (leading to adjacent
auto doors or a rtain
ind-induced ai activities • During insta
− isolate the affected area from the rest of the building; − seal off return air grilles in the affected area and keep sup − vent the affected area through leeward side windows (s
shaft, or stair shafts with outside doors at roof top; use portable exhau
Immediately after completion:
− operate HVAC systems with a ventilation rate of up to 20 L/s/person (40 cfm), o greater depending on the system capa
closely for warnings of coil freezing); after two to four wee
system operation to the normal ventilation rate.
Balance IAQ with energy use through effective use of ventilation • Avoid contaminated ventilation air by:
− locating air inta
air intakes as far away as possible from pollution sources s
discharges, chimneys and stacks, loading dock entrances,
parking lots bing stac
intakes to prev in, debris, insects and s
Supp mall animied
• the occup sho
•
• is es.
• ns pe
• 2, if fe le.
• Operate the ventilation system rest of the
r rking
ize the parking garage with respect to the lding, and pressuri
elevator lob
nt’s b with o or ai
• irwell and
t-fitting, self
− sealin und ducts and tend the g to ot reas,
− in CO sensors lation em co s.
• Pressu a g do
− installing ea areas);
− using matic vehicle entrance and exit ir cu s to minimize w r infiltration.
Establish an effective preventive maintenance program • Develop a preventive maintenance manual including:
s and schedules for implementation; ;
ne
• r environment standards,
d the building’s HVAC control system. • r
are • r
controls include:
− CO sensors in parking garages and other locations; − CO sensors;
• −
rotective
follow closely manufacturers’ instructions when cleaning fluids are used; − clean up water spills as soon as possible to prevent mould growth.
− preventive maintenance procedure
− calibration instructions and schedule for various sensors − HVAC fault-identification and fault-location procedures;
− equipment information such as warranty coverage and manufacturers' help hotli contact coordinates.
Ensure that building operators are familiar with indoo potential contaminant sources, an
• Maintain a thorough log of all maintenance activities.
Pe form annual checks on HVAC system operation by ensuring that all components functioning, properly adjusted and maintained. Pay particular attention to fans, air filters, humidifiers, and dampers.
Se vice controls by testing, calibrating, and adjusting sensors at least annually. These
− thermostats, humidity sensors, and pressure sensors;
2
− time clocks, and
− dampers and valves, and their actuators. Check and replace air filters:
as recommended by the manufacturer; as indicated by pressure sensors; or −
− when wet or damaged to prevent microbial growth.
• Ensure that air filters are functioning properly by ensuring that they fit their frames properly.
• Perform regular cleaning of system components to minimize dusts, bacteria and mould that may get into the supply air. (Use appropriate personal p
equipment). Components to be regularly cleaned include: − electrostatic precipitators;
− humidifiers;
− fan coil units, radiators and induction units; − cooling towers;
− air intakes, and air ducts; and − refrigerant coils.
• nd
standing water (Use appropriate personal protective equipment). Also: Perform regular maintenance. Pay attention to mechanical rooms, fan rooms, a − replace damaged ceiling tiles promptly if the above-ceiling space is used as a
supply or return air plenum;
− store chemicals and cleaning products properly to avoid contamination of the ventilation air;
Act proactively to manage IAQ & VOCs
• Develop a proactive program for managing IAQ & VOCs by conducting an annual al walk-through building inspection using, as a guide, the check list in the manu Managing Indoor Air Quality published by NRC/PWGSC. Correct any identified •
− eling may have intermittent IAQ problems due to chemical ng or paneling). ventilation to reduce ozone
s
levels of CO2 and TVOC are over 800 ppm and 2.5 mg/m ,
at lower levels, i.e., y.)
• logs of all occupants’ complaints and remedial work. • rements without knowing how to interpret the results.
• een building managers, operators, and
ent of IAQ in the workplace. Q problems”.
• o ion of the IAQ. This task should be
ing and interpreting
g
Ac
Thi tu m for Material Emissions and IAQ
Mo l nel for Energy Research and
Dep tm arch Council Canada. The authors wish to thank
Ms i eport. AS A ard 62-BIF A furn r wor ta
potential IAQ problems as soon as possible.
Consider these additional tips for conducting a successful building inspection: Offices with wood pan
reactions between ozone (often produced by office machines and free-standi desktop air-purifiers) and α-pinene (contained and emitted by the wood Exhaust office machines directly outside or increase
concentrations indoors.
− Pay careful attention to inadequate airflow from supply air diffusers, the location of air intakes, draughts, noise, glare on VDTs, odours, and wet surfaces. − If feasible, measure concentrations of CO2 and TVOC. Consult technical
personnel if the 3
respectively. (Note: occupant complaints may occur
3
600 ppm, and 1 mg/m for CO2 and TVOC, respectivel
Maintain thorough Avoid complex measu
Facilitate and encourage communication betw ctive managem occupants. It is essential to effe
• Avoid using phrases such as “identifying IA ss Av id asking occupants about their impre
conducted by professionals specially skilled in administer occupant questionnaire surveys.
• Consider contracting a professional to conduct an occupant survey before performin expensive diagnostic tests.
o
kn wledgement
s s dy is sponsored by members of the Consortiu EIAQ-II), and Canadian Pa del ing - Phase II (CM
ar ent (PERD), and National Rese Al son Danforth for reviewing this r
References
HR E, 1999. Ventilation for acceptable indoor air quality, ANSI/ASHRAE Stand 1999, ASHRAE.
, 2000. American
M National Standard for panel-based workstations, Office itu e-test for formaldehyde and TVOC emissions for low-emitting panel-based ks tions, BIFMA, International, 2000.
CCI, 1993. Indoor air quality carpet testing program, Canadian Carpet Institute, 1993.
Can
Jon tmospheric Environment 33,
pp.4535-Miller, Decem
MRC IEH, 1999. Volatile organic compounds )including formaldehyde) in the home, MR I
www.le
Health Canada, 1989. Exposure guidelines for residential indoor air quality, Health ada, 1989.
es, A.P., 1999. Indoor air quality and health, A 4564, 1999.
J.D., 2002. Defensive filtration, ASHRAE Journal, ASHRAE, pp.18-28, ber 2002.
C nstitute for Environment and Health, University of Leicester, UK, 1999, .ac.uk/ieh.
PWGS ,
IRC, N
uide, IRC,
Tsu ,
of Modern Society), Ste.
Tuc lim
H s: exposure and health effects, EURO Reports and tudies No.78, World Health Organization, Copenhagen.
oidance and productivity in owning and operating buildings,
onment, V. 33, No. 6, pp.357-374. bus-Kaminska, M, Shaw,C.Y., Lusztyk, E., Magee, R.J., Brouzes, .A., Nong, G, and Wang, J.W., 1997. Characterizing the emissions of volatile organic
ashington, D.C., vol. 3, pp. 521-526.
ase of , May 3-5, 1999, Denver, USA.
C/NRC, 1990, Managing indoor air quality - a manual for property managers RC, 1990.
PWGSC/NRC, 1992. Controlling indoor air quality - ventilation engineering g NRC, 1992.
chiya, Y. and Kanabus-kaminska, J.M., 1990. Pilot study on indoor air quality presented at the NATO/CCMS (Committee on the Challenges
Adele, Quebec, August 1990, IRC-P-3001.
ker, W.G., 1990. Building with low-emitting materials and products: where we are stand?, Proceedings, The fifth International Conference on Indoor Air Quality and C ate, Indoor Air'90, Vol.3, pp.251-256, Toronto, Canada.
O, 1983. Indoor air pollutant W
S
Woods, J. E., 1989. Cost av
Problem buildings: building-associated illness and the sick building syndrome (Cone, J.E. and Hodgson, M.J., eds), Occup Med State of Art Rev, 1989, Vol. 4, pp. 575-92.
Yu, C. and Crump, D., 1998. A review of the emission of VOCs from polymeric materials used in buildings, Building and Envir
Zhang, J.S., Kana M
compounds from a workstation system, Healthy Buildings/IAQ 97- Global issues and regional solutions, W
Zhang, J.S., Zhu, J.P., Magee, R.J., Lusztyk, E., Yan, A., and Shaw, C.Y., A datab VOC emissions from building materials, Proceedings, the first NSF International Conference on Indoor Air Health, pp. 87-96
Zhu, J.P., Zhang, J.S., Magee, R.J., and Shaw, C.Y., 1999., Measurement and modelling the Conference on Indoor Air Quality and Climate, Indoor Air'99, Vol. 5, p.235-240, Edinburgh, Scotland, 1999.
of indoor VOC levels during and after room renovation - a case study, Proceedings, 8th International