Publisher’s version / Version de l'éditeur:
Vous avez des questions? Nous pouvons vous aider. Pour communiquer directement avec un auteur, consultez la première page de la revue dans laquelle son article a été publié afin de trouver ses coordonnées. Si vous n’arrivez pas à les repérer, communiquez avec nous à [email protected].
Questions? Contact the NRC Publications Archive team at
[email protected]. If you wish to email the authors directly, please see the first page of the publication for their contact information.
https://publications-cnrc.canada.ca/fra/droits
L’accès à ce site Web et l’utilisation de son contenu sont assujettis aux conditions présentées dans le site LISEZ CES CONDITIONS ATTENTIVEMENT AVANT D’UTILISER CE SITE WEB.
Water Management Challenges in Global Change CCWI2007 and SUWM2007 Conference [Proceedings], pp. 223-228, 2007-09-03
READ THESE TERMS AND CONDITIONS CAREFULLY BEFORE USING THIS WEBSITE.
https://nrc-publications.canada.ca/eng/copyright
NRC Publications Archive Record / Notice des Archives des publications du CNRC :
https://nrc-publications.canada.ca/eng/view/object/?id=a5457ee5-7abf-482a-befc-6e7666dce8db https://publications-cnrc.canada.ca/fra/voir/objet/?id=a5457ee5-7abf-482a-befc-6e7666dce8db
NRC Publications Archive
Archives des publications du CNRC
This publication could be one of several versions: author’s original, accepted manuscript or the publisher’s version. / La version de cette publication peut être l’une des suivantes : la version prépublication de l’auteur, la version acceptée du manuscrit ou la version de l’éditeur.
Access and use of this website and the material on it are subject to the Terms and Conditions set forth at A Novel modelling approach to predict risk of water quality failures in deteriorating water mains
http://irc.nrc-cnrc.gc.ca
A n o v e l m o d e l l i n g a p p r o a c h t o p r e d i c t r i s k o f
w a t e r q u a l i t y f a i l u r e s i n d e t e r i o r a t i n g w a t e r
m a i n s
N R C C - 4 9 5 0 9
S a d i q , R . ; K l e i n e r , Y . ; R a j a n i , B . ; T e s f a m a r i a m ,
S .
A version of this document is published in / Une version de ce document se trouve dans: Water Management Challenges in Global Change CCWI2007 and SUWM2007
Conference, Leicester, UK, Sept. 3-5, 2007, pp. 1-5
The material in this document is covered by the provisions of the Copyright Act, by Canadian laws, policies, regulations and international agreements. Such provisions serve to identify the information source and, in specific instances, to prohibit reproduction of materials without written permission. For more information visit http://laws.justice.gc.ca/en/showtdm/cs/C-42
Les renseignements dans ce document sont protégés par la Loi sur le droit d'auteur, par les lois, les politiques et les règlements du Canada et des accords internationaux. Ces dispositions permettent d'identifier la source de l'information et, dans certains cas, d'interdire la copie de documents sans permission écrite. Pour obtenir de plus amples renseignements : http://lois.justice.gc.ca/fr/showtdm/cs/C-42
A novel modelling approach to predict risk of water quality failures in
deteriorating water mains
Rehan Sadiq, Yehuda Kleiner, Balvant Rajani, Solomon Tesfamariam
Institute for Research in Construction, National Research Council, Ottawa, Ontario, K1A 0R6, Canada
ABSTRACT: The impact of deteriorating pipes on water quality in the distribution network has not been con-sistently taken into account in decision-making process for pipe renewal. This paper reports on an on-going research project to investigate the effects of aging water mains on water quality in distribution networks and integrating it into the prioritization of pipes renewal decision-making process.
A novel modelling approach was developed to quantify the intricate water quality failures in distribution net-work. The model can incorporate uncertain, subjective/ linguistic and/ or incomplete data. The proposed model is based on an approach, called fuzzy cognitive map, which is a plausible way to represent and com-prehend ill-defined and complex relationships such as those that govern water quality in the distribution net-work. This paper provides a brief overview of the methodology and the approach developed in this research using a simple hypothetical example.
1 INTRODUCTION - WATER QUALITY DETERIORATION MECHANISMS
Water quality is generally defined by a collection of upper and lower limits on selected performance in-dicators (Maier 1999). Therefore, a water quality failure (WQF) refers to an exceedance of one or more water quality indicators from specific regula-tions, or in the absence of regularegula-tions, exceedance of guidelines or self-imposed limits driven by customer service needs (Sadiq et al. 2004).
Water quality failures that compromise either safety or aesthetics of water in distribution net-works, can generally be caused through the follow-ing deterioration mechanisms (Kleiner 1998): a) Intrusion of contaminants;
b) Corrosion byproducts and leaching of chemicals; c) Regrowth of microorganisms and formation of
biofilm;
d) Formation of disinfection byproducts (e.g., THMs) and disinfectant loss;
e) Permeation of organic compounds from the soil, and,
f) Microbial and/or chemical breakthrough due to deficiency in water treatment.
Intrusion of contaminants into a water distribu-tion network can occur through pipes and storage tanks. Open finished water reservoirs are susceptible to microbial contamination from external non-point
sources such as feces of infected animals (e.g., bea-ver, squirrels and rabbits, within the watershed). In-trusion of contaminants into water mains may occur during maintenance and repair events, through bro-ken pipes and gaskets, and through cross connec-tions. Cross connections (a physical connection be-tween a potable and a non-potable water system), without adequate protection can potentially intro-duce substances that compromise the quality of po-table water. Backflow from cross connections may occur when the pressure inside the water main is less than the pressure at the entry point. This can happen when a water main breaks and is de-pressurized for breakage repair, or when peak or fire demands oc-cur, or when a non-potable pressurized system is connected to the potable water network without backflow protection (Kirmeyer et al. 2001). Con-tamination events can also occur as a result of tran-sient pressures in the distribution network, where negative or low pressures cause backflow into dis-tribution mains from surrounding contaminated soils.
The corrosion of metallic pipes and plumbing de-vices increases the concentration of metal com-pounds in the water. Different metals go through dif-ferent corrosion processes, but in general low pH water, high dissolved oxygen, high temperature, and high levels of dissolved solids increase corrosion rates. Heavy metals such as lead and cadmium may
also leach into the water from the pipe materials. Secondary metals such as copper (from home plumbing), iron (distribution pipes) and zinc (galva-nized pipes) may leach into water and cause taste, odour and colour problems in addition to minor health related risks (Kleiner 1998). Contamination of water by compounds leached from pipe liners (plastic and epoxy lining) has also been observed.
Biofilm is defined as a deposit consisting of mi-croorganisms, microbial products and detritus at the surface of pipes or tanks. Biological regrowth occurs when injured bacteria pass from the treatment plant into the distribution network and subsequently reju-venate and grow in storage tanks, and water mains. The regrowth of organisms in the distribution net-work increases chlorine demand, thus reducing the level of free chlorine, which may hinder the net-work’s ability to contend with local occurrences of contamination (US EPA 1999).
Disinfection is the primary method to inactivate pathogens. Chlorine has been highly successful in reducing the incidences of waterborne infections in human beings but other concerns have been raised in the last three decades about the safety of the disin-fected water. Harmful disinfection by-products (DBPs) like THMs are formed in the presence of natural organic matter and bromide (from the source) during chlorination (US EPA 1999).
Permeation is a phenomenon in which contami-nants migrate through the pipe wall. Three stages are involved in physico-chemical process of permeation: (a) organic chemicals present in the soil partition be-tween the soil and plastic wall, (b) the chemicals de-fuse through the pipe wall, and (c) the chemicals partition between the pipe wall and the water inside the pipe (Kleiner 1998). In general, the risk of con-tamination through permeation is relatively small compared to other mechanisms.
Water quality failures attributed to above-listed deterioration mechanisms, with the exception of wa-ter treatment deficiency, are closely related to aging water mains in the distribution network. The mani-festation of deteriorating (aging) water distribution networks include the increased frequency of leaks and breaks, taste and odour and red water com-plaints, reduced hydraulic capacity, increased disin-fectant demands (due to the presence of corrosion byproducts, biofilms and regrowth). The US EPA (2007) published a series of white papers on these issues, which are available at http://www.epa.gov/ safewater/tcr/tcr.html.
This paper is organized into 4 sections. Section 2 explains the basic concepts of the proposed complex modelling approach. Section 3 describes the applica-tion of these concepts to the water quality domain. Finally, summary and conclusions are provided in Section 4.
2 MODELLING COMPLEX SYSTEMS
Water distribution networks have typically a limited number of water quality failures each year, making statistically significant generalizations difficult. The rarity of water quality failures belies their serious-ness, as each failure indicates the potential for harm-ful public health effects and increased public mis-trust and complaints. In such data-sparse circumstances, expert knowledge and belief can serve as a supplementary and even an alternative source of information.
The modelling of complex dynamic systems requires methods that combine human knowledge and ex-perience as well as expert judgment. ‘Soft comput-ing’ techniques which includes fuzzy logic, prob-abilistic & evidential reasoning, and fuzzy measure theory provide an appropriate platform framework to model complex systems with the help of human knowledge and /or available data.
2.1 Fuzzy cognitive maps
Fuzzy cognitive maps (FCMs), an extension of cog-nitive maps, are illustrative causative representations of complex systems (Kosko 1997). FCMs draw a causal representation among all identified factors or concepts of any specific system. A complex system represented by FCM can incorporate human experi-ence, judgment, understanding and knowledge of the system.
FCM consists of nodes, representing factors or concepts that are elements of the system, and weighted arcs (connections and edges), representing causal relationships between nodes. Arcs are graphi-cally illustrated as signed weighted graphs with op-tional feedback loops. Concepts (nodes) can be in-puts, outin-puts, variables, states, events, actions, goals, and trends of the system. The FCM is a process model, which can use knowledge of expert opinion and belief (qualitative, soft) and/or existing (quanti-tative, hard) data. Conventional FCMs have three major limitations:
a) Fixed value of causal relationship between two concepts (factors).
b) Lack of a temporal dimension.
c) Inability to handle a process in which the co-occurrence of multiple causes is required to trig-ger a single ‘effect concept’.
Limitations (a) and (c) are addressed in the pro-posed model, where fuzzy rule-bases and the fuzzy measures are used as arcs to denote/ represent causal relationships among nodes. Brief introduction of these two inference methods is provided below. 2.2 Fuzzy rule-based models
Fuzzy rule-based models (FRBM), can be used to make inference in FCMs either through the use of
aggregation (weighting) of single-input-single-output (SISO) or through multiple-inputs-single-output (MISO) fuzzy models. MISO models can capture co-occurrence of multiple causes, but can also become extremely complex because of dimen-sionality issues. However, the curse of dimensional-ity can be managed by introducing intermediate nodes. A fuzzy rule-based model, as described by Zadeh (1973), contains these features:
a) Linguistic variables instead of, or in addition to numerical variables;
b) Relationships between the variables in terms of IF-THEN rules (fuzzy rule-base);
c) An inference mechanism that uses approximate reasoning algorithms to formulate relationships; and,
d) A defuzzification method to obtain crisp output. 2.3 Fuzzy measures theory
Complex interactions between factors (i.e., sub- and super-additive) are best introduced by assigning a non-additive set function that permits to assign weights to a subset of factors rather than to an indi-vidual factor. It is widely accepted that additivity is not suitable as a required property of set functions in many real situations, due to the lack of additivity in many facets of human reasoning (Ross 2004). Sugeno (1974) proposed to replace the additivity property by a weaker one - monotonicity - and called these non-additive (monotonic) measures ‘fuzzy measures’. It is important to note that fuzzy meas-ures are not related to fuzzy sets, which typically are used to express vagueness and human subjectivity.
One possible meaning of a fuzzy measure can be defined as the level of importance or the degree of belief of a single attribute towards the overall evaluation of the system. In this research, a fuzzy measure was used to show the absolute contribution of a single water quality deterioration mechanism
towards a given type of water quality failure.
3 PROPOSED APPROACH FOR PREDICTING WATER QUALITY FAILURES
Two-level FCMs were developed in the proposed model. At the lower or modular level, the water quality deterioration mechanisms are estimated us-ing fuzzy rule-based modellus-ing inference mecha-nisms (Section 2.2). At the higher (or supervisory) level, the water quality failures are estimated using fuzzy measures theory (Section 2.3).
Potential for contaminant intrusion
Po te n tia l fo r w a te r qu a li ty de ter ior at io n m echa n is m s
Potential for Internal corrosion
Potential for leaching
Potential for Biofilm formation
Potential for disinfectant loss and THMs formation
Potential for permeation
Modular FCMs (Level I)
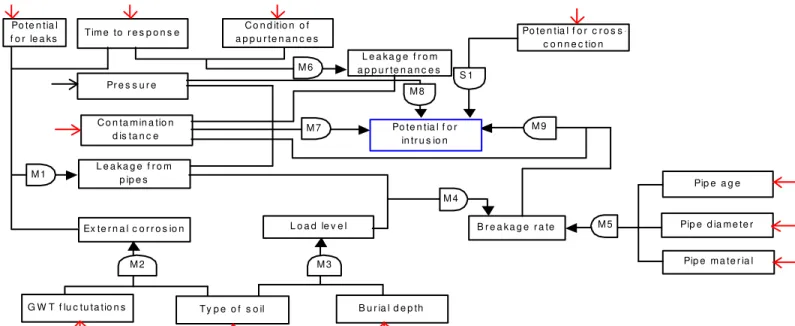
Figure 1. Schematic representation of the proposed model
We have identified many factors/ concepts, which can influence water quality in aging water mains. Out of these factors, approximately fifty factors are selected to the model the water quality in distribu-tion networks. Addidistribu-tional factors may be included in the proposed model, but it does not warrant more re-liable outcome. In our selection of concepts we at-tempt to adhere to the principle of Occam’s razor, “one should not increase, beyond what is necessary, the number of entities required to explain anything”.
Physico-chemical water quality failure
Microbiological water quality failure
Aesthetic water quality failure
⊕
Supervisory FCM (Level II)
Risk of water quality failures
⊕ ⊕
⊕ Potential for contaminant intrusion
Po te n tia l fo r w a te r qu a li ty de ter ior at io n m echa n is m s
Potential for Internal corrosion
Potential for leaching
Potential for Biofilm formation
Potential for disinfectant loss and THMs formation
Potential for permeation
Modular FCMs (Level I)
Physico-chemical water quality failure
Microbiological water quality failure
Aesthetic water quality failure
⊕
Supervisory FCM (Level II)
Risk of water quality failures ⊕ ⊕ ⊕ G W T f lu c tu ta tio n s C o n d itio n o f a p p u r te n a n c e s Po te n tia l f o r c r o s s -c o n n e c tio n Pr e s s u r e C o n ta m in a tio n d is ta n c e L e a ka g e f r o m p ip e s M 7 S 1 T y p e o f s o il B u r ia l d e p th L o a d le v e l B r e a k a g e r a te Pip e a g e Pip e d ia m e te r Pip e m a te r ia l M 5 Ex te r n a l c o r r o s io n M 9 M 2 Po te n tia l f o r in tr u s io n M 3 T im e to r e s p o n s e Po te n tia l f o r le a ks M 1 L e a k a g e f r o m a p p u r te n a n c e s M 6 M 8 M 4 M 1
Figure 1 above describes the complexity of the proposed FCM. The model was developed using nested FCMs at two levels, as described earlier. At Level I, six modules containing MISO type fuzzy rule-based FCMs were developed to predict poten-tial for various water quality deterioration mecha-nisms/ pathways including: (a) potential for intru-sion (PI), (b) potential for internal corrointru-sion (PC), (c) potential for leaching (PL), (d) potential for biofilm formation (PB), (e) potential for disinfection loss (PD) and potential for THMs formation (PT), and (f) potential for permeation (PP). Each modular FCM comprises a multitude of basic concepts (fac-tors). Figure 2 illustrates an example of the modular FCM for potential for intrusion (PI). The and-gates in Figure 2 represent fuzzy rule-bases to perform causal reasoning as described earlier in Section 2.2.
The inference from each of the six modular FCMs provides an activation signal to Level II (su-pervisory) FCM, which is used to predict water quality failures. Three different types of water qual-ity failures are identified, including aesthetic (A-WQF), physico-chemical (P-WQF) and microbi-ological (M-WQF). The overall water quality failure risk is estimated based on these three types of water quality failure.
Many basic concepts are common to more than one of the modular FCMs, e.g., ‘pipe age’, ‘pipe di-ameter’ etc., which leads to a strong interconnectiv-ity among the concepts. Fuzzy measures were used to infer this interconnectivity and subsequently to account for their non-additivity.
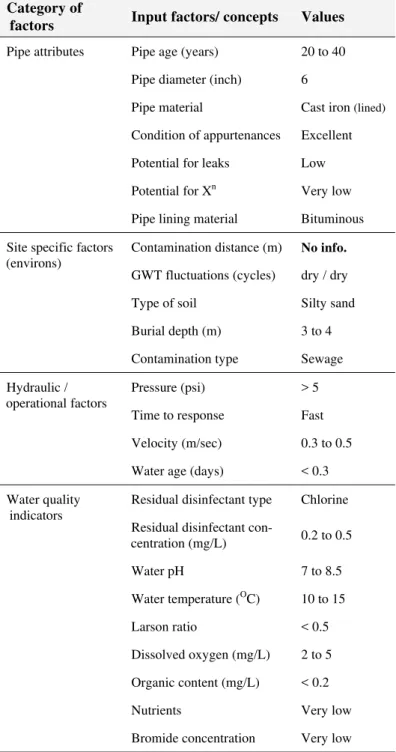
Consider a pipe segment (any pipe length in which input conditions are assumed homogenous) in a water distribution network, for which the potential for water quality failure needs to be determined. Data for the input concepts for this hypothetical pipe length are provided in Table 1. Note that although hypothetical, these data reflect realistic conditions. This data set represents instantaneous or average es-timates for the input concepts. Actual magnitudes (e.g., pressure, velocity, or other water quality indi-cators) may vary over time. Any representative value of these input concepts can be analyzed.
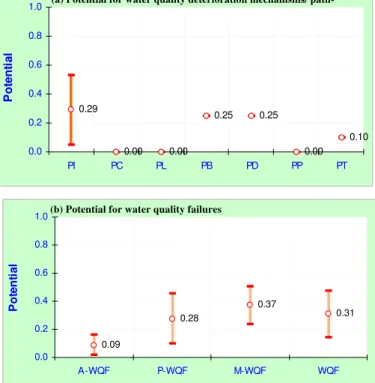
Results of an example using the proposed model are provided in Figure 3, where potentials for the re-alization of various water quality deterioration mechanisms as well as water quality failures are shown. Three values - minimum, maximum and most likely - are provided for each prediction, using an error bars. The interval [min, max] size is di-rectly proportional to the amount of missing data. For example, the potential for intrusion (PI in Figure 2) has a wide range because the contributing factor “contamination distance” is defined as “No info.” (i.e., missing data) in Table 1.
Table 1. The input values of factors used in the proposed model
Category of
factors Input factors/ concepts Values
Pipe age (years) 20 to 40 Pipe diameter (inch) 6
Pipe material Cast iron (lined)
Condition of appurtenances Excellent Potential for leaks Low Potential for Xn Very low Pipe attributes
Pipe lining material Bituminous Contamination distance (m) No info. GWT fluctuations (cycles) dry / dry Type of soil Silty sand Burial depth (m) 3 to 4 Site specific factors
(environs)
Contamination type Sewage Pressure (psi) > 5 Time to response Fast Velocity (m/sec) 0.3 to 0.5 Hydraulic /
operational factors
Water age (days) < 0.3 Residual disinfectant type Chlorine Residual disinfectant
con-centration (mg/L) 0.2 to 0.5 Water pH 7 to 8.5 Water temperature (OC) 10 to 15 Larson ratio < 0.5 Dissolved oxygen (mg/L) 2 to 5 Organic content (mg/L) < 0.2
Nutrients Very low
Water quality indicators
Bromide concentration Very low
The application of the proposed approach has so far been described for a given location and for a sin-gle pipe segment in a water distribution network. However, the proposed approach can be extended to full-scale water distribution networks. On a network level application, risk-contours of water quality fail-ures could be established using GIS. These risk-contours may help utilities identify sensitive loca-tions in the water distribution network and prioritize their rehabilitation and control strategies (Sadiq et al. 2006). To develop such a risk map (Figure 4), the above analysis is repeated for different pipe seg-ments.
Figure 3. Results of proposed model predicting potential for water quality deterioration mechanisms/ pathways and water quality failures
Figure 4. Prioritizing rehabilitation strategies for a distribution network based on water quality failures
4 SUMMARY AND CONCLUSIONS
Numerous factors affect water quality in the distri-bution networks and the interactions amongst them are complex and often not well understood. Water quality failures in distribution networks are scarce, which make statistically significant generalizations difficult. A predictive model using 2-level, nested fuzzy cognitive maps (FCMs) is proposed to com-prehend these ill-defined and complex relationships that govern water quality in the distribution network. At the modular (lower) level, six rule-based FCMs are proposed for various deterioration mechanisms, which contribute to the realization of water quality failure. At the supervisory level, a FCM is proposed
which employs fuzzy measures to interpret activa-tion signals received from the modular FCMs to predict water quality failure risk in distribution net-works. 0.09 0.28 0.37 0.31 0.0 0.2 0.4 0.6 0.8 1.0 A-WQF P-WQF M-WQF WQF Po te n tia l
(b) Potential for water quality failures
0.29 0.00 0.00 0.25 0.25 0.00 0.10 0.0 0.2 0.4 0.6 0.8 1.0 PI PC PL PB PD PP PT Po te n tia l
(a) Potential for water quality deterioration mechanisms/
path-The proposed method will help quantify the risk of water quality failures in a given pipe. The method can be extended to an entire network by way of cre-ating iso- risk-contours. The risk-contours may help utilities identify sensitive locations in the water dis-tribution networks using GIS and prioritize decision strategies.
5 ACKNOWLEDGMENTS
This paper presents results of an on-going research project, which is co-sponsored by the American Wa-ter Works Association Research Foundation (Aw-waRF) and National Research Council of Canada (NRCC).
PREFERENCES
Kirmeyer, G.J., Friedman, M., Martel, K., and Howie, D. 2001.
Pathogen intrusion into distribution system, AwwaRF,
Denver, CO, US
Kleiner, Y. 1998. Risk factors in water distribution systems,
British Columbia Water and Waste Association 26th An-nual Conference, Whistler, B.C., Canada
edium M
Kosko, B. 1997. Fuzzy engineering, Upper Saddle River, NJ, Prentice Hall
Maier, S.H. 1999. Modelling water quality for water
distribu-tion systems, Ph.D. thesis, Brunel University, Uxbridge,
UK
Ross, T. 2004. Fuzzy logic with engineering applications, 2nd Edition, John Wiley & Sons, New York
Sadiq, R., Kleiner, Y. and Rajani, B.B. 2006. Estimating risk of contaminant intrusion in distribution networks using Dempster-Shafer theory of evidence, Civil Engineering and
Environmental Systems, 23(3): 129-141.
Sadiq, R., Kleiner, Y., and Rajani, B.B. 2004. Aggregative risk analysis for water quality failure in distribution networks,
AQUA - Journal of Water Supply: Research & Technology,
53(4): 241-261
Sugeno, M. 1974. Theory of fuzzy integrals and its
applica-tions, Ph.D. Thesis, Tokyo Institute of Technology, Tokyo
US EPA 2007. US EPA white papers, http://www.epa.gov/ safewater/tcr/tcr.html, United States Environmental Protec-tion Agency
US EPA 1999. Microbial and disinfection by-product rules – simultaneous compliance guidance manual, United States Environmental Protection Agency, EPA 815-R-99-015 Zadeh, L.A. 1973. Outline of a new approach to the analysis of
complex systems and decision processes, IEEE
Transac-tions on Systems, Man, and Cybernetics, 3: 28-44
V. high Low Low Low Low V. low Medium High Medium Medium Low Medium Medium Low Medium Low Medium Medium V. low V. low V. low V. low V. low V. low V. low V. low V. low V. low V. low V. low Low V. low V. low V. low V. high V. high