Publisher’s version / Version de l'éditeur:
Journal of the Acoustical Society of America, 125, 2, pp. 1-12, 2009-02-01
READ THESE TERMS AND CONDITIONS CAREFULLY BEFORE USING THIS WEBSITE. https://nrc-publications.canada.ca/eng/copyright
Vous avez des questions? Nous pouvons vous aider. Pour communiquer directement avec un auteur, consultez la
première page de la revue dans laquelle son article a été publié afin de trouver ses coordonnées. Si vous n’arrivez pas à les repérer, communiquez avec nous à PublicationsArchive-ArchivesPublications@nrc-cnrc.gc.ca.
Questions? Contact the NRC Publications Archive team at
PublicationsArchive-ArchivesPublications@nrc-cnrc.gc.ca. If you wish to email the authors directly, please see the first page of the publication for their contact information.
NRC Publications Archive
Archives des publications du CNRC
This publication could be one of several versions: author’s original, accepted manuscript or the publisher’s version. / La version de cette publication peut être l’une des suivantes : la version prépublication de l’auteur, la version acceptée du manuscrit ou la version de l’éditeur.
For the publisher’s version, please access the DOI link below./ Pour consulter la version de l’éditeur, utilisez le lien DOI ci-dessous.
https://doi.org/10.1121/1.3058900
Access and use of this website and the material on it are subject to the Terms and Conditions set forth at
Effects of room acoustics on the intelligibility of speech in classrooms
Yang, W.; Bradley, J. S.
https://publications-cnrc.canada.ca/fra/droits
L’accès à ce site Web et l’utilisation de son contenu sont assujettis aux conditions présentées dans le site LISEZ CES CONDITIONS ATTENTIVEMENT AVANT D’UTILISER CE SITE WEB.
NRC Publications Record / Notice d'Archives des publications de CNRC: https://nrc-publications.canada.ca/eng/view/object/?id=223617b1-bcd3-4df3-aa20-e044b4c43f9c https://publications-cnrc.canada.ca/fra/voir/objet/?id=223617b1-bcd3-4df3-aa20-e044b4c43f9c
http://irc.nrc-cnrc.gc.ca
Effe c t s of room a c oust ic s on t he int e lligibilit y
of spe e ch in cla ssroom s
N R C C - 5 0 8 3 1
Y a n g , W . ; B r a d l e y , J . S .
F e b r u a r y 2 0 0 9
A version of this document is published in / Une version de ce document se trouve dans:
Journal of the Acoustical Society of America, 125, (2), pp. 1-12, DOI:
10.1121/1.3058900
The material in this document is covered by the provisions of the Copyright Act, by Canadian laws, policies, regulations and international agreements. Such provisions serve to identify the information source and, in specific instances, to prohibit reproduction of materials without
written permission. For more information visit http://laws.justice.gc.ca/en/showtdm/cs/C-42
Les renseignements dans ce document sont protégés par la Loi sur le droit d'auteur, par les lois, les politiques et les règlements du Canada et des accords internationaux. Ces dispositions permettent d'identifier la source de l'information et, dans certains cas, d'interdire la copie de
Effects of Room Acoustics on the Intelligibility of
Speech in Classrooms for Young Children
W. Yang and J.S. Bradley
National Research Council, Montreal Rd., Ottawa, Canada, K1A 0R6
Email: John.Bradley@nrc-cnrc.gc.ca
Shortened title: “Speech intelligibility in classrooms”
PACS numbers: 43.55.Hy
Date uploaded (re-submission): 8 December 2008
ABSTRACT
This paper reports new measurements of the intelligibility of speech in conditions
representative of elementary school classrooms. The speech test material was binaurally
recorded in simulated classroom conditions and played back to subjects over headphones.
Subjects included grade 1, 3, and 6 students (6, 8 and 11 year olds) as well as adults.
Recognizing that reverberation time is not a complete descriptor of room acoustics
conditions, simulated conditions included realistic early-to-late arriving sound ratios as
well as varied reverberation time. For conditions of constant signal-to-noise ratio,
intelligibility scores increased with decreasing reverberation time. However, for
conditions including realistic increases in speech level with varied reverberation time for
constant noise level, intelligibility scores were near maximum for a range of
reverberation times. Young children’s intelligibility scores benefited from added early
reflections of speech sounds similar to adult listeners. The effect of varied reverberation
time on the intelligibility of speech for young children was much less than the effect of
varied signal-to-noise ratio. The results can be used to help to determine ideal conditions
I. INTRODUCTION
Most classroom learning involves oral communication and the intelligibility of spoken
words is obviously very important for a successful learning environment. The
intelligibility of speech in classrooms is influenced most by the speech-to-noise ratio
(S/N) at the listener’s position but also by reflected sounds and the age of the listener. All
three factors must be considered when determining optimum conditions for speech
communication in classrooms.
The effects of S/N and the age of the listener were recently investigated in classrooms of
grade 1, 3 and 6 students (6, 8 and 11 year olds) [1,2]. In this previous work, speech
intelligibility tests were performed by children listening naturally (binaurally) in their
own classrooms with the natural ambient noises. The results gave a clear indication of the
effects of both S/N and listener age on the resulting speech intelligibility scores and can
contribute to determining optimum acoustical conditions for younger children.
Although the study tried to also examine the effects of varied room reverberation times,
this was not successful because the 41 classrooms tested had similar and quite acceptable
reverberation times. As a result, the current work was planned to consider the effect of
varied room acoustics on the intelligibility of speech for children in school classrooms.
A number of previous studies have considered issues related to the effect of room
reverberation on the intelligibility of speech in classrooms. However, the results of the
various studies have some serious limitations.
Nábĕlek and Pickett [3] used a modified rhyme test with the speech and noise played back from two separate loudspeakers to investigate the effects of reverberation in
conditions of 0.3 s and 0.6 s reverberation time. Although increasing the reverberation
time also increased the sound levels by about 2 dB (page 630 of [3]), this effect was
removed by adjusting the amplifier gains to create conditions with constant S/N. For the
constant S/N conditions, the intelligibility scores increased for decreased reverberation
time. However, if the natural increase in speech levels of 2 dB had been maintained for
the 0.6 s reverberation time case, different results would have occurred with a reduced
effect of varied reverberation time. The subjects were located approximately one critical
distance from the loudspeakers and hence would have experienced approximately equal
amounts of direct and reflected sound for an omni-directional source. Because the
loudspeakers used would be more directional than a human talker, subjects may have
actually experienced predominantly direct sound. The study can be criticized as providing
conditions that would not accurately reflect the effects of reverberation on natural speech
in many classrooms. They did not consider cases where the possible benefits of reflected
sounds were present and they did not include younger listeners.
Nábĕlek and Pickett also demonstrated the binaural advantage of listening with two ears compared to monaural listening. Their results clearly demonstrate that the results of
monaural listening tests (e.g. Finitzo-Hieber and Tillman [4], Johnson [5]) are not
representative of normal listening conditions in rooms.
Neuman and Hochberg [6] assessed the effects of reverberation on the intelligibility of
speech for children aged 5, 7, 9, 11 and 13 years old as well as adults. They used a speech
test consisting of nonsense syllables and reverberation times of 0, 0.4 and 0.6 s. All
speech samples were presented at the same level and in ‘quiet’ conditions. They obtained
reverberation time. They also demonstrated the advantage of binaural listening for the
0.6 s reverberation time case. This was similar to a constant S/N experiment except that
the noise level was very low. It is not possible to estimate the combined effect of
reverberation time and S/N from these results.
Although studies in actual classrooms would be expected to more realistically determine
the combined effects of S/N and reverberation time, in previous efforts it was not
possible to find test classrooms with a wide range of reverberation times, S/N, and ages
of listeners. An earlier study by Bradley [7] determined the combined effects of
A-weighted speech - noise level differences (S/N(A)) and reverberation times (T60) for 12 to13 year olds in their classrooms using regression analyses of combinations of
predictors. Although S/N(A) values were the major determinant of intelligibility scores,
reverberation time had a significant effect such that decreased reverberation time related
to increased intelligibility scores. In a more recent classroom study [2], there were effects
that indicated small increases in intelligibility scores with decreased reverberation times
but not for the youngest subjects, i.e. the grade 1 students. Both results indicated that for
a given S/N, increased reverberation time led to decreased speech intelligibility scores.
Most previous studies of the effect of reverberation on speech intelligibility have been for
constant S/N or ‘quiet’ conditions with a presumably high S/N. None have specifically
considered the possible benefits of added early-arriving reflected sounds that could
increase effective S/N values. It has been shown for adult listeners, that added early
reflections arriving within about 50 ms after the direct sound have the same effect as
increasing the level of the direct sound and hence the added early-arriving reflections can
that increased reflected sound would increase both speech and noise levels and would
result in no change to S/N values. Hodgson and Nosal [9] have explained that what is
critical is the relative distances of the speech and noise sources from the listener. Their
calculations, based on simple diffuse field theory, showed that when the noise source is
closer to the listener than the talker, then added early reflections would usefully increase
S/N values and hence would be expected to improve speech intelligibility. Yang and
Hodgson [10] carried out speech intelligibility tests by auralizing virtual sound fields to
support the earlier work [9]. Although they were largely successful, they did not give the
actual signal-to-noise ratios of their conditions and they made no attempt to confirm that
their conditions would represent the balance between early- and late-arriving sounds that
would commonly occur in real rooms.
As the predominant source of interfering sound in classrooms is usually the children, it
seems that the most common situation in elementary school classrooms is the case where
the noise source is closer than the talker to the listener. For this case we would expect
increased levels of early-arriving reflections to increase intelligibility scores because they
would be relatively more important for the more distant speech source. Of course there
are also many particular situations where early-arriving reflections are critical to
understanding speech, such as when the talker is not facing the listener, or is at a more
distant position in the classroom from the talker where the level of early-arriving speech
energy can be as much as 7 dB or more greater than the direct sound [8]. These issues are
rarely considered in more general discussions of classroom acoustics requirements, but
This new research was planned to address several questions related to better
understanding the effects of room acoustics on the intelligibility of speech for children in
classrooms. It was thought important to understand the combined effects of reverberation
time and S/N, which might occur in school classrooms, on the intelligibility of speech. In
the new tests children should be listening naturally with two ears so that they could
benefit from any binaural advantage that the realistic sound fields provided.
The new tests described in this paper were carried out using binaural playback of speech
test material recorded in simulated conditions representative of real classrooms. Although
tests in actual classrooms with varied T60 might be better, it was not possible to find the necessary combinations of room acoustic conditions and children’s ages. Considerable
effort was made to ensure that the simulated conditions were realistic representations of
conditions in typical classrooms. Two types of combinations of T60 and S/N were created. In one series of conditions, reverberation time was varied and S/N was held constant. In a
second series of tests, S/N values increased with the energy of the added reflected sound
as longer T60 values were created. In a third experiment, some further conditions were created to determine how listeners benefited from added early reflections of the speech
sounds. Tests were carried out on grade 1, 3 and 6 students (6, 8 and 11 year olds) as well
II. EXPERIMENTALPROCEDURE
The experimental procedure was to carry out speech intelligibility tests on elementary
school students using speech test material binaurally recorded in simulated conditions
representative of those in real classrooms.
A. Requirements for Simulated Classroom Acoustics Conditions
The intelligibility of speech is related to the level of the speech relative to the level of
concurrent interfering noises. However, not all speech sound increases the intelligibility
of the speech. Increased levels of the direct speech and early reflections of the speech
arriving within about 50 ms after the direct sound lead to increased intelligibility, but
later-arriving reflections reduce the intelligibility of the speech [8]. In simulating room
acoustics conditions it is not good enough to simply vary reverberation times. It is
possible to create unrealistic conditions with too much or too little early reflection energy
that will lead to results that are not representative of conditions in actual classrooms.
The relative level of early reflection energy can be measured by C50 values, where C50 is an early-to-late-arriving sound energy ratio with a 50 ms early time interval [11]. When
simulating conditions with varied reverberation time (T60), it is important that C50 values are also appropriate for the corresponding T60. Figure 1 illustrates combinations of C50 and T60 obtained from measurements in both classrooms [2] and auditoria.
It was desired to create test conditions with T60 values of 0.3, 0.6, 0.9, and 1.2 s, which were thought to correspond to the full range of likely conditions in typical elementary
school classrooms. A T60 of 0.6 s is often thought to be near optimum [7] and is referred to in the ANSI S12.60 classroom acoustics standard [12]. A T60 of 0.3 s is representative of the lowest T60 values likely to be found in a normal classroom. T60 values of 0.9 and
1.2 s could occur in real classrooms but were expected to lead to increasingly less
suitable conditions with lower speech intelligibility scores. Figure 1 also shows the
combinations of measured C50 and T60 for the 4 simulated conditions. They are seen to be close to the mean trend of the results from the real rooms and hence corresponded to
realistic ratios of early and late-arriving reflections.
One set of test conditions included these four T60 values and with a constant S/N. These would represent conditions in which the added reflected sounds equally influenced
speech and noise levels. A second set of conditions was created in which speech levels
increased as more reflected sound was added, while noise levels were held constant,
leading to varied S/N. It was important to ensure that the increased speech levels with
increasing T60 values realistically represented what would occur in real rooms.
The desired increase in speech levels with increasing T60 was determined from Beranek’s compilation of measurement data. Figure 9.4 of reference [13] plotted values of
(EDT/V)x106 versus G(mid) levels. (EDT is the early decay time, s, V is the room volume, m3, G(mid) is the relative level or strength of the sound in the rooms and both EDT and G(mid) are for combined 500 and 1000 Hz octave band results). (See [11] for
definitions of EDT and G). Beranek’s plot relates the average variation in decay times to
the average variation in levels for a large number of auditoria. These data were combined
with data from several classroom-sized rooms and a new regression line fitted to the
combined data, which was only very slightly different than Beranek’s original line for
large auditoria. The new line was used to predict the desired increases in level with varied
Beranek did not give the equation of his best-fit line but it was determined from his text
and a manual fit of points from the line which indicates it is,
16 } 10 ) / log{( 10 EDT V 6 =Gmid + (1)
Because we would like to predict Gmid values it is necessary to reverse x and y values as follows, 16 } 10 ) / log{( 10 6 − = EDT V Gmid (2)
Fitting this form of equation to Beranek’s large hall data combined with data for
classroom sized rooms resulted in the following relationship,
6 . 17 } 10 ) / log{( 75 . 10 6 − = EDT V Gmid (3)
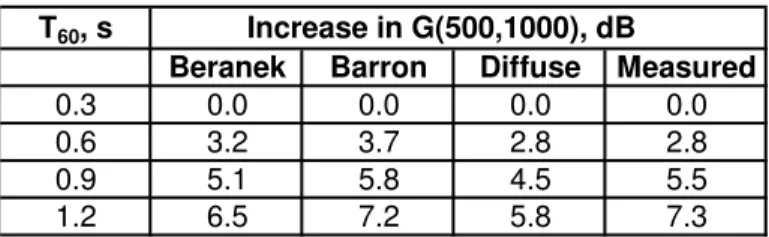
Equation (3) was used to estimate increases in sound levels with increasing decay time
for a 198 m3 room volume which was the average room volume of the 41 elementary school classrooms recently studied [1]. The expected increases in level associated with
the increased decay times using equation (3) are listed in Table 1 and plotted in Figure 2.
For comparison, the expected changes of level with decay time were also calculated using
Barron’s revised theory and diffuse field theory [14, 15] using a source-receiver distance
of 5 m as representative of an average seat in a classroom. These calculated level changes
were based on the measured T60 values of the simulated sound fields and the results are also included in Table 1 and Figure 2. The 3 approaches led to similar predicted increases
in levels. Although the three sets of calculated level increases are all based on measured
decay times, Beranek’s relationship was based on EDT values while the others were
similarly related to EDT and T60 values. Measurements of the simulated sound fields demonstrated that the increases in speech levels varied in a similar manner as shown in
Table 1 and Figure 2.
B. Subjects and Speech Test Procedures
The Word Intelligibility by Picture Identification (WIPI) speech test was used because it
is a very simple test that 6 year olds and older students can quickly learn and respond to
individually without significant training. It includes 4 lists of 25 phonetically balanced
simple nouns [16, 17]. The test words were each presented in the carrier phrase, “Please
mark the _____ now” spoken by a clear speaking female voice. These tests used exactly
the same speech test recordings as in the previous classroom studies [1].
In the previous classroom study [1,2] students carried out the tests as groups while seated
in their regular seat in their own classrooms and marked responses in a book of pictures
illustrating the possible responses. In the current investigations, individual students were
tested one at a time using headphone presentation of the speech material. The subject and
experimenter were located in a quiet room without acoustical distractions and with no
other people present. The processed speech test material was stored as wav files on a
portable computer. These were presented to each listener using specially developed
software that played the speech files and displayed the pictures corresponding to the
possible 6 responses on a touch screen. The listener touched one of the 6 pictures to
indicate the correct response. The program put an X through the touched picture to
confirm which had been selected. The students found the test easy to perform and
All subjects first carried out a short practice test to be sure that they were familiar with
the process of the test. If they had no problems they would then carry out the actual tests.
The grade 1 students each carried out tests of 3 different conditions. The grade 3 and 6
students as well as the adults each carried out tests for 4 different conditions. The use of
each of the 4 word lists was rotated so that all 4 word lists were used an approximately
equal number of times to asses the 9 different acoustical conditions by each age group of
subjects.
The students were from several schools in the Ottawa Carleton District School Board
(OCDSB). Permission to invite schools and students to participate in our tests was
obtained from the OCDSB Research Advisory Committee. Ethics approval was obtained
from both the University of Ottawa Research Ethics Board (protocol H 03-07-06) and the
National Research Council Research Ethics Board (protocol 2007-10). All students
volunteered to participate with the written consent of their parents. Adult participants
volunteered and each signed consent forms. A total of 77 grade one students, 75 grade
C. Sound Field Simulation and Headphone Playback Procedure
Conditions simulating those in classrooms were created using an 8-channel
electroacoustic sound field simulation system located in an anechoic room and quite
similar to a previously described system [8]. The System consisted of 8 Tannoy model
800A loudspeakers that surrounded the listening position. Five of the loudspeakers were
in the horizontal plane of the listener’s ears and the other 3 were raised up above this
plane in front of the listener.
The signals to each loudspeaker were processed by four Yamaha DME32 digital
signal-processing units connected together to form one large unit. A direct speech sound arrived
first from the loudspeaker directly in front of the listening position. A total of 31 early
reflections were created that arrived from the 8 loudspeakers within 50 ms after the direct
sound and realistically decreased in level with increasing time. Reverberant decays
followed the discrete early reflections. Reverberation times were varied by varying the
decay times of the digital reverberator components in the DME32 units. Adjusting the
balance between the combination of direct sound and early reflections versus
late-arriving sound made it possible to adjust C50 values independent of T60 values to create the desired combinations of C50 and T60 values in each octave band from 125 to 8k Hz. This setup made it possible to systematically vary the most relevant aspects of the sound
fields and to ensure that realistic combinations were obtained.
To record speech test material for each test condition, an acoustical mannequin (Brüel
and Kjaer type 4128) was placed at the listener position. For the younger (and smaller)
listeners, a smaller head would have been desirable but such heads are not commercially
simulation system and recorded using the microphones in the acoustical mannequin. It
was subsequently played back to listeners over Sennheiser type HD280 headphones. In
recording the speech in this way, the frequency response of the speech was modified by
the frequency response of the acoustical mannequin. When playing the recordings back to
subjects, the frequency response of the speech was further modified by the characteristics
of the headphones. The frequency response of the test speech material was corrected by
measuring the combined response of the headphones and acoustical mannequin. The
transfer function of the combined headphones and acoustical mannequin was obtained by
measuring the impulse response of the headphones while placed on the acoustical
mannequin.
One of the major difficulties of using headphone playback is that re-positioning the
headphones leads to different headphone transfer-functions and in some cases these
differences can be quite large [18]. Initial tests confirmed that large variations in the
measured transfer functions are possible and to minimize these effects, the head and
headphone transfer function was determined from the average of 10 different placements
of the headphones on the acoustical mannequin. For each repeat, the headphones were
carefully positioned on the mannequin so that the headphone cushions completely
covered the pinna of the acoustical mannequin. The average transfer-function was
determined from the average measured impulse response after carefully aligning the start
of each measured impulse response.
The recorded speech test material was equalized to correct for the head-headphone
transfer function. This was done by deconvolution of the recorded speech with the
effects of the head and headphones from the recorded speech. The process was evaluated
by comparing the levels of speech initially recorded at the mannequin with the levels of
the same speech played back from headphones after processing and again recorded at the
microphones of the mannequin. The differences are plotted as 1/3-octave band levels in
Figure 3 for conditions 1 to 4 having T60 values of 0.3, 0.6, 0.9 and 1.2 s (see next section and Table 4 for description of conditions). For frequencies from 250 Hz to 6.3k Hz
inclusive the differences were 1 dB or less. However, the headphone playback always
had slightly lower levels with an average difference over the 250 to 6.3k Hz range of 0.6
dB. This was thought to be due to using an average correction. There were larger
differences at frequencies below 250 Hz and these differences increased with decreasing
reverberation time of the test condition. These effects are not important for speech
intelligibility [19] but are similar to previous observations that auralization of more
absorptive conditions can be more difficult [20].
Simulated ambient noise was separately recorded binaurally in a similar manner. Noise
with a -5 dB per octave spectrum shape was produced and radiated incoherently from all
8 loudspeakers in the sound field simulation system. This spectrum shape has been shown
to approximate typical indoor ambient noise such as that from ventilation systems and is
often referred to as a ‘neutral’ spectrum [21, 22]. The binaural noise recordings were
corrected for the response of the headphones and mannequin as described for the speech
sounds. The noise recordings were mixed with the speech recordings at levels to provide
D. Test Conditions
Speech tests were carried out for 9 different acoustical conditions making it possible to
carry out 3 different experiments. Table 2 summarises the 9 test conditions.
Conditions 1 to 4 were used in experiment #1 in which reverberation time was varied
(0.3, 0.6, 0.9 and 1.2 s) and the ambient noise level was held constant. As a result,
S/N(A) increased with increasing reverberation time representing the expected increase in
speech level due to the addition of reflected sounds with increasing T60.
Conditions 7, 2, 8 and 9 were used in experiment #2. Again reverberation time was varied
(0.3, 0.6, 0.9 and 1.2 s) but the S/N(A) was kept constant in this experiment. This
experiment would represent the condition where added reflected sound leads to equal
increases in both speech and noise levels.
Experiment #3 included conditions 5, 6 and 3. Condition 5 included direct speech sound
only. In condition 6 early reflections were added which increased the total sound level.
Finally, condition 3 had the same level of direct sound and early reflections, but with
added late-arriving sound. The ambient noise level was held constant and hence the
overall speech levels increased as reflected sounds were added. This experiment was
intended to determine whether young children benefit from added early-arriving
reflections in a manner similar to adults.
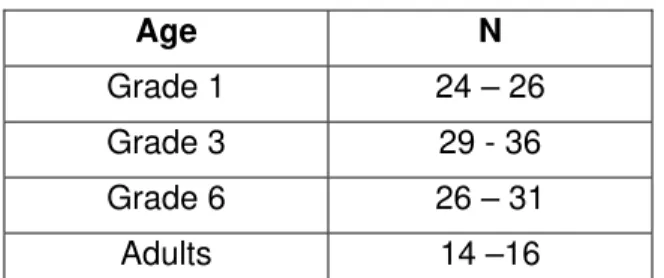
The number of subjects tested for each of the 9 conditions varied a little with the age of
the subjects and slightly among the different conditions for each age group as
E. Validation of Headphone Playback Procedure
Acoustical conditions A to D were used in initial tests to validate that the headphone
playback process led to the same intelligibility scores as direct playback of speech sounds
for the same acoustical conditions. Conditions A to D were the same as Conditions 1 to 4
except that some S/N(A) values were a little different. The comparison test used 16 adult
subjects who each carried out the tests both by direct listening in the anechoic chamber
simulation system (AC) and also by listening over headphones (HP). Figure 4 shows that
the mean scores for each condition were very similar for the two types of playback of the
speech and noise sounds.
The differences were tested using a paired-samples T-test. When all conditions were
included as a group, there was not a significant difference between the two playback
methods. When the pairs of results for each of the 4 acoustical conditions were separately
tested, in all cases there were no significant differences between the two playback
methods. That is, we can be reasonably confident that our processed recordings played
back over headphones were equally intelligible to the speech in the original sound fields.
This confirmed earlier exploratory studies to consider the viability of the headphone
playback method [23].
Marshall [16] found that the 4 word lists of the WIPI test did not yield identical scores for
evaluations of the same acoustical conditions. As all of the 4 word lists were used
approximately equally for each acoustical condition, it was possible to compare the mean
scores from each word list averaged over all acoustical conditions. This was done first for
the adult listeners so that they could be used for the results of the initial validation tests of
the WIPI test averaged over all acoustical conditions. This is followed by the
corresponding corrections for the adult data, for the children’s responses and for the
combined adult’s and children’s responses (‘both’). (Of course the corrections for
children and ‘both’ adults and children were determined later but are included here for
easy comparison). Marshall’s corrections for children aged 5 to 11 years old are included
in the final column and are seen to be reasonably similar to those for children from the
current study.
The corrections indicate how the average response for each word list differed from the
average of all word lists. The adult corrections shown in Table 4 for adult subjects were
used to correct the scores from the validation test results by dividing each score by the
appropriate correction value depending on the word list that was used. The resulting
corrected scores are shown in Figure 5.
The corrections result in a little closer agreement between the two sets of data. However,
the pairs of results were not significantly different before correcting for word list
differences and were again not significantly different after correcting for the word list
differences (paired-sample T-tests). The results do suggest that there is a small benefit to
correcting scores for word list differences and the mean squared difference between
headphone and direct acoustic playback was reduced from 2.02 to 1.57 when the scores
were adjusted to correct for word list differences.
The differences among the word lists may be due to a number of factors. Most obvious
would be the different test words that make up each list. Some lists may contain a few
more difficult words than other lists. However, there may also be differences related to
addition the age of the listener may influence the corrections because younger listeners
would be more affected by more difficult words. The corrections included in Table 4
were probably influenced by all of these factors and so we would not expect our new
III. RESULTS OF THE THREE MAIN EXPERIMENTS
The results of all three experiments described in the following sections were first
analyzed in terms of the uncorrected speech intelligibility scores and subsequently using
the corrected scores as described in the previous section using the ‘both’ correction
values from Table 4. In all cases using the corrected scores did not change the pattern of
results but led to small improvements in the significance of the results. Therefore, to
avoid unnecessary confusion, the following results of the three main experiments are
described only in terms of the corrected scores.
A. Experiment #1 (varied S/N)
In Experiment #1 subjects listened to speech for conditions 1 to 4 (described in Table 2).
These were conditions of varied T60 for constant noise level resulting in varied S/N as might occur when added room reflections of speech sounds increase the effective S/N.
An analysis of variance of the corrected speech intelligibility scores indicated significant
main effects of Age (p<0.001) and Condition (p<0.003). There was not a significant
interaction effect. A Tukey HSD posthoc test of the data indicated that the differences
between each of the 4 age groups were all significant (p<0.014 or better).
The mean corrected scores are plotted versus condition for each age group in Figure 6.
The error bars show the standard errors of each mean score. A fifth line on Figure 6 plots
the average results over all age groups versus acoustic condition. Although there are not
large variations in the scores with varied T60, the average of all ages tends to peak for condition 3 with a T60 of 0.9 s. For these cases, where added reflected sound increased both S/N and T60, there is a range of conditions that lead to approximately the same speech intelligibility scores within each age group.
B. Experiment #2 (fixed S/N)
Experiment #2 included conditions 7 2, 8 and 9 that had a constant S/N(A) of –2 dB for
cases with T60 varying from 0.3 to 1.2 s, as described in Table 2. An analysis of variance of the corrected scores for all age groups and these 4 conditions indicated highly
significant main effects of both Condition and Age (p<0.001). There was not a significant
interaction effect. A Tukey HSD posthoc test of the data indicated that the differences
between pairs of the 4 age groups were all significantly different (p<0.001 or better). The
mean values and their standard errors for the corrected scores are plotted in Figure 7.
When the S/N was held constant, as in these results, there is no beneficial effect of
increased reflected speech sound and there is a trend for speech intelligibility to decrease
with increasing reverberation time.
C. Experiment #3 (added reflections)
Conditions 5, 6 and 3 were used in Experiment #3 to examine the basic effects of first
adding early-arriving reflections to the direct sound, and second adding late-arriving
reflections. By comparing the results from condition 6 with those of condition 5 we can
determine the effects of adding early-arriving reflections to the direct speech sounds. An
analysis of variance of the corrected results from conditions 5 and 6 showed that there
were significant changes in the intelligibility scores with Condition (p<0.001) and Age
(p<0.001) but no interaction effect. The lack of a significant interaction effect indicates
that all ages of listener benefited equally when early-arriving reflections were added. A
Tukey HSD posthoc test of these data indicated that the grade 6 and adult results were not
The mean corrected scores are plotted in Figure 8. Adding early reflections increased
speech intelligibility for all age groups but the scores of the adults were not significantly
different than those of the grade 6 students.
Comparing the scores from conditions 3 and 6 makes it possible to determine the effect
of adding late-arriving speech sounds with a 0.9 s reverberation time. An analysis of
variance of the corrected data from these two cases indicated a significant effect of Age
(p<0.001) but no significant effect of Condition. A Tukey HSD posthoc test showed that
the Age differences were not significant for all age groups. The results of the grade 1 and
grade 3 students were not significantly different and the results of the grade 6 and adult
listeners were not significantly different, but other differences among Age groups were
significant. Adding late-arriving reflections did not significantly change speech
intelligibility scores even though the overall speech level increased when the reverberant
speech was added. The averages of all age groups shown in Figure 8, suggest a small
IV. DISCUSSION
A. Comparisons with Previous Results
It is of interest to compare the new results from the current study with previous results to
confirm that they are representative of children’s experience in real classrooms and that
the effects of reverberation are similar to those in previous studies.
Previous speech intelligibility tests in classrooms [1,2] related speech intelligibility
scores using the WIPI test to S/N(A) values. In the previous classroom study, the
predominant source of interfering sound was concluded to be the children, because
occupied noise levels were higher than unoccupied noise levels even when the children
were inactive and quiet [2]. Therefore we can assume that the results of experiment #1
are most representative of the conditions in the classrooms. Figure 9 compares mean
speech intelligibility scores from the current study with the speech intelligibility scores
versus S/N(A) values for grade 1, 3 and 6 students from the previous classroom study.
For each age group in the current study, the results of conditions 1 and 2, corresponding
to T60 values of 0.3 and 0.6 s, are plotted on Figure 9 at the appropriate S/N(A) values. The mean occupied classroom reverberation time was 0.41 s [2] and was intermediate to
the two conditions plotted from the current data. For the grade 6 results there is near
perfect agreement between the current results and the classroom study results. The grade
3 results from the current study indicate slightly higher mean intelligibility scores than
the classroom study and the grade 1 results indicate a little larger difference. The two
studies used exactly the same speech test material, the same age groups, and the
acoustical conditions of the new study were intended to closely model those in
classrooms there were many other forms of distraction that might have reduced the scores
of the youngest listeners. These other distractions would include visual distractions such
as those of the other children’s actions. In addition, the interfering sounds in the
classroom were not always meaningless broadband noise, but at times were recognizable
sounds from both within their classroom and from adjacent spaces. These may have had a
larger negative effect on speech intelligibility scores. Considering the differences in the
two experimental procedures, the agreement is very good and confirms that classroom
conditions were accurately simulated.
There is little previous data available that can be compared with the current results
indicating the effects of varied reverberation time for young children in conditions
representative of classrooms. Most previous studies have included major procedural
differences such as monaural presentation of the speech, different speech test material, or
quite different and often unrealistic acoustical conditions. In spite of some differences in
experimental methods, the current results of Experiment #2 were compared with the
results of Neuman and Hochberg [6] in Figure 10.
Neuman and Hochberg tested children aged 5, 7, 9, 11 and 13 years old as well as adults.
They included 3 acoustical conditions corresponding to no reverberation, and
reverberation times of 0.4 and 0.6 s. However, they did not specify the ambient noise
level during the tests and only indicated it to be ‘quiet’. In addition, their speech test
material was different than the current study and consisted of nonsense syllables.
To obtain more comparable results, their scores for 5, 7 and 9 year olds were interpolated
to get values representative of 6 and 8 year olds. Figure 10 indicates reasonable
decreasing reverberation time. The adult and 11 year old (grade 6) data for the two
studies agree very well for comparable T60 values. The results of the 8 year olds (grade 3) indicate some differences and for the data of the 6 year olds (grade 1), the current study
produced much lower speech intelligibility scores. This is probably largely due to
different signal-to-noise ratios between the two tests, which would more adversely affect
the youngest listeners[1]. In Experiment #2 the S/N(A) was -2 dB and was presumably
much lower than for the Neuman and Hochberg results in ‘quiet’ conditions. In view of
the significant differences in the procedures of the 2 studies, the agreement seems
reasonably good and generally indicates the same effects of reverberation for cases of
constant S/N.
The results of Experiment #3 cannot be directly compared with previous results because
no previous study could be found that considered whether young children benefit from
added early-arriving reflections of speech sounds. Although studies with adults have
clearly demonstrated that the added energy of early-arriving reflections within about 50
ms of the direct sound increases speech intelligibility equivalent to a similar increase of
the direct sound level [8], this has not been demonstrated for children. Some have argued
that children do not benefit from early-arriving reflections [24]. The results of
Experiment #3 confirm that children do benefit as much as adults do when early
reflections are added. The non-significant effect of adding later arriving sound is also
similar to previous results for adult listeners [8].
B. Determining Ideal Conditions for Speech Communication in Classrooms In Experiment #1, speech intelligibility scores tended to peak at some intermediate T60 value as expected for the conditions with varied S/N, but there were not large variations
in intelligibility scores over the included range of T60 values. Because the Experiment #1 results shown in Figures 6 were based on data from only 4 conditions, and a small range
of T60 values, it is difficult to accurately determine the mean trends.
To obtain a better estimate of the mean trends, the speech intelligibility scores for all of
the 9 conditions were plotted versus the corresponding Useful-to-Detrimental sound
ratios (U50) for each of the conditions. This made it possible to use 9 data points rather than 4 to determine the mean trends of the data. It is well known that U50 values can explain the combined effects of varied S/N and varied T60 on speech intelligibility scores [7, 9, 25, 26]. Useful-to-Detrimental sound ratios were calculated from measured C50 values along with measured speech and noise levels in the six octave bands from 125 to
4k Hz as described in [26]. The octave band U50 values were arithmetically added with a uniform frequency weighting. The mean scores from all 9 conditions are plotted versus
U50 values for each age group in Figure 11. Because the range of conditions is not large, the variation of speech intelligibility scores with U50 values is approximated by linear regressions lines in Figure 11. Smoothed speech intelligibility scores that represent the
average trend of the data can be determined from these linear regression lines. These
smoothed scores should provide a more accurate indication of the mean trend of the data
for each of the experiments.
The smoothed speech intelligibility scores for the Experiment #1 conditions from the
regression lines in Figure 11 are plotted versus T60 values in Figure 12. These show what is believed to be better estimates of the mean trends of the Experiment #1 results. Figure
12 shows approximately parallel curves peaking at a T60 of 0.68 s. That is, for these conditions this T60 value provides the best speech intelligibility. However, speech
intelligibility scores are not substantially lower for a wide range of reverberation times.
From Figure 12 one could conclude that of the test conditions only the 1.2 s reverberation
time condition showed a significant reduction in mean speech intelligibility score for the
smoothed results of Experiment #1. When the curves on Figure 12 are examined more
carefully, they are seen to vary in curvature and are not quite parallel. The curvature
increases with decreasing age of the listeners, possibly suggesting that younger listeners
are more sensitive to the negative effects of reverberation. However, these effects are too
small to be practically important and were not statistically substantiated.
Smoothed values for the Experiment #2 results were also obtained from Figure 11 and are
plotted versus T60 values in Figure 13. As expected this figure shows speech intelligibility scores increasing with decreasing T60. However, it can now be seen that the rate of
variation of speech intelligibility scores with T60 is greatest for the youngest listeners. That is, the negative effects of increasing reverberation time more rapidly degrade
V. CONCLUSIONS
The new results in this study provide statistically significant evidence of the effects of
reverberation time and the age of the listeners on the intelligibility of speech in
elementary school classrooms.
For the conditions of constant noise level and varied S/N in Experiment #1, speech
intelligibility scores were near maximum (within 1%) for a wide range of reverberation
times. The new results indicate that for these varied S/N conditions, acceptable
reverberation times can be described as the range from about 0.3 to 0.9 s reverberation
time. The varied S/N conditions of Experiment #1 are thought to be most representative
of conditions in elementary school classrooms where the dominant sources of interfering
sounds are the nearby children.
These results suggest that the natural increase in speech levels with the increased early
reflection energy associated with increased reverberation time compensate for the
negative effects of the concurrent increase of late-arriving speech sound with increasing
reverberation time. However, if the constant noise level used in Experiment #1 were
increased or decreased the range of acceptable reverberation times would change.
Previous studies have demonstrated that preferred reverberation times for speech increase
with increased noise levels [27].
For conditions of constant S/N (Experiment #2), speech intelligibility scores increased
with decreasing reverberation times and the effect was most rapid for the youngest
listeners. However even for high S/N conditions, having some reflected sound can be
critical to understanding speech and hence very low reverberation times should not be
distant from the talker, adequate speech intelligibility depends on reflected sound and in
such cases early-arriving reflections can increase S/N by 7 dB or more [8].
The addition of early-arriving reflections of speech sounds was confirmed to be equally
beneficial for young children and for adults.
While the younger children always had lower speech intelligibility scores, this was
mostly due to younger children being more adversely affected by interfering noise [1].
However, there were small indications that younger children were more adversely
affected by reverberation. For the varied S/N conditions (Experiment #1), the range of
acceptable reverberation times decreased very slightly with decreasing age of the listener.
For the constant S/N conditions (Experiment #2), the decrease of intelligibility scores
with increasing reverberation time was a little more rapid for younger listeners. However,
the magnitude of the negative effects of reverberation on speech intelligibility were much
smaller than previously found for varied S/N and the effects of reverberation varied much
less with the age of the listener.
An ideal approach to the acoustical design of classrooms would be to first reduce all
noise levels (at the source if possible) and then design the reverberation time of the room
to optimise the provision of added reflected sound to enhance speech levels. The current
results suggest that design criteria should not specify maximum reverberation times. They
should specify a range of acceptable values. Too little reflected sound is a potentially
expensive and serious problem.
This study has considered how the physical characteristics of the classrooms affect the
sounds made by the children. The levels of sound from the children and their behaviour
may also be affected by the acoustical treatment of the classroom. Further studies are
needed to compare conditions in treated and untreated classrooms to help understand the
interactions of the behaviour of students and teachers with the acoustical treatment of
classrooms.
Acknowledgements
This work was supported by a grant from the Canadian Language and Literacy Research
Network. The authors are grateful to the Ottawa Carleton District School Board and the
many school principals and teachers who made it possible for us to carry out this
research. The authors would like to thank Dr. Brad Gover for his help with the processing
References
1. Bradley, J.S. and Sato, H., “The intelligibility of speech in elementary school
classrooms”, J. Acoust. Soc. Am., 123 (4) 2078-2086 (2008).
2. Sato, H. and Bradley, J.S., “Evaluation of acoustical conditions for speech
communication in working elementary school classrooms”, J. Acoust. Soc. Am., 123
(4) 2064-2077 (2008).
3. Nábělek, A.K., and Pickett, J.M., “Reception of consonants in a classroom as affected by monaural and binaural listening, noise, reverberation and hearing aids”, J. Acoust.
Soc. Am., 56 (2) 628-639 (1974).
4. Finitzo-Hieber, T, and Tillman, T.W., “Room acoustics effects on monosyllabic word
discrimination ability for normal and hearing-impaired children”, J. Speech Hear.
Res., 21, 440-458 (1978).
5. Johnson, C.E., “Children's phoneme identification in reverberation and noise”, Journal
of Speech, Language and Hearing Research 43,144-157 (2000).
6. Neuman, A., and Hochberg, I., “Children's perception of speech in reverberation”, J.
Acoust. Soc. Am., 73, 2145-2149, (1983).
7. Bradley J.S., “Speech intelligibility studies in classrooms”, J. Acoust. Soc. Am., 80 (3)
846-854 (1986).
8. Bradley, J.S., Sato, H. and Picard, M., “On the Importance of Early Reflections for
9. Hodgson, M. and Nosal, E-M, “Effect of noise and occupancy on optimal
reverberation times for speech intelligibility in classrooms”, J. Acoust. Soc. Am.,
111 (2) 931-938 (2002).
10. Yang, W. and Hodgson, M., “Auralization study of optimum reverberation times for
speech intelligibility for normal and hearing-impaired listeners in classrooms with
diffuse sound fields”, J. Acoust. Soc. Am., 120 (2) 801-807 (2008).
11. ISO3382, “Acoustics - Measurement of the reverberation time of rooms with
reference to other acoustical parameters”, International Organisation for
Standardisation, Geneva, Switzerland (1998).
12. American National Standards Institute (ANSI) Standard S12.60 “Acoustical
performance criteria, design requirements, and guidelines for schools”.
13. Beranek, L.L., “Concert and opera halls, how they sound”, published by Acoust. Soc
Am., (1996).
14. Barron, M. and Lee L.J., “Energy relations in concert auditoriums I”, J. Acoust. Soc.
Am., 84 (2) 618-628 (1988).
15. Chiles, S. and Barron, M., “Sound level distribution and scatter in proportionate
spaces”, J. Acoust. Soc. Am., 226 (3) 1585-1595 (2004).
16. Marshall, N.B., “The effects of different signal-to-noise ratios on the speech
recognition scores of children”, Ph.D. Thesis, University of Alabama, Tuscaloosa
Alabama, (1987).
17. M. Ross and J. Lerman, “A picture identification test for hearing impaired children”,
18. A. Kulkarni and H. S. Colburn, “Variability in the characterization of the headphone
transfer-function”, J. Acoust. Soc. Am., 102 (2) 1071-1074 (2000).
19. ANSI S3.5-1997, “Methods for Calculation of the Speech Intelligibility Index”,
American National Standard, Standards Secretariat, Acoustical Society of America,
New York, USA.
20. Yang, W., Hodgson, M. “Validation of the Auralization Technique: Comparative
Speech-Intelligibility Tests in Real and Virtual Classrooms”, Acta Acustica united
with Acustica, 93 (6) 991-999 (2007).
21. Hoth, D.F., “Room Noise Spectra at Subscribers’ Telephone Locations”, J. Acoust.
Soc. Am., 12 (3) 449-504 (1941).
22. Blazier, W.E., “Revised Noise Criteria for Application in the Acoustical Design and
Rating of HVAC Systems”, Noise Control Engineering Journal, 16 (2), 64-73, (1981).
23. Bradley, J.S., Sato, H., Gover, B.N., and York, N., “Comparison of Speech
Intelligibility Scores for Direct Listening and Headphone Playback”, J. Acoust. Soc.
Am., 117 (4) Pt. 2, 2465 (2005).
24. F.H. Bess, “Classroom Acoustics: An Overview”, Volta Review, 101 (5) 1-14 (2001).
25. Bradley J.S., “Predictors of speech Intelligibility in Rooms”, J. Acoust. Soc. Am., 80
(3) 837-845, (1986).
26. Bradley, J.S., Reich, R.D. and Norcross, S.G., “On the Combined effects of
signal-to-noise ratio and room acoustics on speech intelligibility”, J. Acoust. Soc. Am., 106 (4)
27. Reich, R. and Bradley, J.S., “Optimizing Classroom Acoustics Using Computer
T60, s Increase in G(500,1000), dB
Beranek Barron Diffuse Measured
0.3 0.0 0.0 0.0 0.0
0.6 3.2 3.7 2.8 2.8
0.9 5.1 5.8 4.5 5.5
1.2 6.5 7.2 5.8 7.3
Table 1. Expected increases in sound levels with increasing decay time relative to the
case of a T60 value of 0.3 s as well as the level increases measured in the simulated sound fields.
Condition T60, s Speech
level, dBA
Noise
Level, dBA S/N(A)
1 0.3 62 67 -5 2 0.6 65 67 -2 3 0.9 67 67 0 4 1.2 69 67 2 5 Direct only 60 67 -7 6 Direct+early 66 67 -1 7 0.3 62 64 -2 8 0.9 67 69 -2 9 1.2 69 71 -2
Age N
Grade 1 24 – 26
Grade 3 29 - 36
Grade 6 26 – 31
Adults 14 –16
Table 3. Numbers of subjects (N) that participated in each test condition for each age group.
Word list Mean score Correction adults Correction children Correction both Correction Marshall 1 93.78 1.0509 1.0621 1.0565 1.0115 2 90.59 1.0153 1.0249 1.0201 0.9606 3 82.63 0.9259 0.9112 0.9186 0.9022 4 89.94 1.0079 1.0018 1.0048 1.1257 Average 89.233 1.0000 1.0621 1.0565 1.0115
Table 4. Mean scores for each word list and correction factors of the WIPI test for adult
listeners, followed by corrections for adults, children, both (adults and children) and
Figure Titles
Figure 1. Measured octave band values of C50 plotted versus the corresponding T60 values. Open triangles: classroom data, open squares: measured auditorium data, closed
circles: simulated sound fields, solid line: best fit regression line.
Figure 2. Variation of sound levels with decay time plotted as mid-frequency G values
versus measured mid-frequency EDT values corresponding to the conditions with T60 values of 0.3, 0.6, 0.9 and 1.2 s for 198 m3 room. Solid circles: simulated conditions, open triangles: classroom sized room data, solid line: equation (3). (color online)
Figure 3. Level differences between 1/3 octave band speech levels of the initial acoustical
mannequin recordings (AC) and recordings of the processed initial recordings played
back over headphones (HP). The differences for the left (L) and right (R) ear recording
for conditions 1 to 4 having T60 values of 0.3 to 1.2 s are shown. (color online)
Figure 4. Comparison of mean speech intelligibility scores for headphone playback (HP)
and direct playback in the anechoic chamber simulation system (AC). Error bars indicate
the standard errors of each of the mean values. (color online)
Figure 5. Comparison of corrected mean speech intelligibility scores for headphone
playback (HP) and direct playback in the anechoic room simulation system (AC). Error
bars indicate the standard errors of each of the mean values. (color online)
Figure 6. Mean corrected scores for conditions 1 to 4 having T60 values 0.3, 0.6, 0.9 and 1.2 s respectively. Each line refers to the data from a different age group and the error
bars are the standard errors of each mean value. A fifth line indicates the averages of all 4
Figure 7. Mean Corrected scores for conditions 7, 2, 8 and 9 having T60 values 0.3, 0.6, 0.9 and 1.2 s respectively and a constant S/N(A) = -2 dB. Each line refers to the data
from a different age group and the error bars are the standard errors of each mean value.
A fifth line indicates the averages of all 4 age groups. (color online)
Figure 8. Mean corrected scores for condition 5 (direct sound only), condition 6 (direct
sound and early-arriving reflections) and condition 3 (direct sound with early and
late-arriving reflections). Each line refers to the data from a different age group and the error
bars are the standard errors of the mean values. A fifth line indicates the averages of all 4
age groups. (color online)
Figure 9. Comparison of mean speech intelligibility scores from conditions 1 and 2 (T60 0.3 and 0.6 s) with previous classroom study results. Large filled symbols are the new
results; small open symbols and regression lines are from the previous classroom study
(Figure 2 of reference [1]). (color online)
Figure 10. Comparison of experiment #2 results with those of Neuman and Hochberg [6].
The 6 and 8 year old data were from interpolations of Neuman and Hochberg’s data for 5,
7 and 9 year olds. (color online)
Figure 11. Plot of mean speech intelligibility scores versus U50 values for each of the 9 conditions and for each age group with associated linear regression lines for each age
group. Each vertical dotted line indicates the data for one condition as labelled at the top
Figure 12. Smoothed speech intelligibility scores plotted versus T60 values for the results of Experiment #1 with conditions having varied S/N values. The curved lines are second
order polynomial regression lines to the data. (color online)
Figure 13. Smoothed speech intelligibility scores plotted versus T60 values for the results of Experiment #2 with conditions having constant S/N value. The lines are linear
0 1 2 3 4 -10 -5 0 5 10 C50 , d B C50 , d B C50 , d B T60, s C50 , d B 500 Hz -10 -5 0 5 10 1000 Hz -10 -5 0 5 10 2000 Hz -10 -5 0 5 10 15 4000 Hz
0.0 0.5 1.0 1.5 2.0 0 5 10 15 20 25 30
G
(500,1k), dB
EDT(500,1k), s
125 250 500 1000 2000 4000 8000 0 5 10 T 60 = 1.2 s L R A C -HP L e ve l diff e ren ce , dB Frequency, Hz 0 5 10 T 60 = 0.9 s L R A C -HP Le ve l dif fe ren ce, dB 0 5 10 T 60 = 0.6 s L R A C -H P Le vel dif fere nce, dB 0 5 10 T60 = 0.3 s L R A C -H P Le ve l di ff e ren c e, dB
A B C D 50 60 70 80 90 100
Mea
n
sco
re,
%
Condition
HP-Score
AC-Score
A B C D 50 60 70 80 90 100
Mean scor
e
, %
Condition
HP-Score
AC-Score
1 2 3 4 50 60 70 80 90 100
Mean score, %
Condition
Grade 1
Grade 3
Grade 6
Adults
All
7 2 8 9 50 60 70 80 90 100
Mean score, %
Condition
Grade 1
Grade 3
Grade 6
Adults
All
5 6 3 50 60 70 80 90 100
Mean score, %
Condition
Grade 1
Grade 3
Grade 6
Adults
All
-15
-10
-5
0
5
10
15
20
25
30
20
40
60
80
100
Grade 6
Grade 3
Grade 1
Intelligibility, %
S/N(A), dB
0.0 0.5 1.0 1.5 50 60 70 80 90 100