HAL Id: hal-00296977
https://hal.archives-ouvertes.fr/hal-00296977
Submitted on 26 Apr 2007
HAL is a multi-disciplinary open access
archive for the deposit and dissemination of
sci-entific research documents, whether they are
pub-lished or not. The documents may come from
teaching and research institutions in France or
abroad, or from public or private research centers.
L’archive ouverte pluridisciplinaire HAL, est
destinée au dépôt et à la diffusion de documents
scientifiques de niveau recherche, publiés ou non,
émanant des établissements d’enseignement et de
recherche français ou étrangers, des laboratoires
publics ou privés.
Atmospheric instability analysis and its relationship to
precipitation patterns over the western Iberian
Peninsula
S. Queralt, E. Hernandez, D. Gallego, I. Iturrioz
To cite this version:
S. Queralt, E. Hernandez, D. Gallego, I. Iturrioz. Atmospheric instability analysis and its relationship
to precipitation patterns over the western Iberian Peninsula. Advances in Geosciences, European
Geosciences Union, 2007, 10, pp.39-44. �hal-00296977�
www.adv-geosci.net/10/39/2007/ © Author(s) 2007. This work is licensed under a Creative Commons License.
Geosciences
Atmospheric instability analysis and its relationship to precipitation
patterns over the western Iberian Peninsula
S. Queralt1, E. Hernandez1, D. Gallego2, and I. Iturrioz1
1Universidad Complutense de Madrid, Madrid, Spain 2Universidad Pablo de Olavide, Sevilla, Spain
Received: 18 July 2006 – Revised: 28 January 2007 – Accepted: 30 January 2007 – Published: 26 April 2007
Abstract. Thermodynamic and dynamic atmospheric
sta-bility indices will be analysed in order to classify the rain-fall types occurred in western Iberia and provide informa-tion about the associated meteorological phenomena and pre-ferred regional instability sources. In this work, instabil-ity sources over the western Iberian Peninsula will be char-acterised by means of radiosonde station data and reanaly-sis data sets from the European Centre for Medium-Range Weather Forecasts (ECMWF), for the period 1971–2002. Dynamic stability indices such as the Q vector divergence (dQ) or the potential vorticity anomaly in the 330 K isen-tropic surface (P V ) have been calculated with the aim of es-tablishing different atmospheric stability scenarios. Further-more, thermodynamic atmospheric stability contribution has been also evaluated with Total Totals index (T T ) and mois-ture availability was inferred from circulation weather types (CWTs). The first results of this work assess the combined dynamic-thermodynamic preferred conditions, synoptic situ-ations and humidity sources, leading to precipitation events over the western Iberian Peninsula and prove the essential role of CWT patterns on the rainfall genesis.
1 Introduction
The atmospheric stability indices derived from daily ra-diosonde observations are considered representative of the synoptic-scale environment (Davis et al., 1997). They are usually derived from the Integrated Global Radiosonde Archive (IGRA) which is the largest and most compre-hensive dataset of quality-assured radiosonde observations (Durre et al., 2006). In a recent work, stability indices de-rived from radiosonde data has been transformed into clima-tological variables to assess the variability of severe weather Correspondence to: S. Queralt
(queralt@fis.ucm.es)
potential (Derubertis et al., 2006). Other studies estimate water vapour trends (Ross and Elliot, 1996; Kassomenos et al., 2006) or temperature trends (Randel et al., 2005) from radiosonde dataset. Stability indices are usually employed to measure the ability of the atmosphere to develop severe weather or thunderstorm activity (Van Delden, 2003). The indices based on the energetic and thermal properties of the atmosphere account for the thermodynamical instability, while those founded on the velocity or geopotential heights quantify the dynamical instability. Both dynamic and ther-modynamic analyses are usually insufficient to fully explain the origin of precipitation events. It is also necessary to take into account the water vapour availability in the atmosphere, the location of the moisture sources and the dominant air fluxes. In this regard, the synoptic processes involved on in-stability extreme episodes can be monitored by determining humidity transport (Dai et al., 1999) or analyzing the CWTs affecting an area. Recently, Trigo et al. (2000) and Paredes et al. (2006) developed the CWTs classification for Western Iberia and, along with its associated humidity transport (see Table 1).
The aim of this work is to combine two kind of analysis usually performed separately in a given area. First, to char-acterise the thermodynamic/dynamic atmospheric instability for Western Iberian by using several instability indices and second, to relate this information with the humidity transport and the prevalent synoptic conditions based on a CWT anal-ysis.
2 Data set and Methodology
2.1 Data
Two daily radiosondes (00:00 UTC and 12:00 UTC) from IGRA have been used at four stations along the Western Iberian. They represent the Atlantic coastline facade; the
40 S. Queralt et al.: Atmospheric instability analysis
Table 1. The ten classes of CWTs (Trigo et al., 2000) and associated
humidity transport in western Iberia.
CWTs N◦ Symbol Associated flux
in western Iberia Anticyclonic type 33 A Variable
Cyclonic type 32 C Wet
Northeasterly type 11 NE Dry
Easterly type 12 E Dry
Southeasterly type 13 SE Dry
Souhterly type 14 S Dry
Southewesterly type 15 SW Wet
Westerly type 16 W Wet
Northwesterly type 17 NW Variable
Northerly type 18 N Variable
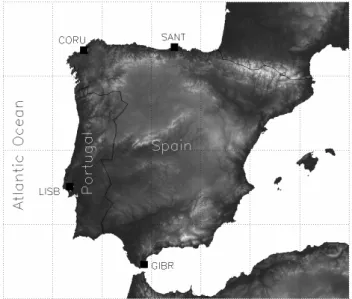
Fig. 1. Localization of the radiosonde stations in the study area.
stations are (from south to north): Gibraltar (GIBR), Lisboa (LISB), Santander (SANT) and A Coru˜na (CORU) (Fig. 1). The homogeneity of the series was assessed using the Lan-zante method (1996) and the data quality controls of Wallis (1998) and Ross et al. (2001). The study period is 1971– 2002 for all radiosonde stations except SANT, where dataset begins in 1986. The synoptic situations have been char-acterised by using the ERA40 reanalysis (horizontal and vertical velocity components, temperature and geopotential height) over an area comprised from 15◦N to 70◦N and 25◦W to 25◦E, with 0.5◦×0.5◦ spatial resolution. In ad-dition, daily rainfall observations from the National Weather Service of Spain (I.N.M) were obtained at each radiosonde site.
2.2 Dynamic instability indices
The divergence of Q vector is a direct measure of the forcing of vertical motion. In this work, dQ at 850 hPa (dQ850) and 500 hPa (dQ500) [kPa m−2s−1] at 00:00 UTC and 12:00 UTC has been calculated as (Hoskins et al., 1978):
∇2+f 2 σ ∂2 ∂p2 ! ω = −2 σ ∇ ·Q (1)
where f is the coriolis parameter, ω (u, v, p, t ) is the vertical velocity and σ is the stability parameter.
The potential vorticity anomaly (P V ) can be used to track stratospheric air intrusions into troposphere and therefore at-mospheric instability. P V at the 330 K isentropic surface has been obtained by subtracting the dynamic tropopause value, defined as 2 P V units (Hoskins et al., 1985) [1 P V unit=10−6m2s−1K kg−1]. Positive P V anomalies imply an atmospheric instability increasing.
2.3 Thermodynamic instability indices
A great number of thermodynamic instability indices can be found in the literature. In order to target the best indicator in the study area, a stepwise regression analyses was per-formed. A preliminary analysis (not shown) indicated that the best characterisation can be achieved by using the To-tal ToTo-tals index (T T ), being careful with moisture level lo-calization. T T value is computed as Miller (1967, 1972)
T T =T850+T d850−2T500, being T the temperature in◦C at the indicated levels and Td the dewpoint temperature. 2.4 Method
Instability data at 12:00 UTC and 00:00 UTC were compared with daily rainfall record to evaluate rain detection capabil-ities. According with climatological data, SANT shows the higher proportion of rainy days, (43,7%), closely followed by CORU (42,5%), LISB (30,0%) and finally GIBR (21,1%).
In order to classify the atmospheric instability conditions, a number of so-called “scenarios” were defined based on dQ,
P V and T T values. The probability distributions of these
instability parameters were found to follow a Gaussian dis-tribution in all stations and seasons and thus, it was possi-ble to classify the potential instability by using percentiles as threshold levels. Dynamically unstable scenarios (d) were defined as those cases with dynamical values of dQ or P be-tween a certain range of high percentile (for example p90 and p99 for an extremely dynamical instablility). On the other hand, those situations included between a range of low percentiles (for example p15 and p25) represent dynamically stable scenarios (D). To include the thermodynamic contri-bution the T T values were considered. So, thermodynam-ically unstable scenarios (t) were those characterised by a
T T value above a high percentile (p99, p95, p90, p85, p80
or p75). Cases with T T value below that percentile could be
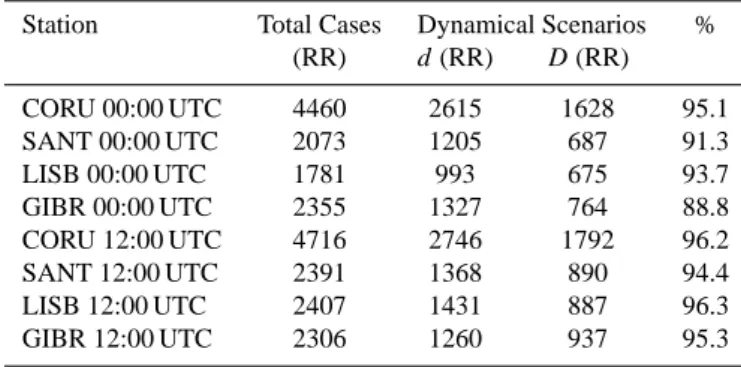
Table 2. Percentage of rainy days recognised by the dynamical
instability (d)/stability (D) scenarios at 00:00 UTC and 12:00 UTC observations.
Station Total Cases Dynamical Scenarios % (RR) d (RR) D (RR) CORU 00:00 UTC 4460 2615 1628 95.1 SANT 00:00 UTC 2073 1205 687 91.3 LISB 00:00 UTC 1781 993 675 93.7 GIBR 00:00 UTC 2355 1327 764 88.8 CORU 12:00 UTC 4716 2746 1792 96.2 SANT 12:00 UTC 2391 1368 890 94.4 LISB 12:00 UTC 2407 1431 887 96.3 GIBR 12:00 UTC 2306 1260 937 95.3
classified as thermodynamically stable scenarios (T ). Four stability scenarios have been defined by means of thermal and dynamical components: clearly dynamically and ther-mally unstable (dt ), dynamically-unstable and therther-mally- thermally-stable (dT ), dynamically-thermally-stable and thermally–unthermally-stable (Dt) and clearly dynamically and thermally stable (DT ) situa-tions. It must be noted that obtaining the specific percentile ranges defining each instability scenario is not a trivial issue (see the Sect. 3).
Finally, the prevalent CWT during each precipitation event has been considered. The CWT is based on the dominant flow and therefore it can be used as an approach to estimate the moisture availability. This analysis is essential as precip-itation will not develop or will be greatly limited if humidity sources are not available, even in cases with great dynamical instability. CWTs were characterised by means of mean pre-cipitation rate (mm/day), percentage of own days (% days) and associated observed rainfall proportion over total precip-itation amount (% totRR).
3 Results and discussion
3.1 Scenario definition
The combined analysis of the real precipitation and the insta-bility indices allow to optimize the specific percentile range defining the instability scenarios, yet capturing the precipita-tion signal. Scenario d was found to best represent the precip-itation when set to the cases with dynamical indices between p95 and p75. Cases between p5 and p25 represented well a
D scenario. Cases with extreme dynamical stability indices
(above p95 or below p5) were found to be extremely unsta-ble in their relation with precipitation and they have not been included in the study. Likewise, scenario t was found to op-timally represent thermodynamic instability when set to T T
Table 3. Annual proportions between stability scenarios at four
radiosonde stations. Station dT DT dt dT CORU 00:00 UTC 41.9 27.5 19.7 10.9 SANT 00:00 UTC 43.7 27.7 19.9 8.7 LISB 00:00 UTC 38.0 28.1 21.5 12.4 GIBR 00:00 UTC 34.3 24.1 29.1 12.5 CORU 12:00 UTC 39.1 27.5 21.4 12.0 SANT 12:00 UTC 41.1 30.3 19.4 9.1 LISB 12:00 UTC 38.5 26.0 23.2 12.3 GIBR 12:00 UTC 29.9 26.6 27.4 16.1
values higher than p85 while T T values below that threshold were found to be stable (T scenario).
As it is shown in Table 2, both dynamical scenarios, d and D, (40% of total cases) include most of the rainfall cases. Precipitation events recognised by 00:00 UTC obser-vations are slightly lower than those shown by 12:00 UTC in all stations. Scenario d explains more precipitation events than scenario D. This is consistent with the main classify-ing criterion. Regardclassify-ing thermodynamic scenarios, an av-erage of 70% of rainy cases belong to scenario T at the four studied stations, and the remaining cases (30%) belong to scenario t (not shown). Proportions between four sce-narios are shown in Table 3. They follow a common pat-tern in CORU, SANT and LISB stations: dT >DT >dt >Dt, both at 00:00 UTC and 12:00 UTC. Little variations from the annual pattern are found in spring (MAM) at CORU and LISB, where proportions during this season follow the order: dT >dt >DT >Dt. GIBR station shows a different behaviour, with dT >dt >DT >Dt for the two daily obser-vations. Overall, the seasonal analysis shows that dynami-cal instability is strengthened during spring at these stations whereas dynamical reinforcing during MAM is very subtle at SANT station.
3.2 CWTs analyses
In a second step, all rainy cases grouped by scenarios were classified by CWT at each season and station to test the rela-tion between the prevalent regime and instability character-istics.
3.2.1 Regional effects
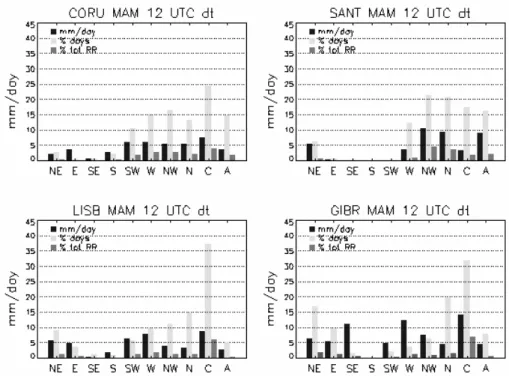
As an example of the regional signature of the CTW, we se-lected the dt scenario for MAM season since it represents the most unstable conditions. Figure 2 shows that the three westernmost stations (CORU-LISB-GIBR) present a distinct dynamical behaviour when compared to SANT. Prevalent CWT (in the sense of involving higher percentages of rain-fall cases) at CORU, LISB and GIBR is the cyclonic one
42 S. Queralt et al.: Atmospheric instability analysis
Fig. 2. Regional effects in MAM season at 12:00 UTC observation in the clerarly unstable scenario dt .
Table 4. Percentage of rainy cases explained by the three wettest
CWTs. Station Wet CWTs % RR C SW W CORU 12:00 UTC 16.4 14.6 24.4 55.4 SANT 12:00 UTC 7.0 1.3 10.7 19.1 LISB 12:00 UTC 24.1 14.2 18.1 56.4 GIBR 12:00 UTC 34.0 7.1 13.2 54.3
(C) whereas NW rainfall regime is predominant at SANT station. In more detail the prevalent CWTs at each station in frequency-decreasing order are: CORU and LISB: C, W, SW, NW, GIBR: C, NE, N, W, and SANT: NW, N, A, C. Despite the higher C days percentage in LISB, CORU and GIBR stations present a similar dynamical rainfall pattern and they only slightly differ on small explained precipitation cuantities. On the other hand, GIBR and SANT show, as a secondary regime, northly types preference (N, NE). These results can be extended to all seasons.
In agreement with Trigo et al. (2000), the three wettest CWTs (C, W and SW) account for more than a half of the observed daily precipitation at the Atlantic facade stations. This has been found for CORU, LISB, and GIBR (Table 4) On the contrary SANT station is completely deviated from this tendency, stressing the necessity to assess the local influ-ence.
3.2.2 Seasonal effects
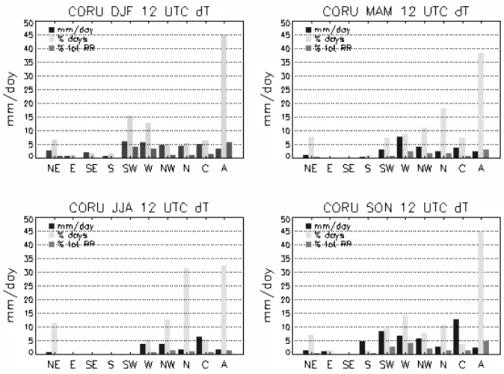
Figure 3 shows an example of the seasonal changes in the CWTs distribution for the precipitation occurred under the dT scenario at CORU station. Since the seasonal imprint is similar, this result is largely representative of the rest of the stability scenarios. Rainy cases belonging to anticyclonic type (A) are remarkably high during all seasons. Although A is a dry CWT, there is a large number of weak precipitation events inside this group but the extremely large frequency lead to a substantial amount of rainfall. In general, mean precipitation values are usually higher in SON and DJF sea-sons, mainly for the C. Regarding W and SW CWTs, they are stronger in DJF, MAM and SON. Northly CWTs (N, NE) are more active during JJA and MAM but despite its high frequency, they explain little of the total precipitation in these seasons. In spite of the partitioning method purposed, western Iberian rainfall regime is well supported by seasonal pattern precipitation derived from separately instability sce-narios. In this regard, most rainy cases are included in SON and DJF seasons.
3.2.3 Stability scenario-effects
Figure 4 illustrates the differences in the precipitation distri-bution for LISB in autumn as a function of the prevalent sta-bility scenario. C CWT is more frequent by far in d scenarios. Cyclonic type under dynamical instability scenarios explains more rainfall cases than D scenarios. C CWT developed un-der a DT scenario attains the highest mean rate
Fig. 3. Seasonal effects in CORU station at 12:00 UTC observation in the dynamical unstable scenario dT .
Fig. 4. Purposed stability scenarios at LISB station in SON at 12:00 UTC. Mean rate precipitation (mm/day) is referred to left axis,
percent-ages are referred to right axis.
tion values. Regarding thermodynamic behaviour, C CWT is preferably developed under t scenarios. Rainy cases in anti-cyclonic type (A) occurs under both d and D scenarios, with slight preference for d. Accordingly with the the fact that A CWT represents commonly very stable conditions, dynam-ical instability component in A explains more precipitation
percentage than stability one does. Most of rainy A CWT cases are gathered in T scenarios, that is in short dT scenario preference. W and SW CWT presented a similar pattern as C. Higher percentages of days and explained rainfall are in-cluded on dT escenario, whereas maximum mean rate pre-cipitation value are commonly reached at dt scenario.
44 S. Queralt et al.: Atmospheric instability analysis
4 Conclusions
In this work we have analysed instability indices and hu-midity sources in order to establish preferred atmospheric instability conditions leading to precipitations over western Iberia. To define both dynamical and thermal instability fea-tures, instability thresholds have been calculated by means of percentile evaluations. The main conclusions are explained next.
In any of the proposed scenarios the study of the humidity sources availability seems essential. In this sense, the asso-ciated weather types are determinant for the occurrence of precipitation.
The combination of thermal – dynamical stability com-ponents and CWTs as approachable humidity method have been used to design proper scenarios. Most of rainy cases occur under dynamically unstable scenarios in all western Iberian stations. The situations leading to precipitation from higher to lower are dT , dt, DT and Dt.
The proposed methodology constitutes a first step in the development of an objective classification scheme of unsta-ble conditions leading to precipitation in western Iberia. Our results reproduce the already known precipitation patterns. In addition, it seems capable of recognising the geographi-cal variability of the frequently elusive relationship between precipitation and instability conditions.
Differences are hardly detected between 00:00 UTC and 12:00 UTC. Slightly, diurnal observations showed higher in-stability values, whereas 00:00 UTC observations are trended to stability values. 12:00 UTC is better for evaluating ob-served rainfall percentages.
Acknowledgements. The authors wish to thank U.C.M. and M.E.C
for the grant and contract respectively, associated to CG04-05187-CO3-01/CLI project. The authors are also grateful to I.N.M. Special thanks to S. Michaelides for all his comments and help.
Edited by: S. C. Michaelides and E. Amitai Reviewed by: anonymous referees
References
Davis, R. E., Stanmayer, T. M., and Jones, G. V.: A synoptic clima-tology of tornadoes in Virginia, Phis. Geogr, 18, 383–407, 1997. Derubertis, D.: Recent trends in four common stability indices de-rived from U.S. radiosonde observations, J. Climate, 19, 309– 323, 2006.
Durre, I., Vose, R. S., and Wuertz, D. B.: Overwiev of the Integrated Global Radiosonde Archive, J. Climate, 19, 53–68, 2006. Dai, A. G.: Recent changes in the diurnal cycle of precipitation over
the United States, Geophys. Res. Lett., 26, 341–344, 1999. Hoskins, B. J., Draghici, I., and Davies, H. C.: A new look at the ω
equation, Quart. J. R. Meteorol. Soc., 104, 31–38, 1978. Hoskins, B. J., McIntyre, M. E., and Robertson, A. W.: On the use
and significance of isentropic potential vorticity maps, Quart. J. R. Meteorol. Soc., 111, 877–946, 1985.
Kassomenos, P. A. and McGregor, G. R.: The interannual variabil-ity and trend of precipitable eater over southern Greece, J. Hy-drometeorol., 7, 271–284, 2006.
Lanzante, J. R.: Resistant, robust and nonparametric techniques for analysis of climate data: Theory and examples, including appli-cations to historical radiosonde station data, Int. J. Climatol., 16, 1197–1226, 1996.
Miller, R. C.: Notes on analysis and severe storm forecasting pro-cedures of the Military Weather Warning Center, Tech. Rep. 200, AWS, U.S. Air Force, 94 pp, 1967.
Miller, R. C.: Notes on analysis and severe storm forecasting pro-cedures of the Air Force Global Weather Centre, Tech. Rept. 200 (Rev.), AWS, U.S. Air Force, 102 pp, 1972.
Paredes, D., Trigo, R. M., Garcia-Herrera, R., and Franco, I.: Understanding Precipitation Changes in Iberia in Early Spring: Weather Typing and Store-Tracking Approaches, J. Hydromete-orol., 7, 101–113, 2006.
Randel, W. J. and Wu, F.: Biases in stratospheric and tropospheric temperature trends derived from historical radiosonde data, J. Climate, 19, 2094–2104, 2006.
Ross, R. and Elliott, W. P.: Radiosonde-Based Northern Hemi-sphere Tropospheric Water Vapor Trends, J. Climate, 14, 1602– 1612, 2001.
Ross, R. and Elliott, W. P.:Tropospheric water vapour climatology and trends over North America: 1973–93, J. Climate, 9, 3561– 3574, 1996.
Trigo, R. M. and DaCamara, C.: Circulation Weather Types and their Influence on the Precipitation Regime in Portugal, Int. J. Climatol., 20, 1559–1581, 2000.
Van Delden, A. J.: Thunderstorm predictors and their forecast skill for the Netherlands, Atmos. Res., 67–68, 273–299, 2003. Wallis, T. W.: A Subset of Core Stations from the Comprehensive
Aerological Reference Dataset, J. Climate, 11, 272–282, 1998.