HAL Id: hal-00318196
https://hal.archives-ouvertes.fr/hal-00318196
Submitted on 21 Nov 2006
HAL is a multi-disciplinary open access
archive for the deposit and dissemination of
sci-entific research documents, whether they are
pub-lished or not. The documents may come from
teaching and research institutions in France or
abroad, or from public or private research centers.
L’archive ouverte pluridisciplinaire HAL, est
destinée au dépôt et à la diffusion de documents
scientifiques de niveau recherche, publiés ou non,
émanant des établissements d’enseignement et de
recherche français ou étrangers, des laboratoires
publics ou privés.
A numerical study of cell merger over Cuba ? Part II:
sensitivity to environmental conditions
D. Pozo, I. Borrajero, J. C. Marin, G. B. Raga
To cite this version:
D. Pozo, I. Borrajero, J. C. Marin, G. B. Raga. A numerical study of cell merger over Cuba ? Part
II: sensitivity to environmental conditions. Annales Geophysicae, European Geosciences Union, 2006,
24 (11), pp.2793-2808. �hal-00318196�
www.ann-geophys.net/24/2793/2006/ © European Geosciences Union 2006
Annales
Geophysicae
A numerical study of cell merger over Cuba – Part II: sensitivity to
environmental conditions
D. Pozo1, I. Borrajero2, J. C. Mar´ın1, and G. B. Raga1
1Centro de Ciencias de la Atm´osfera, UNAM, M´exico, Ciudad Universitaria, M´exico, DF, 04510, M´exico 2Instituto de Meteorolog´ıa de Cuba, Loma de Casablanca, Regla, C. Habana, Cuba
Received: 4 November 2005 – Revised: 19 September 2006 – Accepted: 20 September 2006 – Published: 21 November 2006
Abstract. In the first part of this study, an external 3-D
am-bient field (3d-field) was used to initiate a simulation (Sim1). In this paper, the influence of the 3-D field in the occurrence of the cloud merger simulated in Sim1 is studied. The sur-face convergence was very important to supply the lifting necessary for the development of new the convection. The interaction of the gust front from an old cloud with the en-vironmental wind, as well as the interaction between the two gust fronts, were the main factors that enhanced the surface convergence. A favorable perturbation pressure gradient was also found to intensify this mechanism. The formation and development of a new cloud from the cloud bridge was the main feature for the occurrence of the cloud merger.
The influence of the wind shear components and the rel-ative humidity (RH) in the occurrence of the cloud merger was also analyzed. The parallel wind shear component and the large RH present in the zone of study had a positive con-tribution to the occurrence of the cloud merger. However, the perpendicular wind shear component did not provide the main forced lifting which would be capable of generating the new convection along the direction between interacting clouds.
A high resolution simulation corroborated that the cloud merger was correctly simulated and it was not obtained by unrealistic effects due to the coarse resolution employed. It evidenced that when the horizontal resolution is improved, the life cycle of each cloud and the different processes related to their interactions are better described.
Keywords. Meteorology and atmospheric dynamics
(Con-vective processes; Mesoscale meteorology; Precipitation)
1 Introduction
On 21 July 2001 a number of severe storms developed over the region of Camaguey, Cuba, which were observed by
Correspondence to: D. Pozo
(dianarpl@yahoo.com)
radar. A numerical simulation (Sim1) was performed in or-der to realistically reproduce the development of the storms observed that day. A case representing the merger between cells at different stages of development was correctly repro-duced by the simulation and was in good agreement with radar observations. The state of development of each cell, the time when the merger occurred starting from the formation of clouds, the propagation motion of the cells and the increase in precipitation, due to the growth of the area after merger, were correctly reproduced. Simulated clouds matched the main characteristics of the observed radar echoes, though in some cases, reflectivity peaks and horizontal areas were overestimated. Maximum reflectivity values and the heights where these maximum values were located were in good agreement with radar data, particularly when the model flectivity was calculated without including the snow. The re-sults of Sim1 are described in the first part of this study.
The influence of the 3-D environmental initial field on the successfully simulated merger case in Sim1 was studied in the current paper where the results of sensitivity runs are pre-sented to better understand the parameters that favored the cloud merger.
A short review on the cloud merger is presented in Sect. 2. A description of the simulations performed, as well as the model used, its configuration and initialization, are described in Sect. 3. Sections 4 through 8 will show results and finally, in Sect. 9, conclusions are presented.
2 A short review on the cloud merger
Many observational and numerical studies have been per-formed to understand cloud interactions and merger pro-cesses. A review can be found in Wescott (1984, 1994). Among the most important results found in previous stud-ies is the existence of a cloud bridge preceding the cloud merger. Simpson (1980) and Simpson et al. (1980) pro-posed its formation due to the low-level convergence of cold outflows from interacting clouds. The cloud bridge was mentioned in later observational and numerical studies by
2794 D. Pozo et al.: A numerical study of cell merger over Cuba – Part II Cunning and DeMaria (1986), Westcott and Kennedy (1989),
Orville et al. (1980), Turpeinen (1982). Tao and Simpson (1984, 1989) particularly studied the positive influence of in-teracting downdrafts on the cloud merger with 2-D and 3-D models, respectively.
An environmental factor likely for the cloud merger is a favorable pressure gradient present in the region between the adjacent cells, as was mentioned by Orville et al. (1980). Turpeinen (1982) concluded in his 3-D study that the cloud merger analyzed resulted from the convergence forced by a perturbation pressure gradient and was not due to the inter-acting cold outflows. This favorable perturbation pressure gradient was also observed in simulated cloud merger cases in the numerical studies of Tao and Simpson (1984, 1989).
The alignment of clouds in relation to the mean wind shear vector has been found to be an important factor in the oc-currence of cloud merger. The process is favored when ad-jacent clouds are oriented parallel to the wind shear vector (Turpeinen and Yau 1981; Turpeinen 1982; Tao and Simp-son 1989; Stalker and Knupp, 2003), while those oriented perpendicular to the wind shear vector tend to develop with-out merging or the merger occurs only in fewer cases of the total number studied.
Differential motion of interacting cells have been men-tioned as favorable for cloud merger from observational stud-ies (Holle and Maier 1980; Cunning et al., 1982; Wescott and Kennedy 1989). Tao and Simpson (1989) simulated a case of merger between parallel cells where a differential motion between the interacting cells played an important role in its occurrence.
The effect of large-scale convergence forcing on cloud de-velopment has been observed by Ogura et al. (1979) and Cooper et al. (1982) in observational studies in the tropics. In particular, its influence on merger was mentioned by Holle et al. (1977) and Simpson et al. (1980). It was studied with the use of numerical models by Chen and Orville (1980), Tao and Simpson (1984, 1989). Tao and Simpson (1984) found that the most unfavorable conditions for merger are a less unstable stratification of the atmosphere and a weaker large-scale lifting.
In this paper, cloud merger will be analyzed in the same manner as was described for Sim1 in the first part of this study. Furthermore, the condition in which clouds must be joined for at least 15 min in order to consider the cloud merger to occur will be added, which has been used in other numerical studies (Tao and Simpson, 1984, 1989).
3 Methodology
3.1 Modelling approach
First of all, a simulation (Sim2) initialized with a homoge-neous field introduced by the 18:00 GMT sounding, taken at the Camaguey station on 21 July 2001, was run. With Sim2
it was studied whether the station sounding was sufficient to provide the environmental conditions likely for the merger case observed in Sim1.
Another simulation (Sim3) was initiated with a sound-ing extracted from Sim1 with ADAS (ARPS’s Data Anal-ysis System) program. The sounding was taken at a point near the place where the merger occurred, in order to an-alyze whether the extracted sounding, representative of the environment present in the zone, included more favorable en-vironmental conditions (obtained from Sim1’s initialization) for the occurrence of the merger than the station sounding used to initiate Sim2.
Three new simulations were performed to study the effect of some parameters, included in the 3-D environmental initial field of Sim1, on the occurrence of the cloud merger.
As was mentioned by Stalker and Knupp (2003), coarse resolution simulations can be inadequate for the correct re-production of the cloud merger and in some cases unrealistic results may be obtained. This was the reason that a high reso-lution simulation was performed, in order to demostrate that the cloud merger analyzed and simulated in this study was not due to the effect of the coarse resolution employed. 3.2 Model description and configuration
The numerical model ARPS (Version 4.5.1, in its 3-D con-figuration), a non-hydrostatic and compressible model, valid for scales from a few meters to hundreds of kilometers, was used (Xue et al., 1995). ARPS has been tested and widely used in numerical studies (Xu et al., 1996; Fovell and Tan 1998; Xue et al., 2001). Detailed information can be found in Xue et al. (2000, 2001, 2003).
A second order momentum advection was used, as well as a sub-grid turbulence parameterization of the order of 1.5, which involves the solution of an additional forecast equation for the turbulent kinetic energy. The microphysics parame-terization scheme of Lin et al. (1983) for solid and mixed phase processes were selected. The effects of the orography, land-use and radiation were also included, in order to main-tain the same configuration as in Sim1. All simulations were run for 4 hours on a grid of 95×95×70 points with a 1.5-km resolution in the horizontal and 0.250 1.5-km in the vertical direction.
The lateral boundary conditions proposed by Klemp and Wilhelmson (1978) were used. In this study, perturba-tion bubbles were located away from the lateral boundaries, thereby diminishing the interaction with them. At the top of the domain and the underlying surface, rigid wall conditions were assumed.
3.3 Initialization
All simulations designed for this study were initialized with a homogeneous 3-D field based on a sounding. In order to study the influence of the 3-D initial field of Sim1 on
the occurrence of the merger case, the horizontal inhomo-geneities of the observed meteorological fields were elimi-nated.
Initial thermal perturbations or “bubbles” were imposed in all simulations. This method may be not rigorous to simu-late the initiation of convection but due to its simplicity it has been widely used in 3-D numerical simulations of thunder-storm structure (Klemp and Wilhelmson, 1978; Weisman and Klemp, 1984; Rotuno and Klemp, 1985; McCaul and Weis-man, 2001) and also in cloud merger studies with satisfactory results (Turpeinen and Yau, 1981; Kogan and Shapiro, 1996; Stalker and Knupp, 2003).
The version 4.5.1 of ARPS can only be initialized with a single eliptical bubble, allowing its elongation only along the x and y axis. For this reason, changes in the source code of ARPS were necessary to allow it to be initialized with several bubbles elongated along any desired plane. Other changes were also introduced to permit perturbation bubbles to develop not only in a homogeneous field but in 3-D en-vironmental fields (e.g. an ARPS output). All simulations performed were designed with the same perturbation bub-ble configuration; they only differed on the sounding used in each initialization.
The maximum potential temperature excess, radial dimen-sions and positions for initial bubbles A1 and A2 were cho-sen similar to those precho-sent on perturbations which originated the clouds in Sim1 that later merged (Table 1). As in Sim1 the cloud merger occurred between two clouds with different life cycle stages, were the first thermal perturbation was lo-cated coincident with coordinates of the first developed cloud (A1). Simulations were run for 10 min, and a new bubble, A2, was included. This was the time when the perturbation associated with cloud A2 appeared in Sim1.
4 Simulation initiated with the observed sounding
The first simulation, called Sim2, was initiated with the 18:00 GMT sounding taken at the Camaguey station on 21 July 2001 (called SD hereafter), which was also used as part of the input data which initiated Sim1. The Camaguey station was located approximately 40 km away from the lo-cation where the merger occurred in Sim1. Sim2 analyzed whether the environmental conditions supplied by the station sounding were sufficient to produce the cloud merger case simulated in Sim1.
Results from Sim2 showed that merger did not occur. This evidenced that factors favorable for the occurrence of the cloud merger could not be provided by the sounding taken at the station (used to initiate Sim2). Those factors were intro-duced by the 3-D environmental initial field of Sim1, which, in addituion to including the station sounding (SD), it also included surface meteorological stations’ data and the MM5 output.
Table 1. Description of bubbles A1 and A2 used in this study.
Ra-dius in x, y and z, MPTE: maximum potential temperature excess and horizontal and vertical position in the domain.
Bubbles Rx Ry Rz MPTE Position
description (km) (km) (km) ◦K Horizontal Vertical
(km) (km)
A1 13 12 1.2 2.1 x=98 1.2
y=78
A2 9 9 1.2 2.5 x=116 1.2
y=78
5 Simulation initiated with an “extracted” sounding
Another simulation (Sim3) was initiated with a sounding ex-tracted from Sim1. It was taken at a point near the place where the cloud merger was observed and at a time before the perturbation associated to A1 appeared. The sounding, called 3-D-SD hereafter, was chosen as representative of the environmental conditions near the merger. The cloud merger was observed to occur in Sim3, demonstrating that the envi-ronmental conditions were favorable for the merger and they were provided by the 3-D ambient initial field of Sim1.
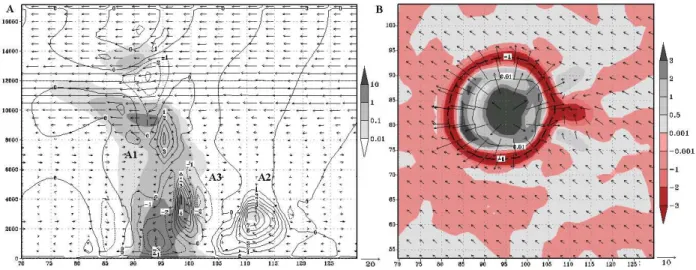
Figure 1A shows the vertical cross section of a plane through maximum updrafts of both clouds A1 and A2 at 22 min of simulation, when A1 is in its mature stage. Its max-imum development was reached 4 min before, with cloud top heights above 16 km and maximum updraft values larger than 40 m/s. At 22 min it presents rainwater values larger than 10 g/kg reaching the surface, maximum updrafts larger than 40 m/s and a cloud top height at 16 km. On the other hand, A2 is in its formation stage with maximum rainwater values between 1 and 10 g/kg and maximum updrafts larger than 10 m/s. A new cloud, A3, has formed adjacent and to the northeast of A1 (at its downshear side), since the wind shear vector in the layer between the surface and 6 km lies along the southwest-northeast direction. The localization of the three clouds can also be observed in a horizontal plane at 2 km in height (Fig. 2A). At this time, in the vertical plane, A3 presents rainwater values larger than 1 g/kg and maxi-mum updraft values larger than 5 m/s. The formation of A3 was due to the interaction of surface outflows from A1’s downdrafts with the environmental wind. Maximum down-drafts of A1 larger than –10 m/s associated with the region of maximum rainwater values, as well as the environmental wind from the east entering into the base of A3, can be seen in the figure. The formation of clouds along a single cold outflow has been described in observational and numerical studies (Holle and Maier, 1980; Peterson, 1984; Wescott and Kennedy, 1989; Weisman and Klemp, 1982; Rotuno et al., 1988).
2796 D. Pozo et al.: A numerical study of cell merger over Cuba – Part II
Fig. 1. A vertical cross section in Sim3 for a plane passing through maximum updrafts of (A) A1 and A2 at 22 min, (B) A3 at 34 min, (C)
A3 at 46 min, (D) A4 at 58 min. The shaded area represents qr+qh+qs [g/kg], solid lines the vertical velocity [m/s] and arrows wind velocity [m/s].
The convergence field is drawn in Fig. 3A at 22 min. The –1 K potential temperature perturbation boundary (dash line), representing the cold pool associated with A1, and the precipitation boundary, depicted at 0.01 g/kg, (solid line), were superimposed. In the figure, three centers of maxi-mum convergence associated with the three clouds, A1, A3 and A2, can be observed. The region of maximum conver-gence associated with A3 formed near the cold pool, due to the interaction of the gust front with the environmental wind. Greater surface winds at the downshear side of A3 than at its upshear side, can be seen. At this time, A3 intensifies after the formation of the cold pool.
The convergence zone of A3 was located in a zone of posi-tive perturbation pressure associated with A1 (Fig. 4A). Later on, when A3 intensified, a region of minimum pressure per-turbation displaced over this maximum convergence zone at the surface (not shown) and later it intensified, surrounded by a zone of positive perturbation pressure. This region of
minimum perturbation pressure may be associated with the pressure gradient opposing the buoyancy force and was ac-companied by an increase in the convergence region at the surface.
A2 and A3 reached their maximum development between 32 min and 34 min. At 34 min (Fig. 1B), A1 and A3 form a single cloud. In the figure, they are joined by rainwater values between 1 to 10 g/kg and by a single updraft core at middle and higher levels. The cell (A1+A3) has grown hor-izontally, as has A2 and they have approached each other. It reaches a larger maximum updraft and cloud top height than A2.
At 34 min, a cloud bridge with values larger than 0.1 g/kg can be observed joining both clouds (A1+A3) and A2 at 2 km in height, in the horizontal plane of Fig. 2B. The formation of a cloud bridge anteceding the cloud merger has been widely described in observational (Simpson et al., 1980; Wescott and Kennedy 1989) and numerical studies (Turpeinen, 1982;
Fig. 2. Horizontal cross section at 2 km. The shaded area represents qr+qh+qs [g/kg], isolines qc [g/kg] and arrows wind velocity [m/s]. At (A) 22, (B) 34, (C) 46, and (D) 58 min of simulation.
Tao and Simpson, 1984; 1989). In this case, two mechanisms could cause its formation: first, the deviation of the envi-ronmental wind flow around (A1+A3) and A2, causing an increase in the surface convergence along the cloud bridge zone (CBZ) between both clouds. This can be observed from earlier times (Figs. 3A, B). Second, the interaction of the gust front from (A1+A3) with the environmental wind which in-duces upward motions between both clouds. Both mecha-nisms caused the appearance of an updraft larger than 5 m/s below the cloud bridge (Fig. 1B). This new updraft formed in a zone of maximum convergence and above the cold pool of (A1+A3) (Figs. 1B and 3B). Simpson (1980) proposed
the collision of surface outflows from interacting clouds as the main cause for the cloud bridge formation. Even though in this case, this was not the main mechanism associated with the cloud bridge formation, the interaction proposed by Simpson intensified the development of a new convec-tion from the cloud bridge at later times. When the cold pool of A2 formed 2 min later, the convergence in the CBZ was increased with the consequent intensification of a cell from the cloud bridge. The development of a cloud from the cloud bridge has been mentioned in observational (Cunning et al., 1982; Wescott and Kennedy, 1989) and numerical studies (Tao and Simpson, 1984; 1989).
2798 D. Pozo et al.: A numerical study of cell merger over Cuba – Part II
Fig. 3. Horizontal cross section at 247 m from the surface. The shaded area represents the convergence field, isolines the 0.01 g/kg threshold
of qr+qh+qs [g/kg], dashed lines the cold pool (–1◦K) and arrows wind velocity [m/s]. At (A) 22, (B) 34, (C) 46, and (D) 58 min of simulation.
At this time (34 min), a zone of positive pressure pertur-bation exists below this new convection (Fig. 4B), associ-ated with the cold pool of (A1+A3). This positive perturba-tion pressure zone joins with the one associated to A2 at the next time. With the intensification of the convection in the cloud bridge, a negative zone of perturbation pressure, as a result of the positive buoyancy due to the release of latent heat above, appears in this region, enhancing its further de-velopment (Fig. 4C). This also causes a perturbed pressure gradient (Figs. 4 B, C) from the zones of positive pressure perturbation located under A2 and (A1+A3) (older clouds) to the zone of negative pressure perturbation associated with the new cloud (A4) growing from the cloud bridge, which was
favorable for the cloud merger. A perturbed pressure gradient enhancing the cloud merger has been mentioned by Orville et al. (1980), Tao and Simpson (1984; 1989). At higher lev-els (Fig. 1B), a strong radial flow from A2 transports air with hydrometeors towards (A1+A3) between 10 and 14 km, ap-proximating both clouds through the higher levels. At later times, both clouds begin to join both at low and high levels.
At 46 min, both clouds (A1+A3) and A2 are joined by maximum rainwater values between 1 and 10 g/kg at lower levels and between 0.1 and 1 g/kg at higher levels (Fig. 1C). A4 can be seen developing between both clouds. The up-drafts from (A1+A3), A2 and A4 are joined by low values at low levels. A new cloud, A5, has formed adjacent and
Fig. 4. Horizontal cross section at 247 m from the surface. The shaded area represents the perturbation pressure field [hPa], isolines the
0.01 g/kg threshold of qr+qh+qs [g/kg], dashed lines the cold pool (–1◦K) and arrows wind velocity [m/s]. At (A) 22, (B) 34, (C) 46, and
(D) 58 min of simulation.
downshear to A2 by the second mechanism proposed for the formation of A3. At this time, A5 presents maximum rain-water values between 1 and 10 g/kg and maximum updrafts greater than 15 m/s. A single cloud joined in the CBZ by rainwater values larger than 1 g/kg can also be seen in the horizontal plane of Fig. 2C at 2 km in height.
When the convergence field is analyzed, a strong conver-gence in the CBZ between two zones of diverconver-gence asso-ciated with downdrafts from (A1+A3) and A2 can be seen in Fig. 3C. A2 is surrounded by a strong convergence zone, which also coincides with the zone where A5 is developing northeast of A2 and adjacent to the cold pool. In Fig. 4C the aforementioned negative perturbation pressure region in the
CBZ can be seen, surrounded by a region of positive pertur-bation pressure associated with the older clouds. This neg-ative perturbation pressure enhances the horizontal pressure gradient favorable for the occurrence of the cloud merger.
In this simulation the cloud merger occurred at 56 min. It can be seen in the vertical plane of Fig. 1D some time later (at 58 min). A single updraft core exists at the middle and higher levels with maximum values larger than 30 m/s. The cloud is joined by rainwater values greater than 1 g/kg and a maximum core with values greater than 10 g/kg is lo-cated under the maximum updraft. At 56 min, this maximum rainwater core was located above in the zone of maximum updrafts. A completely merged cloud with rainwater values
2800 D. Pozo et al.: A numerical study of cell merger over Cuba – Part II
Fig. 5. Comparison between the SD and the 3-D-SD soundings. (A) the u wind component [m/s], (B) the v wind component [m/s], (C) the
relative humidity (D). Mean wind shear [s−1] calculated in the layer from the surface to 2, 4 and 6 km of height.
greater than 1 g/kg can also be seen in the horizontal plane of Fig. 2D at 2 km from the surface. The cloud merger occurred by the development of the cloud A4 from the cloud bridge. This has been described in observational and numerical stud-ies (Simpson, 1980; Wescott and Kennedy, 1989; Tao and Simpson, 1984; 1989) as a mechanism for the occurrence of a merger. The maximum values of updrafts and rainwa-ter at the time of merger were localized in the zone where A4 formed. At 58 min, the convergence zone at the surface weakened in the CBZ and a transition towards positive val-ues is observed, associated with the precipitation from the merged cloud (Fig. 3D). On the other hand, positive perturba-tion pressure values associated with precipitaperturba-tion/downdrafts from the merged cloud are located in the zone occupied by the merged cloud (Fig. 4D). The merged cloud continued growing for 4 min after the start of the merger. Afterwards, it began to decay. Wescott (1994), in a statistical study with radar data, found that a significant number of clouds that grew after the merger were younger and thus likely to con-tinue growing. In this case, the merged cloud did not develop much. None of the clouds in the simulation reached a greater development than A1, not even the merged cloud. On the other hand, the perturbation bubble A2 was firstly designed with the same value of maximum potential temperature
ex-cess as in A1 (2.1 K) and it did not develop. This value was later increased to 2.5 K, in order that A2 could develop as it did in Sim3. Those factors suggested that A1 might have in-teracted negatively with the younger cloud A2, as has been mentioned by Kogan and Shapiro (1996).
6 Sensitivity to ambient wind shear on the occurrence of the merger
Both soundings SD and 3D-SD were compared, in order to analyze which environmental conditions included in 3D-SD were favorable for the occurrence of the merger. Differences mainly on the wind speed components u and v, as well as a moisture stratification in 3D-SD were observed (Figs. 5A, B and C). When the wind shear vector in the layer from the sur-face to 6 km was analyzed, a larger component in the x direc-tion was observed in 3D-SD than in SD. On the other hand, the wind shear component along the y direction was larger in SD (Fig. 5D). As both cloud centers in zone A were situated along a line parallel to the x axis on that day (21 July 2001), the parallel component of the wind shear was greater along the direction where the cloud merger occurred in Sim3 and the perpendicular component of the wind shear was greater in Sim2, since it was initiated with SD.
Two simulations (Sim3 par and Sim3 perp) were per-formed to study the effect of each wind shear component on the occurrence of the cloud merger in Sim1. Sim3 par was initiated substituting the wind field in 3D-SD by its u component, which was parallel to the axis passing through the centers of the interacting clouds. On the other hand, Sim3 perp was initiated with the wind field of 3D-SD sub-stituted by its v component, perpendicular to this axis. The rest of the model configuration was the same as that used in Sim3. Table 2 shows the complete set of simulations per-formed for this study, their initialization characteristics and the time when the merger was observed.
One of the main differences among the three simulations (Sim3, Sim3 par and Sim3 perp) was related to the posi-tion where the new convecposi-tion developed. In Sim3, the new clouds, A3 and A5, formed and developed downshear from A1 and A2, respectively, at their northeast side. In Sim3 par, A3 and A5 formed downshear from A1 and A2, along the x axis, due to the parallel wind shear direction. This can be observed in the horizontal plane of Fig. 6A at 2 km from the surface (t=34 min). A3, A4 and A5 formed by the same mechanisms described in Sim3. A3 joined with A1 2 min earlier than it did in Sim3 (at 32 min). At this time it was a lit-tle closer to A2 than at the same time in Sim3 and a stronger updraft was observed adjacent to A3 (Fig. 6B). In general, A3 developed slower in Sim3 par than in Sim3, though it reached the same development in both simulations. On the other hand, A2 developed faster and stronger than in Sim3. This was evidenced at each time step since the earlier times of the simulation by a stronger convergence zone at the sur-face, as well as greater maximum updrafts, top and rainwater values than in Sim3. In Sim3 par, the cloud bridge formed at the same time as in Sim3 (34 min). This can be seen in the horizontal plane of Fig. 6A. The mechanisms that caused its formation were the same as those in Sim3.
However, in this simulation, the environmental wind com-ponent in the direction along the gust front was larger, en-hancing the convergence in the CBZ before 34 min. Fig-ure 7A shows a larger convergence field at the surface than in Sim3 at this time. The formation of the cold pool of A2 some time later with the subsequent interaction with the one from (A1+A3) enhanced much more the convergence in the CBZ and the formation of the new updraft (A4) from the cloud bridge that developed faster and stronger than in Sim3. When the perturbation pressure field was analyzed, the same pattern described in Sim3 was observed, though more inten-sified. A wider and stronger negative perturbation pressure region appeared below the new convection at that time and later, enhancing the convergence at the surface and causing a stronger perturbation pressure gradient which was favorable for a faster cloud merger occurrence.
Both in Sim3 and in Sim3 par, the cloud merger started from the development of A4 from the cloud bridge. How-ever, in Sim3 par the cloud merger occurred earlier (52 min) due to the faster and stronger development of some cells in
Table 2. Description of the simulations performed in this study.
Initialization and the time when merger was observed (tmerger). Simulations Initialization tmerger
(min)
Sim2 SD No
Sim3 3D-SD 56
Sim3 par 3D-SD with the 52
v-component = 0
Sim3 perp 3D-SD with the No
u-component = 0
Sim3 RH 3D-SD with its RH No sustituted by RH from SD
Sim3 hr 3D-SD and high resolution 42
this simulation. In Fig. 7B a single updraft core from the middle to the higher levels can be observed and a greater re-gion of maximum rainwater values than in Sim3 was located in the maximum updraft core. The merged clouds are joined by rainwater values between 1 and 10 g/kg and the new cloud A5, formed to the right of A2, can also be seen. In general, the cloud merger was more intense in this simulation than in Sim3, presenting a higher cloud top height, maximum up-draft and a maximum rainwater area.
On the other hand, in Sim3 perp, A3 did not appear be-side A1 and no new convection developed from A1 until at later times and only in the direction downshear of A1 (along the N-S direction). At 34 min, the cloud bridge also formed between A1 and A2 due to the same mechanisms described in Sim3 and Sim3 par. A maximum convergence zone was present in the CBZ larger than that in Sim3 prior to 34 min (Fig. 8A). Nevertheless, no deep convection de-veloped from the cloud bridge since the interaction between the cold pool from A1 and the environmental wind was not strong enough to generate the formation of clouds from the CBZ. The environmental wind in Sim3 perp was directed along the north/south direction, diminishing the interaction with the gust front of A1 in the direction along the CBZ, in contrast to what happened in Sim3 and Sim3 par, where a great component of the environmental wind in the east/west direction was present (Figs. 3B, 7A and 8A).
The cold pool of A2 appeared at the same time than in the other simulations (36 min). At this time, the convergence of both cold outflows was near the left side of A2, which generated a new updraft which was incorporated into the up-draft of A2 at 42 min (Fig. 8B). Clouds A1 and A2 developed stronger and faster than in Sim3. The precipitation area as-sociated with A2 was observed at the surface earlier than in Sim3 (at 30 min). When the perturbation pressure field was analyzed, a similar pattern to that in Sim3, though somewhat stronger was observed since the earlier times until 34 min. At
2802 D. Pozo et al.: A numerical study of cell merger over Cuba – Part II
Fig. 6. (A) Same as Fig. 2B except for Sim3 par. (B) Same as Fig. 1B except for Sim3 par.
Fig. 7. (A) Same as Fig. 3B except for Sim3 par. (B) Same as Fig. 1 except for Sim3 par at 52 min.
this time, the cloud bridge forms but the negative perturba-tion pressure zone that originated the pressure gradient favor-able for the occurrence of the merger in Sim3 and Sim3 par never appears (Figs. 9 A, B).
In this simulation, clouds A1 and A2 join by rainwater values between 0.1 and 1 g/kg, but after 12 min approxi-mately they separate. According to the definition of the cloud merger used in this paper (clouds must be joined for at least 15 min), the merger did not take place in this case.
7 Sensitivity to ambient relative humidity profile
The relative humidity (RH) was the other parameter which presented larger differences when both soundings 3D-SD and SD were compared. This was the reason that a new simula-tion (Sim3 RH) was performed with the aim of studing the effect of the RH on the occurrence of the cloud merger in Sim1. It was initiated with 3D-SD but substituting its RH values with those from SD. The RH was an important fac-tor for the occurrence of more merger cases in the numerical study of Tao and Simpson (1984), when two different strati-fications were used in their simulations.
Fig. 8. (A) Same as Fig. 3B except for Sim3 perp. (B) Same as Fig. 1 except for Sim3 perp at 42 min.
Fig. 9. (A) Same as Fig. 4B except for Sim3 perp. (B) Same as Fig. 4C except for Sim3 perp.
Clouds A2 and A3 developed later than they did in previ-ous simulations Sim3, Sim3 par and Sim3 perp, (at 44 min and 32 min, respectively). When A2 formed, A1 was in its dissipation stage, as can be seen in the vertical plane of Fig. 10A at 44 min. Rainwater values greater than 0.01 g/kg were present in A2 at this time when the cold pool associ-ated with A1 reached the convergence zone of A2 at the sur-face (Fig. 10B). Later, A2 continued its development with the subsequent dissipation of A1. The cloud merger could not be seen in this simulation, evidencing the importance of the RH in the cloud merger under study.
8 Sensitivity to higher grid spacing resolution
Finally, a high-resolution simulation (Sim3 hr) was per-formed using 3D-SD as an initial condition, designed to an-alyze whether the case of the merger observed was correctly simulated and not due to unrealistic effects of the coarse-resolution employed. A 165×112×140 grid domain was chosen with a grid spacing of 150 m and 100 m in the hori-zontal and vertical direction, respectively. The rest of the pa-rameters were mantained equal, as in the other simulations.
The results indicate that the development of A3, together with that of A4 from the cloud bridge, was observed to oc-cur by the same mechanisms as in Sim3, though with some
2804 D. Pozo et al.: A numerical study of cell merger over Cuba – Part II
Fig. 10. (A) Same as Fig. 1 except for Sim3 RH at 44 min. (B) Same as Fig. 3 except for Sim3 RH at 44 min.
differences. In general, all features described in the previ-ous simulations, Sim3 and Sim3 par, were observed earlier in this simulation. Furthermore, clouds with stronger updrafts were obtained and the mechanisms intervening in the cloud merger were observed with a greater degree of detail when resolution was increased.
Clouds A2 and A3 start to form 6 min earlier in this simu-lation compared to Sim3 (at 16 min). At 22 min (Fig. 11 A), clouds A2 and A3 are in their development stage with max-imum updrafts larger than 30 m/s and maxmax-imum rainwater values larger than 10 g/kg. A2 reaches its maximum devel-opment at 30 min (4 min before than in Sim3), while A3 joins with A1 at 28 min (Fig. 11B) and reaches its maximum de-velopment 4 min later. The precipitation area at the surface associated with A2 appears at 26 min and its cold pool 4 min later. As in Sim3, A4 forms from the cloud bridge and its de-velopment induces the cloud merger (Fig. 11D) earlier than in Sim3 and Sim3 par (Table 2).
The convergence zone in the CBZ is further analyzed due to its importance for the cloud merger. In Figs. 12A, C, E, and G, the shaded areas represent the vertical velocity field, the solid lines represent the precipitation water and the hori-zontal wind field is superimposed. Figures 12B, D, F, and H, show the perturbation of humidity (shaded areas), the excess of potential temperature (solid lines are positive values and dashed lines are negative values) and the 0.1 g/kg precipita-tion water contour by the thick solid line. These figures show only a small part of the domain (the CBZ) from the surface to near 7 km in height.
At 20 min (Figs. 12A, B) the formation of the first cell A3 adjacent to the downdraft of A1 can be seen. The moist envi-ronmental air ascends up to 6 km and the maximum updraft coincides with a maximum of perturbation of humidity and a positive potential temperature excess. This is in agreement
with theory, as when moist air ascends, it becomes saturated and condensation is produced accompanied by a latent heat release which contributes to accelerate the air parcel. On the other hand, a drier layer over 500 m in height is penetrat-ing inside the zone of upward motions, cuttpenetrat-ing off the flow of moist air to the right of A3 (Fig. 12B). To obtain some information of parcel trajectories, streamlines and the poten-tial temperature field at 22 min are shown in Figs. 13A, B. The horizontal plane of Fig. 13A shows that the air between A1 and A2 comes from the environment that surrounds A2. This air (high potential temperature) rises to form A3 when it interacts with the cold outflow of A1 (low potential temper-ature), as can be seen in Fig. 13B. The convergence between the environmental air and the cold outflow of A1 causes the parcels to ascend and overcome the LFC, which is located about 1500 m in this case.
At 24 min, the inflow of moist air to A3, supplied by the interaction of the cold outflow with the environmental air, has been completely cut off. The cold outflow from A1 has propagated to the right, supplying the forcing necessary for a new updraft development of moist air, which can be seen along the cold pool (Figs. 12C, D). On the other hand, A2 and A1 are approaching each other and the air between them has moistened above 3 km.
At 32 min, the new updraft formed at 24 min has devel-oped in a cell reaching heights above 7 km. The older cloud (A1+A3) has moved together with its cold pool and an in-crease in the humidity is observed from the surface up to 4 km, due to the formation of the cloud bridge at 26 min (Figs. 12E, F). Vertical motions in the CBZ can be seen in Fig. 12E. At this time a similar pattern to that at 20 min is observed but displaced ∼2 km to the right. However, the air between both clouds is moister than at that time, due to its proximity. The mechanisms described here are similar to
Fig. 11. A vertical cross section in Sim3 hr for a plane passing through maximum updrafts of (A) A1 and A2 at 22 min, (B) A3 at 28 min, (C) A3 at 40 min, (D) A4 at 42 min. The shaded area represents the vertical velocity [m/s], solid lines qr+qh+qs [g/kg] and arrows wind
velocity [m/s].
those mentioned by Fovell and Tan (1998) for the formation of a new cell in a multicell storm and are consistent with the shear profile used.
At 36 min, an increase in the downdrafts and the sub-sequent increase in the cold outflows from the interacting clouds is observed (Fig. 12G). Both cold pools have ap-proached each other and an updraft with values greater than 15 m/s formed between them due to the forced lifting. In Fig. 12H, a moist area is connecting both clouds at low levels. It is wider than that observed in Fig. 12E and presents pos-itive values of potential perturbation temperature at its base, due to the inflow of moist air and negative values above due to its evaporation.
It is known from observational studies that the new cloud which forms from the cloud bridge presents higher values of reflectivity at lower levels from its earlier stages. In Fig. 11C, the zone where the surface outflows from both clouds (A1+A3) and A2 interact (near x=25 km) shows
strong upward motions originated by the convergence. The upward motions transport high concentrations of hydromete-ors, which are incorporated into the new cloud, allowing high precipitable water contents in the cloud.
9 Summary and conclusions
A simulation (Sim1) was performed in the first part of this study, initialized with a 3-D environmental field (3-D field). It included a station sounding, surface meteorological sta-tions data and 3-D meteorological fields from outputs of the MM5 model. The influence of the 3-D field in the occurrence of the cloud merger observed in Sim1 was studied in this pa-per. A homogeneous horizontal field based on the observed station sounding could not supply the favorable ambient con-ditions for the occurrence of the cloud merger. The distance between the upper air station sounding and the zone where the merger occurred, as well as the time when the sounding
2806 D. Pozo et al.: A numerical study of cell merger over Cuba – Part II
Fig. 12. Region between interacting clouds from the surface to 7 km. (A, C, E, G): The shaded area represents the vertical velocity [m/s],
solid lines qr+qh+qs [g/kg] and arrows wind velocity [m/s] at 20, 24, 32 and 36 min of simulation. (B, D, F, H): The shaded area represents the perturbation humidity field [g/kg], solid lines the potential temperature perturbation [◦K], heavy line is cloud mixing ratio of 0.1 g/kg and arrows wind velocity at 20, 24, 32 and 36 min of simulation.
Fig. 13. (A) A horizontal cross section in Sim3 hr at 22 min, (B) A vertical cross section in Sim3 hr for a plane passing through maximum
up-drafts of A1 and A2 at 22 min. The streamlines are represented in grey color, the shaded areas represent the equivalent potential temperature, the black solid lines are the 0.1 g/kg cloud water content and the white dashed line is the –1◦K potential temperature perturbation.
was taken contributed negatively to the sounding in capturing the local enviroment.
The cloud merger was successfully simulated when a sounding extracted from a point near the place where the merger took place in Sim1 was used as initialization, thus, evidencing that the RH field is pre-conditioned by the mesoscale convergence to be more favorable for the convec-tive development between clouds A1 and A2. This simula-tion showed the main mechanisms by which the cloud merger took place. The surface convergence was very important in supplying the lifting necesssary for the development of new convection. The interaction of the gust front from an old cloud with the environmental wind, the air flow around the clouds or perturbations, as well as the interaction between two gust fronts, had large contributions to the forced lifting which generated new convection. The formation of the cloud bridge was observed due to this mechanical forced lifting. Although its generation was due mainly to the interaction of the gust front of the old cloud with the environmental wind and not by the interaction of two cold outflows, as proposed by Simpson (1980), this last mechanism enhanced the devel-opment of a new cloud. The later develdevel-opment of this new cloud from the cloud bridge was the main feature for the oc-currence of the cloud merger, since it joined with the older clouds in a single rainwater cloud presenting a maximum up-draft core. A favorable perturbation pressure gradient was found to enhance the cloud merger.
The influence of the wind shear components and the rel-ative humidity (RH) in the occurrence of the cloud merger was also analyzed. It was evident that the parallel wind shear component and the larger RH present in the zone of study both had a positive contribution to the occurrence of the cloud merger. However, the perpendicular wind shear component, though providing a greater development of the interacting clouds, did not supply the forced lifting capable of generating the new convection along the direction between the interacting clouds and thus no new cloud developed from the cloud bridge.
A high resolution simulation (Sim3 hr) confirmed that the cloud merger in Sim1 was correctly simulated and it was not due to the coarse resolution employed. Sim3 hr evidenced that when the horizontal resolution is improved, the life cy-cle of each cloud and the different processes relating to their interaction are better described. Shorter times for the ap-pearance of the new cells, the formation of the cloud bridge and the occurrence of the cloud merger were obtained. Fur-thermore, the older clouds were in a later development stage when each interaction previously described took effect.
A more detailed and closer analysis of the formation of the new cells by the forced lifting mechanisms showed that the new cells in the parent clouds originated and developed in a similar way as the new convection forms in a multicell cloud. The results of this study allowed for a better understanding of the mechanisms and interactions which led to the occurrence of the cloud merger in Sim1 that was observed by radar data on 21 July 2001 (Part I).
2808 D. Pozo et al.: A numerical study of cell merger over Cuba – Part II
Acknowledgements. The authors would like to thank the reviewers
for their comments and suggestions which improved the quality of this paper. The authors also thanks the Oklahoma University for giving free access to ARPS model.
Topical Editor F. D’Andrea thanks K. Brewster and another ref-eree for their help in evaluating this paper.
References
Chen, C.-H. and Orville, H. D.: Effects of mesoscale convergence on cloud convection, J. Appl. Meteor., 18, 256–274, 1980. Cooper, H. J., Garstang, M., and Simpson, J.: The diurnal
interac-tion between convecinterac-tion and peninsular-scale forcing over South Florida, Mon. Wea. Rev., 110, 486–503, 1982.
Cunning, J. B. and DeMaria, M.: An investigation of development of cumulonimbus systems over South Florida, Part I: Boundary layer interactions, Mon. Wea. Rev., 114, 5–24, 1986.
Cunning, J. B., Holle, R. H., Gannon, P. T., and Watson, A. I.: Convective evolution and merger in the FACE experimental area: Mesoscale convection and boundary layer interactions, J. Appl. Meteor., 21, 953–977, 1982.
Fovell, R. G. and Tan, P.-H.: The temporal behavior of numerically simulated multicell-type storms, Part II: The convective cell life cycle and cell regeneration, Mon. Wea. Rev., 551–577, 1998. Holle, R. L. and Maier, M. W.: Tornado formation from downdraft
interaction in the FACE mesonetwork, Mon. Wea. Rev., 108, 991–1009, 1980.
Holle, R. L., Cunning, J., Thomas, J., Gannon, P., and Teijeiro, L.: A case study of mesoscale convection and cloud merger over South Florida, Preprints 11th Tech. Conf. Hurricanes and tropical Meteorology, Miami Beach, Amer. Meteor. Soc., 428–435, 1977. Klemp, J. B, and Wilhelmson, R. B.: The simulation of three-dimensional convective storm dynamics, J. Atmos. Sci., 35, 1070—1096, 1978.
Kogan, Y. L. and Shapiro, A.: The simulation of a convective cloud in a 3D model with explicit microphysics, Part II: Dynamical and microphysical aspects of cloud merger, J. Atmos. Sci., 53, 17, 2525–2545, 1996.
Lin, Y. L., Farley, R. D., and Orville, H. D.: Bulk parameterization of the snow field in a cloud model, J. Appl. Meteor., 22, 1065– 1092, 1983.
McCaul, E. W. and Weisman, M.: The sensitivity of simulated su-percell structure and intensity to variations in the shapes of en-vironmental buoyancy and shear profiles, Mon. Wea. Rev., 129, 664–687, 2001.
Ogura, Y., Chen, Y.-L., Russell, J., and Soong, S.-T.: On the forma-tion of organized convective systems observed over the GATE A/B array, Mon. Wea. Rev., 107, 426–441, 1979.
Orville, H. D., Kuo, Y.-H., Farley, R. D., and Hwang, C. S.: Nu-merical simulation of cloud interactions, J. Rech. Atmos., 14, 499–516, 1980.
Peterson, R. E.: A triple-Doppler radar analysis of a discretely prop-agating multicell convective storm, J. Atmos. Sci., 41, 2973– 2990, 1984.
Rotuno, R., Klemp, J. B., and Weisman, M. L.: A theory for strong, long lived squall line, J. Atmos. Sci., 45, 1356–1377, 1988.
Rotuno, R. and Klemp, J. B.: On the rotation and propagation of simulated supercell thunderstorms, J. Atmos. Sci., 42, 271–292, 1985.
Simpson, J.: Downdrafts as linkages in dynamic cumulus seeding effects, J. Appl. Meteor., 19, 477–487, 1980.
Simpson, J., Westcott, N. E., Clerman R. J., and Pielke, R. A.: On cumulus mergers, Arch. Meteor. Geophys. Bioklim., 29A, 1–40, 1980.
Stalker, J. R. and Knupp, K. R.: Cell merger potential in multicell thunderstorms of weakly sheared environments: Cell separation distance versus planetary boundary layer depth, Mon. Wea. Rev., 131, 1678–1695, 2003.
Tao, W. K. and Simpson, J.: Cloud interactions and merging: Nu-merical simulations, J. Atmos. Sci., 41, 2901–2917, 1984. Tao, W. K. and Simpson, J.: A further study of cumulus
interac-tions and mergers: Three dimensional simulainterac-tions with trajectory analyses, J. Atmos. Sci., 46, 2974–3004, 1989.
Turpeinen, O. and Yau, M. K.: Comparisons of results from a three-dimensional cloud model with statistics of radar echoes on day 261 of GATE, Mon. Wea. Rev., 109, 1495–1511, 1981. Turpeinen, O.: Cloud interactions and merging on day 261 of
GATE, Mon. Wea. Rev., 110, 1238–1254, 1982.
Weisman, M. L. and Klemp, J. B.: The dependence of numerically simulated convective storms on vertical wind shear and buoy-ancy, Mon. Wea. Rev., 110, 504–520, 1982.
Weisman, M. L. and Klemp, J. B.: The structure and classification of numerically simulated convective storms in directionally vary-ing shears, Mon. Wea. Rev., 112, 2479–2498, 1984.
Wescott, N. E.: A historical perspective on cloud mergers, Bull. Amer. Meteor. Soc., 65, 219–226, 1984.
Westcott, N. E.: Merging of convective clouds: Cloud initiation, bridging, and subsequent growth, Mon. Wea. Rev., 122, 780– 790, 1994.
Wescott, N. E. and Kennedy, P. C.: Cell development and merger in an Illinois thunderstorm observed by Doppler radar, J. Atmos. Sci., 46, 117–131, 1989.
Xu, Q., Xue, M., and Droegemeier, K. K.: Numerical simulations of density currents in sheared environments within a vertically confined channel, 53, J. Atmos. Sci. 770–786, 1996.
Xue, M., Droegemeier, K. K., Wong, V., Shapiro A., and Brew-ster, K.: ARPS Version 4.0 User’s Guide, Available from Center for Analysis and Prediction of Storms, University of Oklahoma, Norman OK 73072, 380, 1995.
Xue, M., Droegemeier, K. K., and Wong, V.: The Advanced Re-gional Prediction System (ARPS): A multiscale nonhydrostatic atmospheric simulation and prediction tool, Part I: Model dy-namics and verification, Meteor. Atmos. Physics., 75, 161–193, 2000.
Xue, M., Droegemeier, K. K., Wong, V., Shapiro, A., Brewster, K., Carr, F., Weber, D., Liu, Y., and Wang, D.-H.: The Advanced Regional Prediction System (ARPS) – A multiscale nonhydro-static atmospheric simulation and prediction tool, Part II: Model physics and applications. Meteor. Atmos. Physics., 76, 134–165, 2001.
Xue, M., Wang, D.-H., Gao, J.-D., Brewster, K., and Droegemeier, K. K.: The Advanced Regional Prediction System (ARPS), storm-scale numerical weather prediction and data assimilation, Meteor. Atmos. Physics, 82, 139–170, 2003.


![Fig. 2. Horizontal cross section at 2 km. The shaded area represents qr+qh+qs [g/kg], isolines qc [g/kg] and arrows wind velocity [m/s]](https://thumb-eu.123doks.com/thumbv2/123doknet/14767042.588947/6.892.109.781.96.773/horizontal-cross-section-shaded-represents-isolines-arrows-velocity.webp)
![Fig. 3. Horizontal cross section at 247 m from the surface. The shaded area represents the convergence field, isolines the 0.01 g/kg threshold of qr+qh+qs [g/kg], dashed lines the cold pool (–1 ◦ K) and arrows wind velocity [m/s]](https://thumb-eu.123doks.com/thumbv2/123doknet/14767042.588947/7.892.103.792.92.720/horizontal-section-surface-represents-convergence-isolines-threshold-velocity.webp)
![Fig. 4. Horizontal cross section at 247 m from the surface. The shaded area represents the perturbation pressure field [hPa], isolines the 0.01 g/kg threshold of qr+qh+qs [g/kg], dashed lines the cold pool (–1 ◦ K) and arrows wind velocity [m/s]](https://thumb-eu.123doks.com/thumbv2/123doknet/14767042.588947/8.892.104.791.94.732/horizontal-section-represents-perturbation-pressure-isolines-threshold-velocity.webp)
![Fig. 5. Comparison between the SD and the 3-D-SD soundings. (A) the u wind component [m/s], (B) the v wind component [m/s], (C) the relative humidity (D)](https://thumb-eu.123doks.com/thumbv2/123doknet/14767042.588947/9.892.101.786.97.540/fig-comparison-soundings-wind-component-component-relative-humidity.webp)