PSFC/RR-04-3
Description of the TF Magnet
and FIRE-SCSS (FIRE-6)
Design Concept
Schultz, Joel H., Radovinsky, Alexi, and Titus, Peter October 27, 2004
Plasma Science and Fusion Center Massachusetts Institute of Technology
Cambridge, MA 02139 USA
From: Joel H. Schultz, AlexiRadovinsky, and Peter Titus
Subject: Description of the TF Magnet and FIRE SCSS (FIRE-6) Design Concept Date: October 27, 2004
PSFCRR: PSFC/RR-04-3
I. Introduction
The purpose of the FIRE SCSS (Fusion Ignition Research Experiment – Superconducting Steady-State) or FIRE-6 design is to provide an inexpensive improvement of the FIRE/NSO design that will greatly expand that machine’s capability to do long-pulse and steady-state experiments and make it more prototypical of DEMO and the ultimate ARIES-AT reactor concept. The purpose of this design is to demonstrate that this can be done with a negligible increase (or perhaps even a decrease) in the program cost. The strategy is as follows:
(1) The most advanced new superconductors are cabled into Rutherford cables and laid into slots in the FIRE TF plates. The same is also done in the CS and PF magnets.
(2) The thermal isolation of the magnets is improved to permit cooling to 4.2 K with the as-designed cooling circuits.
(3) The magnet structural design is retained to permit adiabatic warmup to peak temperatures of 373 K on every pulse.
In the past, superconducting tokamaks have been much more expensive than copper tokamaks with the same performance. We “solve” this problem with the following innovations:
(1) We take advantage of the revolution in Nb3Sn championed by the US HEP program and supplement it with a revised strand testing program in fusion. The HEP program has already produced conductors with Jcnoncu that is 4 x times higher than ITER HP-I with effective Jeff over the strand that is 6 times higher than ITER.
(2) For the first time, a superconducting coil design acknowledges the superior structural concepts of generations of normal coil designs, including and especially plates, adiabatic cooling, and
external structural clamping. We attempt to match the mechanical properties of the conductor and the surrounding plate to minimize the (very large) stress risers seen in CICC and pool-boiling magnets.
(3) We use new thermal isolation techniques, developed for LDX and the heavy ion beam inertial fusion program for compact, radiation-resistant isolation. These include the use of thin monocrystalline reflectors, with ultralow emissivities and outgassing. (Note to experts: the failure of the monocrystalline sheets to outperform MLI in these two experiments is irrelevant to FIRE-6, which uses them primarily to save valuable radial build and has much larger neutron-gamma loads.)
(4) We exploit the decision by FIRE/NSO to opt for wedging, instead of bucking/wedging. By using bucking/wedging, we can trade off the stress advantage vs. the modest stress risers from the conductor slots. We can more than repair the loss in conductivity from the slots by replacing BeCu with pure OFE copper and adding additional copper in the cables. The same applies to the CS coils. We also hope to regain the cost of the superconductor, refrigerator, and leads through savings in the power supplies and the avoidance of copper alloys.
(5) The cost of a helium refrigerator is minimized by operating in purely adiabatic mode for DT pulses, foregoing any claim to steady-state heat removal. This innovation, of course, has already been introduced at 30 K by IGNITOR.
Claim/Goals
The claimed goals of FIRE-6 and its’ superiority to other Burning Plasma experiments are the following: 1) Higher potential steady-state burn power than any tokamak being built. Higher than any designed,
other than ITER.
2) Double the flattop time of FIRE for most experiments
3) Test of steady-state heat removal capabilities of first-wall components, unavailable in FIRE, including erosion life
4) Capable with no exceptions of duplicating all FIRE experiments with a longer pulse 5) Under 1 % construction cost increase, possible decrease in overall program cost 6) Magnet/insulation life tests, unavailable in ITER
7) Use of most advanced Nb3Sn available, better than ITER
8) Elimination of transverse-stress degradation effects, much better than ITER 9) Use of advanced thermal isolation techniques, better than ITER
A. Description of Superconducting Winding
The TF Coil is supplemented by 10 slots in each of the 240 plates, carrying superconducting cable. There are 3 Rutherford cables in each slot, carrying current in parallel. Each cable contains 20 Nb3Sn strands, each with a diameter of 1.905 mm. The TF coil and superconductor parameters are described in Table I.
Table I: Description of TF Coil Parameters Parameter Units 10 T Ro (m) 2.14 Bt (T) (T) 10.00 wgroove (m) 0.0197 hgroove (m) 0.0114 nlayers,groovee 3 ngrooves,plate 10 nturns, TF 240 Ro, TF (m) 1.296 Ri, TF (m) 0.8372 Fill factor 0.85 Dstrand (mm) 1.905 nstrands,cable 20 Bmax,TF,nom (T) 16.51 Bmax,TF,sc (T) 17.34 Top (K) 4.20 Fill factor 0.758 1/cos theta 1.04 Copper/Noncopper () 1.20 NI (MAT) 107 Iplate (kA) 445.8 Icond (kA) 44.58 Jcu (A/mm2) 478 Jnoncu (A/mm2) 574
Acu,plate (no grooves) (m2) 0.01281
Agrooves, plate (m2) 0.00226
Acu,plate (w grooves) (m2) 0.01056
Acu,plate (cables) (mm2) 933
Jcu, plate incl (A/mm2) 38.81
C0 (A-T/mm2) 40000 Bc20m (T) 28 Tc0m (K) 18 epsilon -0.003 Jc,noncu(12 T,4.2 K) (A/mm 2) 2600 Jc(B,T,eps) (A/mm2) 574 fc 1.047 Tc(B,eps) (K) 6.7 Tcs (K) 4.2 ∆T (K) 0.0
Using the superconductor characterization in Table I, the critical current is calculated at each field on the load-line out to 10 T. It is seen that, when Bt = 10 T, the superconductor at 4.2 K has no temperature
margin to the critical current (although recent studies by Martovetsky1 and Egorov for ITER have shown that there will probably be an additional margin in advanced Nb3Sn cable of > 0.5 K above the nominal definition of current-sharing temperature at 10 µV/m and the actual temperature of thermal runaway) However, at 9 T, the fraction of critical is only 0.533 and the temperature margin is 1.6 K, both comparable to the ITER-EDA and TPX allowable margins, and considerably higher than the present ITER CS design temperature margin of 0.4-0.7 K.
fc,Nb3Sn (4.2 K) vs. Bt (T)
0.0 0.2 0.4 0.6 0.8 1.0 1.2 0 2 4 6 8 10 12 Bt (T) fc,Nb3SnFigure 1: fc (Nb3Sn) vs. Bt (T), TF coil , assuming –0.3 % strain an 4.2 K
At Bt=10 T, Bmax,TF=17.3 T, an advance of 44 % over the 12 T TF in ITER. The value of IpA/R would, of course, be the same as that of FIRE/NSO. The compactness of this superconducting experiment can be compared to that of other copper and superconducting machines in Table A.1. (We normalize IpA/R my multiplying by the permeability of free space, so that all tokamaks are rated according to an
equivalent flux density. Our claim is, and has been, that this is far more relevant to ranking the compactness of a tokamak design than the toroidal magnet flux density2.)
Table A.1
Tokamak Bmax,TF Bt Ip A Ro µoIpA/R Compactness Ratio
(T) (T) (MA) (m) (T) FIRE-6 16.5 9.5 7.7 3.6 2.14 16.28 1 FIRE* 16.5 10 7.7 3.6 2.14 16.28 1 ITER 11.8 (13 CS) 5.3 15 3.1 6.2 9.42 1.73 Alcator C-Mod 8.1 1.5 3.35 0.67 9.42 1.73
1 N. Martovetsky, “Stability and thermal equilibrium in ITER CICC at small disturbances,” April 5, 2004; Draft ITER Document
2 NSO No 99_03_25_WBS11_ Scaling of NSO/FIRE from Alcator C-Mod_JHS.doc, Joel H. Schultz, “Scaling of NSO/FIRE from Alcator C-Mod,”March 24, 1999
KSTAR 7.4 3.5 2.0 3.6 1.8 5.03 3.24
Triam-1M 11 8 0.5 7 0.84 5.2 3.08
Tore Supra 9.0 4.5 1.8 3.21 2.25 3.23 5.05
T-15 8.3 3.5 1.4 3.47 2.43 2.51 6.49
JT60-SU 6.25 5 3.57 5.0 4.48 3.63
FIRE-6, by definition, equals the compactness of the next-step FIRE design, and is 1.73 times as
compact as the achieved IpA/R of Alcator C-Mod (and slightly less than the original design value.) It is also 1.73 times as compact as ITER-FEAT, 3.24 times as compact as KSTAR (the most compact
superconducting tokamak being built), and 5.05 times as compact as Tore Supra (the most compact superconducting tokamak ever operated).
DeltaT (K) vs. Bt (T), Top=4.2 K
-2 0 2 4 6 8 10 12 140
2
4
6
8
10
Bt (T)
Temperature Margin (K
)
Figure 2: ∆T (K) vs. Bt (T), TF coil, assuming –0.3 % strain at 4.2 K
It may be recalled that a previous inertially-cooled TF design3, based on CICC and light shielding, was able to withstand 100 s of peak fusion power before quenching. It would be desirable to do something similar with FIRE-6, but it isn’t possible, because:
(1) The conductors are dry. Despite the higher current-sharing temperatures at low field, they still have 1-2 orders of magnitude less available enthalpy than a CICC conductor. (However, the possibility of increasing the burn time by using higher-temperature superconductor, such as BSCCO-2212, has not yet been investigated.)
(2) The wall-loading of FIRE is four times higher than ATBX
(3) ATBX had the same x-300 attenuation shielding to protect the vacuum vessel weld as ITER-EDA did, but FIRE does not.
Therefore, the quench of the superconductor in FIRE-6 due to DT-burn can be considered nearly instantaneous down to very low field.
3 ATBX-MIT-JHSchultz-051998-01, Joel H. Schultz and Tom Brown, "ATBX Design Description Document, Rev. 0," May 19, 1998
Nevertheless, the flattop time at every field is higher than that in FIRE because: (1) No TF J2t allowance is lost during TF coil rampup.
(2) The TF coil uses pure copper, instead of BeCu, which has double the J2t allowable of BeCu.
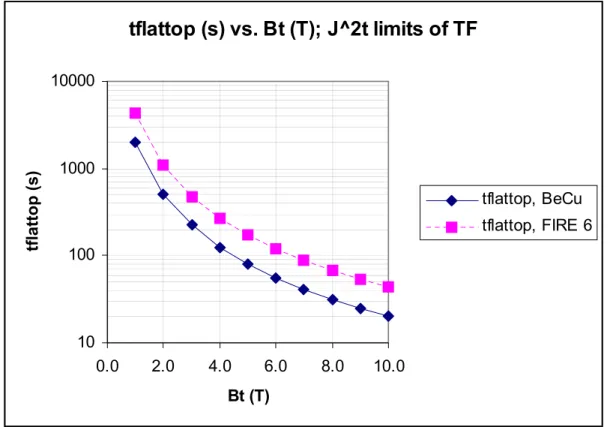
Therefore, we assume that, as soon as the auxiliary heating power is turned on, the coils quench and that the longest allowable pulses are determined by J2t plus neutron heating limits on peak temperature, as before. The estimated flattop times vs. Bt(T) are shown in Figure 3.
tflattop (s) vs. Bt (T); J^2t limits of TF
10 100 1000 10000 0.0 2.0 4.0 6.0 8.0 10.0 Bt (T) tflattop (s) tflattop, BeCu tflattop, FIRE 6Figure 3: Estimated allowable flattop time, TF (s) vs. Bt (T), based on J2t limits
The flattop time is approximately doubled over the entire field range of any interest (1<Bt<10 T). This permits the FIRE mission claim that tflattop > 2 τJ to be true at the highest Q performance at every field, instead of merely approximately true.
B. TF Plates Structural Performance
The concept used to approximate the structural performance of FIRE is as follows:
A compacted, uninsulated, high copper-fraction Rutherford cable is soldered into slots of the TF plates. The cable is designed to approximate the strength and stiffness of the copper plate as closely as possible to minimize stress risers under bending load.
FIRE selected a wedged design, since bucking-wedging was unnecessary to fill the FIRE mission at Ro=2.14 m and Bt=10 T and it was felt that wedging was lower risk. At MIT, while acknowledging that bucked-wedged designs certainly lack a high-performance “existence proof,” that they are now
sufficiently well understood, particularly through their extensive analysis and scale model tests in the IGNITOR program, that the risk is acceptable. At MIT, we also feel that the fundamental tolerancing
requirements of the bucked-wedged design are no more severe than those of the FIRE/NSO wedged design. Therefore, the theoretical and, we believe, practical reductions in TF inner leg stress due to bucking more than compensate for any stress risers in the cable-filled slots.
In fact, the stress reduction due to the use of bucking and wedging has the same implications as it did in the original design tradeoff. It is possible to eliminate beryllium copper from the design and replace it with OFHC copper. This reduces the cost of power supplies, as well as the material cost of the TF inner leg. It also eliminates the cost of an R&D program to develop the BeCu-copper braze joints. Finally, the pulse lengths are increased, since the hot spot was in the beryllium copper. As was shown above, at almost every field, the pulse length in FIRE-6 is doubled over that in FIRE/NSO, because of the
combination of lower resistivity and steady-state TF current before plasma.
B.1 Model
A simple wedge model representing the central column equatorial plane was used to show that there is little degradation of structural performance with a solder filled superconductor in a pocket vs. a solid copper plate. The vertical tension stress on the inner TF leg was applied with displacement constraints. The bucked and wedged model included a representation of the Central Solenoid (CS), but not a bucking cylinder. The evaluation is being done assuming the bucked and wedged arrangement, and includes a representation of the Central Solenoid (CS). A single turn of the 240 turn array was modeled. The superconductor, solder, copper plate, insulator, and cooling hole are discretely modeled. Smeared properties are used for the CS. Each of the ten pockets that contain the conductor are 1.973 cm by 1.143cm. The conductor is modeled as copper and is 1.816 by 0.9206 cm, and the space in-between is solder. This yields a solder to copper ratio of 0.337, so that solder is 25% of the pocket. The analysis is based on FIRE at Ro=2.14m, and 10T.
Figure A.2 Finite Element Model of TF turn with 10 Superconducting Cable Slots
Stresses
The model was run with copper properties used for the composite superconducting cable with the solder modeled either with soft solder or copper properties. This should bound the problem with stresses that are either conservative or aggressive. The calculated stresses are listed in Table A.1:
Table A.1 Maximum Von Mises Stress in Plate, using Soft Solder and Copper Solder Solder Model Max VonMises at
Nose/Allowable
Average VM at first full inner ligament/Allowable
Soft Solder 318 (600) 243 (300)
Copper Solder 311 (600) 253 (300)
with lead-tin solder properties with copper properties
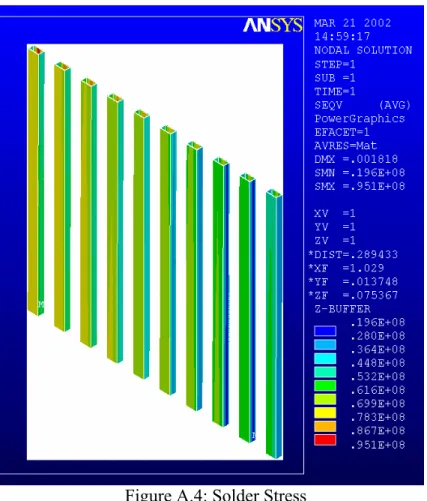
Figure A.4: Solder Stress
The average values in the first full inner ligament reported in the table above were read from contour plots, but the difference is not significant. Highly cold worked copper has a yield of 350 MPa at lN2 temperatures, and 300 MPa at room temperature. The maximum stress at the nose should be considered a peak stress, with the ligament stress compared with the bending allowable or yield. Therefore, the ligament stresses are at about 80 % of the allowable values, and are essentially the same as those in the FIRE* bucked/wedged design, reported previously4, without the addition of superconducting cable. The local peak stress of 318 MPa can be compared to a local peak allowable of ~ 3 Sm = 600 MPa, so it is less constricting.
This analysis is elastic, and the solder should not yield for this analysis to be representative. The elastic stresses in the solder are low (95MPa) but probably not below the solder yield. However, comparing the solder stress with the copper stress, it is evident that the contained solder is well-confined, approaching a hydrostatic stress state.
Strains:
4 FIRE-MIT-PTitus-12.18.98-01, Peter Titus, "FIRE TF Trade Studies: Wedged vs. Bucked&Wedge, BeCu vs. CuSteel, Torsional Shear vs. Shear,” Dec 18, 1998
The Nb3Sn strands are cabled, reacted, then transferred to the plates. The reaction that forms the Nb3Sn is down on a plate with loose slots. The reaction strain on the Nb3Sn, cooling down from the reaction temperature to room temperature is then only that which is imposed by the copper and bronze in the cable itself, and is limited by yield in the bronze or copper. The cable is then soldered into the plate. The global temperature of the plate is minimized by using a very localized eddy current heater, similar to that used to solder C-Mod's feltmetal. To calculate strain, we assume that the effective temperature at which the global structure is added is 400K.
Assuming yield occurs, the Nb3Sn stress is:
Sigma Nb3Sn = Area bronze*Yield of Bronze/Area of Nb3Sn
Bronze yields at 8.7 ksi (60 MPa), and the modulus of Nb3Sn is 165 GPa, so the reaction strain is compressive (copper and bronze shrink more than Nb3Sn) and is –1.5 x 60/165000=- .000545, since the copper/noncopper ratio of 1.5:1.
Contraction strains for various materials Nb3Sn is blue and copper is red the difference at 4K is about .001 compression (copper shrinks more than Nb3Sn)
The total is -.001545 compressive strain, unloaded at 4K. The structural strains will be superimposed on this.
The superconductor strand is solder filled and nearly strain compatible with the copper plate.- There is some relief in the transverse strain due to the lower solder modulus.
Table A.2: Strain in theTF Superconductor: CS and Plasma Side
CS side Plasma side
4K Vertical strain -.001545 -.001545
Vertical Tensile strain 130/133000=.000977 150/133000 = .001127
Total strain at full field -.000387 -.000237
Transverse Compressive strain -120/133000=-.0009022 -85/133000=-.000639
The calculated thermal contraction strain is axial in the strand. The reaction strain may not be additive to the transverse strain, again because of the hydrostatic support condition, so the total calculated strain in the superconductor is only 0.02 %. The cable is solder filled and the strand is supported against local Lorentz loads. This should be the major source of bending strain in CICC, but not in the solder filled cable. If helium were needed for better cooling, near the cable, it would probably be possible to solder in a BeCu tube with the cable.
It should be noted that the analysis of critical current in Section A assumed that the strain in the
superconductor was –0.35 %, simply on the grounds that it has been historically very difficult to achieve the effective strains as low as –0.15 %. The above analysis is very encouraging that it is not necessary to use expensive, good COE match materials, such as Incoloy 908 or titanium. However, conservative assumptions are still used for design, because “Bitter plate Nb3Sn TF coils” are such a new approach.
C. The D-D Steady-State Experiment
The unique mission that can be done by FIRE-SCSS is the true steady-state experiment. Of course, without any neutron-gamma shielding, this cannot be done at anywhere near full D-T power. Like TPX or KSTAR, the steady-state experiment would be a D-D burn. The question to be addressed here is how powerful a D-D burning plasma can be accommodated. At 17 T, the TF coil has no margin, so there will be a continuous tradeoff and an optimum field. At lower fields there will be less capability, as defined by beta-limits, while at higher fields there will be a lower temperature margin in the TF coils. We show here that a steady-state D-D burn by can be accomplished by FIRE-6, that will be significantly more powerful than those possible in TPX or KSTAR.
C.1 Nuclear Heating
The steady-state experiment is assumed to be limited by neutron-gamma heating alone. In all the
operating regimes of interest, nuclear heating will be much larger than radiation and gravity loads on the TF inner leg.
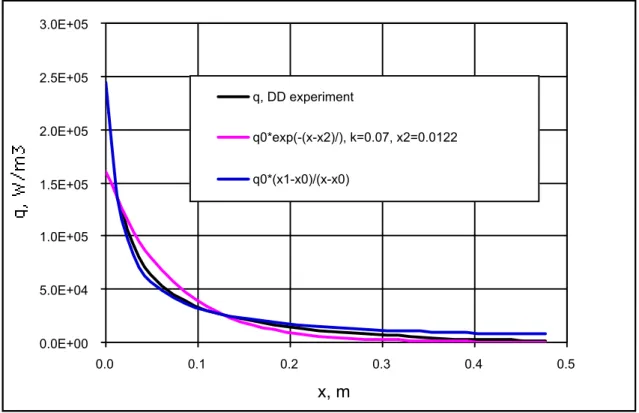
Sawan has provided nuclear heating profiles for a 1 MW D-D burn in FIRE/NSO5 as shown in Figure C.1. As shown in the figure, a simple e-folding distance of 7 cm is the best match to an equation with exponential decline of heating power, but only gives a mediocre correspondence to the actual heating profile in the important first layer. A different correlation was chosen for analysis, as shown in the figure, where q0=0.135 x 10⁶/reduction factor (W/m3), x1=0.0122 m. and x0=-0.015 m, and x is the distance from the cooled outer surface of the inner leg of the TF coil (m). Note that q0 contains a
multiplier, reduction, in the denominator. It is used as an indicator of how many times the nominal heating should be reduced to produce results acceptable from the design standpoint.
The design problem is immediately obvious. The potential D-D power from FIRE/NSO is 1 MW of fusion power, which is 20 times higher than the design value for TPX and 50 times higher than KSTAR6. FIRE, however, is no better shielded than the other superconducting experiments. The very power of the FIRE plasma may pose an insuperable problem. The peak D-D powers of the three steady-state experiments are listed in Table C-I.
Table C-I: Peak D-D Power and Nuclear Heating of TF Coil (kW): FIRE-6, TPX, KSTAR
Nuclear Power Units TPX KSTAR FIRE-6
D-D Plasma (kW) 45 20.9 1,000
Nuclear Heating of TF Cold Mass (kW) 10.65 11.7 459
The problem is that, even if it were possible to remove 459 kW without exceeding the current-sharing temperature of Nb3Sn at 17 T (which it isn’t), the cost of a 460 kW helium refrigerator would be prohibitive. We estimate that a 50 kW refrigerator would cost under $30 M and allow 109 kW of D-D power, so we begin by searching for a solution that is somewhere in this range.
0.0E+00 5.0E+04 1.0E+05 1.5E+05 2.0E+05 2.5E+05 3.0E+05 0.0 0.1 0.2 0.3 0.4 0.5 x, m q, DD experiment q0*exp(-(x-x2)/), k=0.07, x2=0.0122 q0*(x1-x0)/(x-x0)
Fig. C.1 Nuclear Heating for DD pulses. Experiment, and two curve fits.
6 KSTAR-USMIT-JHSchultz-82599-01. KSTAR Design Description Document WBS 13 & 14 Superconducting Magnet Systems(TF and PF),” August 25, 1999
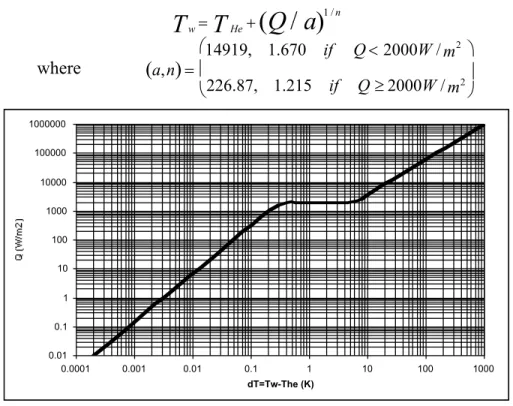
The cooled wall temperature Tw is defined as a function of heat transfer into helium. In the steady state heat transfer must be equal to the integral heat deposition, Q, in the wall. Figure A2.1 shows a standard curve of Q vs. dT=Tw-The. (where The, the temperature of the two-phase helium = 4.5 K).
The following curve fit was used in the analyses for the wall temperature Tw. w
T
=T
He+(Q / a)
1 / n where( )
a,n = 14919, 1.670 if Q< 2000W / 2 m 226.87, 1.215 if Q≥ 2000W /m2 0.01 0.1 1 10 100 1000 10000 100000 1000000 0.0001 0.001 0.01 0.1 1 10 100 1000 dT=Tw-The (K)Fig. C.2 Heat Transfer into He
The steady-state temperature distribution in the inner leg of the copper TF coil of the FIRE-6 tokamak due to the nuclear heating was calculated, using Mathematica7. The analyses quantify the reduction from peak D-D heating required at each operating flux density to keep the temperature in the TF coil below current-sharing, assuming that the available area for cooling is the straight-leg cylinder on the plasma side of the inner leg.
The 1D Cartesian model is different from the real topology in the sense that the inner leg of the TF coil is more like a cylinder. The power deposition in the cylindrical space was calculated by integrating (A1.1) in cylindrical coordinates (x=Rout-r) from Rin= 0.88 m to Rout = 1.38 m for an H=4.08 m high cylinder. The result (at reduction=1) was total heat deposition of 0.417 MW (vs. 0.459 MW in the Cartesian model). It means that the used model is 10% more conservative than a similar model in cylindrical coordinates.
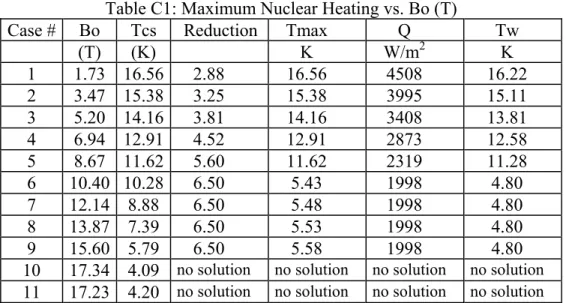
The summary of the results is given in Table 1. For each particular case (column 1) characterized by the peak field, Bo (2), and respective current sharing temperature, Tcs (3) it shows by what minimum factor (4) the maximum possible nuclear heating of 1 MW should be reduced so that the maximum
temperature, Tmax (5), in the inner leg of the TF coil will not exceed Tcs. Q is the heat flux removed
through the cooled outer surface of the inner TF leg (W/m2), while Tw is the temperature of the cooled side of the inner TF leg (K).
Table C1: Maximum Nuclear Heating vs. Bo (T)
Case # Bo Tcs Reduction Tmax Q Tw
(T) (K) K W/m2 K 1 1.73 16.56 2.88 16.56 4508 16.22 2 3.47 15.38 3.25 15.38 3995 15.11 3 5.20 14.16 3.81 14.16 3408 13.81 4 6.94 12.91 4.52 12.91 2873 12.58 5 8.67 11.62 5.60 11.62 2319 11.28 6 10.40 10.28 6.50 5.43 1998 4.80 7 12.14 8.88 6.50 5.48 1998 4.80 8 13.87 7.39 6.50 5.53 1998 4.80 9 15.60 5.79 6.50 5.58 1998 4.80
10 17.34 4.09 no solution no solution no solution no solution 11 17.23 4.20 no solution no solution no solution no solution
Figures in Table 2 show the distribution of the temperature, and of the heat flux through the cooled surface as a function of the coordinate, X. (X=0 corresponds to the cooled surface, X=th=0.5 m corresponds to the adiabatic surface.)
T (K) vs. X (m) - through TF coil 4.5 kW/m2
Heat Flux, Kcu*dT/dX (W/m2), vs. X (m) - through TF coil
4.5 kW/m2
2 kW/m2 through TF coil 2 kW/m2
Figure C.3: Temperature (K) and Heat Flux (W/m2) through the TF Coil at 4.5 kW/m2 and 2.0 kW/m2 at outside radius of TF inner leg
The total heat flux for the total nuclear heating (reduction=1) calculated for this model is Q(D-D = 1 MW) = 12.98 kW/m2, corresponding to 0.459 MW deposited in the TF cold structure.
The ability to remove D-D heat at different field and corresponding current can be limited by the wall-loading, but may also be limited by either Troyon beta or Greenwald density limits. At this point, the FIRESALE spreadsheet has not been upgraded to include D-D, so we don’t know which is more
limiting. If we take the more conservative (in the sense that the falloff is more rapid, making it harder to do high fusion power pulses at low field) assumption that the plasma is beta limited, then the peak D-D power will fall off as B-4. (Greenwald is approximately B-2, but can compensate more easily than beta limits by operating at higher temperature.) The peak D-D power and the removable power are compared in Figure C.4 .
D-D Fusion Power (kW) vs. Bt (T), constrained by Beta and Heat Removal (kW)
0 100 200 300 400 500 600 700 800 900 1000 0 2 4 6 8 10 Bt (T) Pf (kW) Qcold,max (kW) Pf (Qmax) Pf (beta)
Figure C.4: Achievable D-D Fusion Power (kW) vs. Bt (T), qlim=3.1, as constrained by bTroyon and Two-Phase Helium Heat Removal (kW)
Qcold,max(kW) is the maximum heat that can be removed from the TF cold mass, while Pf(Qmax) is the
D-D fusion power, corresponding to Qcold,max(kW). Pf (beta) is the maximum fusion power that can be generated, scaled from 1 MW (D-D) at 10 T and 7.7 MA. Over most of the range of interest (6-9.5 T), the heat removal limit is clamped by 2,000 W/m2 at the transition between nucleate and film boiling. In the nucleate cooling regime, the fusion power is already dominated by beta limits, so that the total fusion power that is physically allowable in a D-D experiment is essentially clamped at 154 kW (about 4 times higher than the TPX limit). This corresponds to a refrigeration requirement of 66 kW. In the first iteration, we have only called for a 50 kW refrigerator, so that 66 kW would be an upgrade.
Figure C.4 has other implications including the following. Below Bt=6.2 T or Ip=4.8 MA, there are no TF engineering restrictions for heat removal in a steady-state D-D experiment. This doesn’t mean that experiments can’t be done, say, at 9 T and 7 MA. Only that the D-D power from these experiments has to be attenuated from the maximum possible by a factor of 4, most easily by operating at a suboptimal density and temperature. Another design possibility is to add a factor of 4 shielding, working backwards into the plasma towards the original A=3.8 design. This is obviously a more drastic step, since it has a second-order effect on D-T performance, but is a reminder that the FIRE-6 design has not been optimized for its dual mission. Finally, it shouldn’t be forgotten that FIRE-6 can also do steady-state burns in D-He3, where full performance can probably be extended up to ~ Bt=8.5-9 T and Ip=6.5-7 T. The attenuation from full performance needed at every plasma current in order to satisfy two-phase helium heat removal is shown in Figure C.5:
Attenuation Needed for Heat Removal vs. Ip (MA)
0 1 2 3 4 5 1 2 3 4 5 6 7 Ip (MA) Attenuation
Figure C.5: Attenuation needed for full-scale D-D experiment:
(Maximum physics-limited fusion power/Power removable from TF coil) vs. Ip (MA)
D. Cost
Costing parameters, used to cost the coils and power supplies are listed in Table II, along with the cost differences between FIRE-6 and FIRE/NSO.
Table II: Costing Parameters and Cost Differences
Parameter Units Value
Lturn (m) 11.86 Vsuperconduc,TF (m3) 4.93E-01 fwastage 0.2 M$, BeCu to Cu (M$) -11.5 Msc,TF (tonnes) 46.7 Msc,purchase (tonnes) 56.1 $/kg, Nb3Sn ($/kg) 500 M$, Nb3Sn strand, TF (M$) 28.04 M$, Nb3Sn strand, PF (M$) 1.25 $/kA-lead ($/kA) 5000 kA-lead, TF VCL (kA) 891.7 M$, VCL's TF (M$) 4.46 kA-lead, PF VCL’s (kA) 864 M$, VCL’s PF (M$) 4.32 Liquefier, TF VCL’s (kl/hr) 1.25 Liquefier, PF VCL’s (kl/hr) 1.21 M$, VCL liquefier (M$) 7.4 M$, Helium refrigerator (M$) 29.2 ∆cost, Power Supplies (M$) -36.2
∆cost, lN2 Subcooler (M$) -1.0 ∆cost, M$ (running total) (M$) 26.4 Operating Costs Nitrogen Supply8 (M$) -163 Cost Electricity (M$) 69.3 ∆cost, operating (M$) -93.7
The cost comparison between FIRE/NSO and FIRE-6 is partial and tentative, but some attempt has been made to include the most significant factors. No credit was taken for any decrease in PF power supply ratings, which may be second-order or balanced by high reactive power normal coils. The usual disadvantage of superconducting coils of requiring an independent dump circuit doesn’t apply here, since the active power supplies are capable of restricting I2t in any mode of operation. The cost of superconductor, the TF 446 kA vapor-cooled leads and their associated liquefaction requirements are included and are less than the savings in the TF power supply. The single largest new component is the helium refrigerator needed for the D-D steady-state experiment. This could be treated wholly or partially as an upgrade to reduce the cost of initial fabrication, in which case FIRE-6 would be less expensive than FIRE/NSO. Fully counting the helium refrigerator, FIRE-6 costs $11.7 M more than FIRE/NSO. Because of the savings in liquid nitrogen requirements, the savings in operating cost are
8 NSO No WBS7_121401_UpdateCryoRefrigSizeCostFIRE*.doc, Joel H. Schultz, “Update of Cryogenic Refrigerator Sizing and Costing for FIRE* 2.14 m Reference Machine,” December 14, 2001
$93.7 M. It is assumed, but not yet demonstrated, that a 50 kW helium refrigerator with a 500 kA liquefier will be able to cool down the TF coils to 80 K for nonsuperconducting pulses without the use of externally-supplied liquid nitrogen. Preliminary estimates are that the helium refrigerator is about the right size to guarantee cooldown to 80 K in 3 hours. Since there are only 3,000 full-power pulses, any shortfall that has to be supplemented by the supply of liquid nitrogen for those pulses would only have a second-order impact on the large savings in nitrogen cost. We have taken no credit for smaller nitrogen storage tanks, so nitrogen could be supplied at a much smaller rate to be used as needed from the “oversized” tanks. The two cost savings terms are in the power supply and the TF plates. The savings of $36.2 M in the power supplies is based on Neumeyer’s estimate of power supply savings, using copper instead of BeCu and the savings in the TF plates is based on a difference of 10:1 between BeCu and Cu costs ($17.57/lb vs. $1.75/lb).
E. Conclusions
A new method using superconductor has been described that takes advantage of advanced structural concepts used in copper plate magnets. The structural efficiency, as measured by the goodness factor IA/R is nearly twice as good as ITER-FEAT (exactly twice in the original 2.0 m FIRE) and equal to that of FIRE/NSO.
Adopting the FIRE/NSO geometry, it is possible to build a dual mission machine that can achieve 100 % of FIRE performance, increase the pulse length of FIRE significantly, and add an entirely new set of steady-state and bootstrap current-drive experiments in deuterium. It is proposed that this dual-purpose machine could be the flagship experiment for the United States over a fifteen year experimental period.
The additional cost of this second mission is negligible, balancing increased costs of superconductor and cryogenic refrigeration against savings in power supplies. When operating costs are included, the total program cost of FIRE-6 is less than that of FIRE/NSO.
The superiority of FIRE-6 over other burning plasma options, both as a physics and as an engineering experiment is summarized in Table E.1.
Table E.1 Superior Features of FIRE-6
Over FIRE Over ITER
Physics D-D Steady State 2 x tflattop
Long-time bootstrap
Higher fusion power density Higher plasma density Higher normalized tflattop Engineering Advanced superconducting magnets
Wall erosion
Single-shot conditioning PFC life tests
More advanced superconductor, thermal isolation TF magnet, insulation, sc life tests
Appendix A: State-of-the-Art Superconductor Performance
The curve below is copied from the University of Wisconsin Web site on state-of-the-art superconductor current density measurements, updated in Dec. 2002. Because of the high-energy physics program to develop 3,000 A/mm2 (12 T, 4.2 K) conductor with Deff < 40 µm, present-day conductor should be even better. However, these curves show that PIT and Nb3Al strands had already been measured with Jc > 500 A/mm2 at 17 T and that an internal tin strand with Jc=1200 A/mm2 at 16 T should extrapolate to even better performance. The curves also show the potential for BSCCO-2212 to improve the temperature margin and burn time of the FIRE-SCSS concept significantly, if it can be shown that cost and mechanical properties are adequate. The FIRE-SCSS design would have to back off from the highest Jc conductor, in order to avoid excessive flux-jumping and hysteresis losses. However, since the high Jc conductor is only used in the steady-state TF coils and only needs “guaranteed performance” for the long-pulse and steady-state experiments, the hysteresis losses should be noncritical. (News flash: the latest internal tin from Oxford achieves 3,000 A/mm2 with a Deff of only 60 µm9.)
Figure A.1: State-of-the-art superconductor performance, compiled Dec 2002