HAL Id: hal-02953881
https://hal.sorbonne-universite.fr/hal-02953881
Submitted on 30 Sep 2020
HAL is a multi-disciplinary open access
archive for the deposit and dissemination of
sci-entific research documents, whether they are
pub-lished or not. The documents may come from
teaching and research institutions in France or
abroad, or from public or private research centers.
L’archive ouverte pluridisciplinaire HAL, est
destinée au dépôt et à la diffusion de documents
scientifiques de niveau recherche, publiés ou non,
émanant des établissements d’enseignement et de
recherche français ou étrangers, des laboratoires
publics ou privés.
head-to-head comparison between phase-contrast MRI
and Doppler echocardiography
Nadjia Kachenoura, Emilie Bollache, Gilles Soulat, Stéphanie
Clément-Guinaudeau, Golmehr Ashrafpoor, Ludivine Perdrix, Benoit Diebold,
Magalie Ladouceur, Elie Mousseaux
To cite this version:
Nadjia Kachenoura, Emilie Bollache, Gilles Soulat, Stéphanie Clément-Guinaudeau, Golmehr
Ashraf-poor, et al..
Right ventricular diastolic function in aging: a head-to-head comparison between
phase-contrast MRI and Doppler echocardiography. International Journal of Cardiovascular
Imag-ing, Springer Verlag, In press, �10.1007/s10554-020-02040-y�. �hal-02953881�
Right Ventricular Diastolic Function in Aging: A Head-to-head Comparison between Phase-Contrast MRI and Doppler Echocardiography
Nadjia Kachenoura1*, PhD, Emilie Bollache1*, PhD, Gilles Soulat2,3, MD PhD
Stéphanie Clément-Guinaudeau3, MSc MD, Golmehr Ashrafpoor1,3, MD,
Ludivine Perdrix3, MD, Benoit Diebold1,2, MD PhD,
Magalie Ladouceur2,3, MD PhD, Elie Mousseaux2,3, MD PhD
*These authors have equally contributed
1Sorbonne Université, CNRS, INSERM, Laboratoire d’Imagerie Biomédicale, LIB, 75006 Paris, France
2Université de Paris, PARCC, INSERM, 75015 Paris, France
3Assistance Publique Hôpitaux de Paris, Hôpital Européen Georges Pompidou, 75015 Paris, France
Corresponding Author
Nadjia Kachenoura
Laboratoire d’Imagerie Biomédicale, INSERM, CNRS, Sorbonne Université 15 Rue de l’école de médecine, 75006 Paris, France; [email protected] Phone: +33 144279116
Abstract
Purpose. To evaluate right ventricle (RV) diastolic function from phase-contrast MRI (PC-MRI) in aging. Methods. 89 healthy individuals (50 men, 43±15 years) underwent cardiac MRI including 2D PC-MRI (1.5T)
and reference Doppler echocardiography of both ventricles on the same day. Conventional echocardiographic parameters were estimated: early (E, cm/s) and atrial (A) peak velocities as well as myocardial early peak longitudinal velocity (E’). PC-MRI images were analyzed using custom software, providing: E’, E and A waves along with respective peak flow rates (Ef, Af, mL/s) and filling volume (mL), for both ventricles. Intra- and inter-observer reproducibility was studied in 30 subjects and coefficients of variation (CoV) as well as intra-class correlation coefficients (ICC) were provided.
Results. RV diastolic function indices derived from PC-MRI data were reproducible (CoV≤21%, ICC≥0.75)
and reliable as reflected by significant associations with left ventricular diastolic function indices assessed using both echocardiography (linear regression Pearson correlation coefficient r≤0.59) and PC-MRI (r≤71). Despite the fair associations between RV echocardiography and PC-MRI (r≤0.25), the highest correlation with age was obtained for MRI Ef/Af ratio (r=-0.64, p<0.0001 vs. r=-0.40, p=0.0001 for echocardiographic E/A). Among PC-MRI E/A ratios, highest correlations with age were observed for flow rate and mean velocity ratios (r=-0.61, p<0.0001) as compared to maximal velocity ratios (r=-0.56, p<0.0001). Associations with age for E’ were equivalent between PC-MRI (mean velocity: r=-0.40, p<0.0001; maximal velocity: r=-0.36, p=0.0005) and echocardiography (r=-0.36, p=0.0006). Finally, the significant and age-independent associations between RV mass/end-diastolic volume and E’ were stronger for PC-MRI (mean velocity: r=-0.36, p=0.0006; maximal velocity: r=-0.28, p=0.007) than echocardiography (r=-0.09, p=0.38).
Conclusion. PC-MRI tricuspid inflow and annulus myocardial velocity parameters were reproducible and able
to characterize age-related variations in RV diastolic function.
Keywords: phase-contrast MRI; right ventricle; diastolic function; aging
Declarations
Introduction
Right ventricular (RV) dysfunction has been widely associated with increased mortality in patients with congenital heart disease, heart failure, pulmonary hypertension and coronary artery disease [1]. Although the in-depth exploration of the left ventricular (LV) morphology and function using imaging techniques is now commonly performed, the RV has remained the forgotten ventricle for a long time. This might be due to its anatomical location and orientation, its complex shape and geometry as well as its multiple trabeculae. Similar to LV, RV diastolic dysfunction precedes the decrease in ejection fraction and systolic dysfunction. Accordingly, the early and robust detection and quantification of diastolic dysfunction are crucial for optimal patient management. In clinical routine, the evaluation of LV and RV diastolic function is achieved using Doppler echocardiography [2]. For both chambers, several diastolic parameters are conventionally measured: peak velocities of the early (E) and late (A) filling inflow, annular early longitudinal peak velocity (E’), as well as the associated E/A and E/E’ ratios. MRI cine images are commonly used for the evaluation of both LV and RV volumes, myocardial mass and systolic function. Attempts to evaluate RV diastolic function have been achieved while evaluating RV volumes variations throughout the cardiac cycle [3]. In addition, while cine MRI has been recently proposed to assess RV strain using feature tracking techniques [4], again such evaluation in the RV remains less common than in the LV or left atrium [5]. Furthermore, despite the excellent anatomical coverage provided by MRI, measurements of the above-mentioned morphological and functional quantitative indices were shown to be less reproducible on the RV than the LV [6, 7].
Phase-contrast MRI (PC-MRI) has been successfully used for the evaluation of LV diastolic function, revealing high agreement with Doppler echocardiography as well as ability of MRI measures to detect diastolic dysfunction with a high reliability [8–19]. We hypothesise that velocity imaging through the tricuspid valve as well as at the RV basal slice along with a shape-independent segmentation technique would help for the assessment of RV diastolic function. Accordingly, we first adapted a software that was previously designed for LV diastolic function quantification [14], to the evaluation of tricuspid flow patterns and tricuspid annulus longitudinal motion from PC-MRI data, while evaluating the intra- and inter-observer reproducibility of the derived RV diastolic function measurements.. We also performed a head-to-head comparison of PC-MRI RV diastolic function indices against those estimated using the reference Doppler echocardiography performed on the same day in healthy volunteers. Finally, physiological associations with age and RV mass to end-diastolic volume ratio were studied, and we further tested the reliability of PC-MRI-derived indices of RV diastolic function through their associations with echocardiographic and PC-MRI indices of LV diastolic function while assuming an interrelated biventricular
aging.
Materials and Methods
Study population and data acquisition
A group of 100 healthy volunteers (58 men, 42±15 years) who had Doppler echocardiography and MRI exams on the same day for the evaluation of LV and RV function, was included. All subjects were asymptomatic and free of overt cardiovascular disease defined as a clinical history of hypertension, diabetes mellitus, dyslipidaemia, renal disease, known inflammatory conditions, and malignancy. The study protocol was approved by the institutional review board and informed consent was obtained from all participants.
Doppler echocardiography was performed by a 15-year experienced echocardiographer using a GEMS Vivid 7 system (GE Healthcare, Chicago, IL, USA). Both transmitral and tricuspid early filling and late atrial filling (E and A, respectively) peak velocities as well as LV mitral and RV tricuspid annular early peak longitudinal velocities (E’) were measured.
MRI was performed using a 1.5 T system (Signa HDx, GE Healthcare, Chicago, IL, USA). First, standard cine steady-state free precession (SSFP) sequences were acquired in long and short axis views during consecutive breath-holdings to cover the whole heart using the following averaged scan parameters: echo time TE = 1.5 ms, repetition time TR = 3.7 ms, flip angle = 50°, acquisition matrix = 260×192, pixel size = 0.74 mm, slice thickness = 8 mm, views per segment = 12, reconstructed temporal resolution = 15ms after applying a view sharing technique. Then, 2-chamber and 4-chamber views helped position planes in the LV and RV perpendicular to the inflow and located below the annulus at the level of the tips of the opened mitral and tricuspid valve leaflets, respectively, to acquire trans-mitral and trans-tricuspid through-plane velocity series using a retrospectively ECG-gated PC pulse sequence during breath-holding and the following scan parameters: encoding velocity Venc = 180 cm/s, TE = 3.1 ms, TR = 7.6 ms, views per segment = 2, view sharing was used resulting in an effective temporal resolution of 15 ms. Moreover, a myocardial longitudinal velocity series was acquired on the most basal slice location during breath-holding using retrospective ECG gating and the following scan parameters: Venc = 15 or 20 cm/s, TE = 5 ms, TR = 9.5 ms, views per segment = 2, view sharing was used resulting in an effective temporal resolution of 20 ms. These additional acquisition parameters were used for both flow and tissue velocity-encoded series: flip angle = 20°, acquisition matrix 256x128, pixel size = 1.6-1.9 mm, slice thickness = 8 mm. Immediately after MRI acquisitions, central systolic (SBP) and diastolic (DBP) blood pressures were measured at the right carotid artery using the applanation tonometry PulsePen device (DiaTecne, Milano, Italy).
Cine SSFP images were analyzed using QMASS ® software (Medis, Leiden, the Netherlands), resulting in RV end-diastolic (EDV) and end-systolic (ESV) volumes as well as RV mass. RV ejection fraction as well as its mass normalized by EDV were further derived.
Analysis of MRI data and extraction of diastolic function indices
PC-MRI data analysis was performed by 10-year experienced operators blinded to patient characteristics and echocardiographic findings.
PC-MRI modulus images were challenging to segment because of the flow-related contrast variations throughout time. Therefore, we preferred to process phase velocity images, which presented connected areas in terms of velocity sign within the inflow region. A custom software previously designed for trans-mitral flow quantification [14] was used. Processing steps are briefly summarized below.
The segmentation algorithm was based on the connectivity properties of mitral and tricuspid velocities and comprised three main steps. First, a region of interest (ROI) was manually placed around the trans-valvular inflow on a single phase at the middle of the cardiac cycle, to ensure valve opening. Then, mean velocity was calculated within this ROI for each time phase, and the cardiac phase corresponding to its highest absolute value was used for segmentation initialization. Such automated initialization was based on the detection of the largest connected inflow region, in terms of velocity sign. The centre of mass of this region was then calculated and reported to the neighbouring time phases. Third, the largest connected region around this centre of mass was automatically detected in these neighbouring phases, and their centre of mass was used to repeat the process phase by phase towards the beginning and the end of the cardiac cycle.
After time-resolved valvular orifice segmentation, velocity and flow-rate waveforms were derived (Figure 1.A). The mitral and tricuspid flow mean and maximal velocity curves were used to estimate velocity-related parameters (Emean, Amean and Emax, Amax, respectively, in cm/s), by automatically detecting the two highest local peaks over the
diastolic period. Similar processing was applied to the mitral and tricuspid flow-rate curve to detect the early (Ef, in mL/s) and late (Af, in mL/s) RV peak filling rate. The filling volume (FV, in mL) was defined as the area under the mitral or tricuspid flow-rate curve comprised between the beginning and the end of the filling period (Figure 1.A). Emean/Amean, Emax/Amax and Ef/Af ratios as well as peak filling rates normalized by the filling volume (Ef/FV
and Af/FV, in s-1), were further calculated.
Myocardial longitudinal motion analysis was also performed on velocity images. However, the connectivity process was not adapted because of the basal bi-directional (up and down) longitudinal motion throughout the cardiac cycle, inducing positive and negative velocities. Accordingly, a classification based on the k-means
algorithm was applied to velocity profiles of fixed pixels over the whole cardiac cycle, within an ROI manually drawn around the LV and RV on a single phase. This classification allowed isolating a myocardial cluster on the LV lateral wall and RV free wall, respectively, which was then used to derive time-resolved maximal and mean myocardial longitudinal velocity waveforms (Figure 1.B). E’mean and E’max were extracted from both mean and
maximal myocardial velocity curves, respectively, as the first local peak during the RV filling period. Finally, Emean/E’mean and Emax/E’max ratios were also reported. Of Note, quality of PC velocity images and the derived
velocity and flow-rate waveforms was rated visually as good or poor (in case of absence of RV free wall myocardial cluster or noisy velocity profiles), and data with poor quality were excluded from further analysis. Variability study
Intra- and inter-operator variability of RV diastolic function indices was studied on a subgroup of 30 randomly selected subjects (43±18 years, 15 males), while repeating the analysis by the first rater (EB) and then by two independent raters (EB and NK), respectively, and extracting the abovementioned functional velocity and flow-rate quantitative parameters measurements from PC-MRI data (Emean, Amean, Emax, Amax, Ef, Af, FV, E’mean, E’max).
Statistical analysis
The study group was divided into 2 subgroups according to age median: group 1 ≤ 40 years and group 2 > 40 years. Mean value and standard deviation were provided for basic characteristics, MRI RV volumes and mass, as well as Doppler echocardiography and PC-MRI RV diastolic function indices. A Wilcoxon rank-sum test was used to study significance of the differences between the 2 age groups. Linear regression was used to study physiological associations between indices of RV diastolic function and age, as well as the agreement between imaging modalities both on the RV and LV. For associations with age, further multivariate models were used while adjusting for cofounding effects such as gender and body mass index (BMI). Associations between Doppler echocardiography-derived LV E, A waves, mitral annulus E’ velocity and their PC-MRI-derived counterparts on the RV extracted from either mean, maximal velocity or flow rate, as well as associations of paired indices between the LV and RV as assessed by Doppler and PC-MRI, were studied using linear regressions. Finally, linear regressions were also used to investigate the relationship between RV mass to EDV ratio and RV diastolic relaxation-related E’, and multivariate models were used to adjust for age. Pearson correlation coefficients were provided. Intra- and inter-operator variability of PC-MRI tricuspid blood flow and myocardial parameters calculation was assessed using linear regressions, intra-class correlation coefficients (ICC), coefficients of variation (CoV) and Bland-Altman analyses. Mean bias and limits of agreement, as defined as mean bias ± 1.96 x
standard deviation, were reported. A p value < 0.05 was considered as significant. Statistical analyses were performed using JMP Pro v14.0.0 (SAS Institute, Cary, NC, USA).
Results
Processing time for the evaluation from PC-MRI of RV diastolic function for one subject was less than 3 minutes, on a personal computer (CPU 2.67 GHz, 3 Gb RAM). While PC-MRI tricuspid flow data were analyzed and inflow-related indices were extracted successfully in all subjects, 11 subjects were excluded from further analyses due to myocardial dataset poor quality. Table 1 summarizes basic characteristics, MRI RV volumes and mass according to age group, for the remaining 89 healthy volunteers (50 males, age = 43±15 [20-79] years) who had all measures. We found a significant age-related decrease in end-systolic and end-diastolic RV volumes along with a slight increase in RV ejection fraction and unchanged RV mass, resulting in a significant elevation of RV mass to EDV ratio with age.
RV PC-MRI data analysis was reproducible, as reflected by high intra- (Figure 2) and inter- (Figure 3) observer intra-class correlation coefficients (ICC), low mean biases and narrow limits of agreement, as well as low coefficients of variation (CoV) for the estimation of trans-tricuspid flow rate and velocity as well as RV basal myocardial longitudinal velocity parameters: CoV=4.6% and 18% for Emax, CoV=6.7% and 9.9% for Amax,
CoV=3.1% and 7.6% for Emean, CoV=5.9% and 8.2% for Amean, CoV=3.3% and 2.8% for Ef, CoV=5.2% and 2.3%
for Af, CoV=7.7% and 8.6% for FV, CoV=21% and 21% for E’max, CoV=15% and 14% for E’mean, respectively.
Only fair associations were found between PC-MRI and echocardiography RV diastolic function indices. Such correlations did not exceed r=0.28, p=0.006 for E, r=0.22, p=0.04 for A, r=0.45, p<0.0001 for E/A, whether calculated in PC-MRI from tricuspid mean, maximal velocity or flow rate; r=0.30, p=0.01 for E’ whether calculated in PC-MRI from RV myocardial mean or maximal velocity.
On the other hand, stronger correlations were found between both modalities on the LV: r≥0.42, p<0.0001 for E, r≥0.30, p≤0.004 for A, r≥0.61, p<0.0001 for E/A, r≥0.30, p≤0.006 for E’. In addition, significant associations were obtained between all PC-MRI-derived RV diastolic function indices and LV indices, as assessed by either Doppler echocardiography or PC-MRI (Table 2), as well as between RV and LV Doppler paired indices: E: r=0.53, p<0.0001; A: r=0.35, p=0.0007; E’: r=0.36, p=0.0007.
Distribution of Doppler echocardiography and PC-MRI RV diastolic function indices according to age group are summarized in Table 3, along with their linear regressions with age. As expected, a decrease in E wave and an increase in A wave were observed with age when using both modalities. Such trends reached significance for echocardiographic A wave (r=0.40, p<0.0001) and PC-MRI E wave, whether calculated from mean (r=-0.57,
p<0.0001), maximal (r=-0.58, p<0.0001) velocity or flow rate (r=-0.53, p<0.0001; r=-0.47, p<0.0001 when normalized by filling volume) curves. The increase in PC-MRI A wave with age was significant when derived from mean velocity (r=0.22, p=0.03) or flow rate curve normalized by filling volume (Af/FV: r=0.60, p<0.0001). The overall decrease in E and increase in A waves resulted in a significant decrease in E/A ratio, which showed a higher correlation with age when considering PC-MRI (Emax/Amax: r=-0.56, p<0.0001; Emean/Amean: r=-0.61,
p<0.0001; Ef/Af: r=-0.64, p<0.0001) as compared to echocardiography (r=-0.40, p=0.0001; Figure 4). Of note, highest correlations with age among PC-MRI E/A ratios were observed for flow rate and mean velocity as compared to maximal velocity. We also obtained the expected significant decrease in myocardial longitudinal velocities with age, when using both echocardiography (r=-0.36, p=0.0006) and PC-MRI (E’mean: r=-0.40,
p<0.0001; E’max: r=-0.36, p=0.0005; Figure 4). The decrease in E’ resulted in a slight increase in E/E’, revealing
an elevation of RV filling pressures with age, although remaining within a normal range for both modalities. Finally, most significant associations with age were further independent of the cofounding effect of gender or increased BMI.
Significant and stronger associations between RV mass/EDV and E’ were found for PC-MRI (E’max: r=-0.28,
p=0.007; E’mean: r=-0.36, p=0.0006) as compared to echocardiography (r=-0.09, p=0.38; Table 4). Such association
remained significant after adjustment for age only when considering PC-MRI E’ derived from mean velocity curve.
Discussion
Quantification of RV diastolic function remains particularly challenging for both MRI and echocardiography given the complex shape, thin wall and anatomical location of the RV. Indeed, while LV diastolic function has been widely explored using Doppler echocardiography, 2D PC-MRI and more recently 4D flow MRI, fewer echocardiographic studies have reported RV exploration, highlighting its complex evaluation [20]. Even fewer studies were found in the MRI literature and most of them focused on cine anatomical images [21, 3, 22, 23]. Age-related variations in RV diastolic indices
In the present work, a semi-automated and fast analysis including segmentation of the tricuspid valve orifice, myocardial clustering and quantification of RV diastolic function indices was applied to PC-MRI data. Quantitative indices were found to be reproducible, especially when estimated from flow rate and mean velocity curves, which might be less prone to noise and to the complex geometry and flow patterns of the RV than maximal velocities. Such indices were then compared to echocardiography in 89 healthy volunteers who had both exams on the same day. Discrepancies we observed between echocardiography and PC-MRI might be explained by several factors which can be related to: 1) technical differences between such modalities, including temporal
resolution which has a major impact on the measurement of peak velocities, or also the fact that PC-MRI measurements are based on velocities perpendicular to a 2D plane while Doppler echocardiographic measurement is based along a unidirectional beam; 2) inherent challenges to image the RV because of the irregular shape including for proper alignment between slice or beam positioning and the flow or myocardial motion direction; 3) physiological differences between the two non-simultaneous exams, including free breathing vs. breath-holding which can have an impact on diastolic function; 4) patient body size which might technically affect echocardiographic more than MRI measures. This might be corroborated by the fact that MRI-to-MRI associations were stronger than echocardiography vs. MRI when comparing RV and LV diastolic function indices, which further demonstrated the reliability of our measurements. Indeed, as expected, parallel changes in RV and LV diastolic function were observed in our healthy population. In addition, differences between MRI and Doppler echocardiography were toned down on the LV with a less complex geometry when compared to the RV. Despite the fair correlation between PC-MRI and echocardiography, associations of RV diastolic function indices as assessed by both imaging modalities with age were in line with previous echocardiographic findings [24–28], and consistent with the knowledge on LV filling and relaxation that has been extensively reported in both MRI and echocardiographic literature [29, 30]. Indeed, we found a decrease in tricuspid early filling wave E and myocardial longitudinal peak velocity E’, as the myocardium might stiffen with aging due to changes in its composition, as well as an increase in A wave, reflecting a compensatory contribution of the right atrium to maintain appropriate RV filling. This resulted in a significant decrease in E/A and a slight increase in E/E’ ratios. Such associations with age were slightly stronger for PC-MRI indices when compared to echocardiography.
Superiority of PC-MRI mean velocity- and flow rate-derived RV diastolic indices over maximal velocities PC-MRI diastolic function indices were extracted from maximal velocities (Emax, Amax, E’max), as usually
performed using Doppler echocardiography, but also from mean velocities (Emean, Amean, E’mean) and flow rates (Ef,
Af), in order to reduce PC-MRI errors due to both velocity noise and changes, throughout diastole, in trans-tricuspid flow jet orientation relative to the acquisition plane positioning. Indeed, PC-MRI when combined with an automated segmentation enables the delineation of the tricuspid orifice through time, providing time-resolved RV filling flow rate which is an instantaneous volume and thus less sensitive to jet orientation than maximal velocity waveform, which can be underestimated if the acquisition plane is not positioned exactly perpendicular to the tricuspid inflow. As such, PC-MRI diastolic function indices derived from mean velocity and flow rate curves resulted in overall higher or equivalent correlations with age and were found to be more reproducible than maximal velocity indices. One might also emphasize the consistency of PC-MRI flow rate indices when
normalized to filling volume to account for preload, which is a major concern when evaluating RV diastolic function.
Association between RV PC-MRI relaxation-related E’ and mass to end-diastolic volume
Our RV cine MRI data analysis also revealed the expected [31, 32] decrease in RV volumes as well increase in ejection fraction and RV mass to end-diastolic volume ratio with age. This latter index of RV remodeling was significantly associated with RV relaxation, as quantified by E’, though only for PC-MRI. Such association was independent of age and was again stronger for mean velocity than maximal velocity-derived E’, consistently with the aforementioned findings.
Diastolic dysfunction is a subclinical alteration underlying heart failure, before the apparition of decreased ejection fraction and has been widely described in the LV. In addition, it has been shown [33] in patients during the compensated phase of heart failure with preserved ejection fraction, that RV diastolic dysfunction was impaired while RV systolic function remained stable, suggesting that diastolic function alteration might be a biventricular phenomenon. Accordingly, MRI, which is already the modality of choice to evaluate volumes, ejection fraction and myocardial mass on both ventricles, along with the addition within the same cardiac exam of two 15 to 20-second acquisitions and 3-minute analysis might be of major clinical usefulness in the early detection, management and follow-up of patients with incipient heart failure.
Limitations
While the analysis of tricuspid inflow images was successful in all cases, E’ could not be measured from PC-MRI in 11% of subjects, indicating the need for better-resolved techniques that are more robust to the RV thin wall such as feature tracking, which can be used on conventionally acquired cine MRI long axis data in clinical routine, to track the tricuspid annulus over the cardiac cycle and derive its longitudinal velocity as previously done in the LV [17]. Another limitation of our study is the lack of a gold standard that would be independent of both MRI and echocardiography imaging modalities. However, invasive data were not available in our healthy volunteers. Conclusion
A fast and reproducible analysis of PC-MRI data provided reliable quantitative indices of tricuspid valve inflow and annular myocardial longitudinal motion, which were able to detect in 89 healthy volunteers the expected age-related changes in RV diastolic function, as well as independent association between diastolic relaxation and RV remodeling, evaluated through mass to end-diastolic volume ratio. The addition of such data acquired within a breath-hold to a routine MRI exam might be of clinical usefulness in disease involving the RV, such as pulmonary hypertension, heart failure or congenital heart disease.
References
1. Haddad F, Hunt SA, Rosenthal DN, Murphy DJ (2008) Right Ventricular Function in Cardiovascular Disease, Part I: Anatomy, Physiology, Aging, and Functional Assessment of the Right Ventricle. Circulation 117:1436–1448. https://doi.org/10.1161/CIRCULATIONAHA.107.653576
2. Horton KD, Meece RW, Hill JC (2009) Assessment of the Right Ventricle by Echocardiography: A Primer for Cardiac Sonographers. J Am Soc Echocardiogr 22:776–792. https://doi.org/10.1016/j.echo.2009.04.027 3. Maceira AM, Prasad SK, Khan M, Pennell DJ (2006) Reference right ventricular systolic and diastolic function normalized to age, gender and body surface area from steady-state free precession cardiovascular magnetic resonance. Eur Heart J 27:2879–2888. https://doi.org/10.1093/eurheartj/ehl336
4. Kempny A, Fernández-Jiménez R, Orwat S, et al (2012) Quantification of biventricular myocardial function using cardiac magnetic resonance feature tracking, endocardial border delineation and echocardiographic speckle tracking in patients with repaired tetralogy of fallot and healthy controls. J Cardiovasc Magn Reson 14:32
5. Scatteia A, Baritussio A, Bucciarelli-Ducci C (2017) Strain imaging using cardiac magnetic resonance. Heart Fail Rev 22:465–476. https://doi.org/10.1007/s10741-017-9621-8
6. Mooij CF, de Wit CJ, Graham DA, et al (2008) Reproducibility of MRI measurements of right ventricular size and function in patients with normal and dilated ventricles. J Magn Reson Imaging JMRI 28:67–73. https://doi.org/10.1002/jmri.21407
7. Backhaus SJ, Metschies G, Billing M, et al (2019) Cardiovascular magnetic resonance imaging feature tracking: Impact of training on observer performance and reproducibility. PLOS ONE 14:e0210127. https://doi.org/10.1371/journal.pone.0210127
8. Hartiala JJ, Mostbeck GH, Foster E, et al (1993) Velocity-encoded cine MRI in the evaluation of left ventricular diastolic function: Measurement of mitral valve and pulmonary vein flow velocities and flow volume across the mitral valve. Am Heart J 125:1054–1066. https://doi.org/10.1016/0002-8703(93)90114-O
9. Paelinck BP, de Roos A, Bax JJ, et al (2005) Feasibility of tissue magnetic resonance imaging. J Am Coll Cardiol 45:1109–1116. https://doi.org/10.1016/j.jacc.2004.12.051
10. Paelinck BP, Vrints CJ, Bax JJ, et al (2007) Tissue cardiovascular magnetic resonance demonstrates regional diastolic dysfunction in remote tissue early after inferior myocardial infarction. J Cardiovasc Magn Reson Off J Soc Cardiovasc Magn Reson 9:877–882. https://doi.org/10.1080/10976640701693667
11. Marsan NA, Westenberg JJM, Tops LF, et al (2008) Comparison Between Tissue Doppler Imaging and Velocity-Encoded Magnetic Resonance Imaging for Measurement of Myocardial Velocities, Assessment of Left Ventricular Dyssynchrony, and Estimation of Left Ventricular Filling Pressures in Patients With Ischemic Cardiomyopathy. Am J Cardiol 102:1366–1372. https://doi.org/10.1016/j.amjcard.2008.06.064 12. Rathi VK, Doyle M, Yamrozik J, et al (2008) Routine evaluation of left ventricular diastolic function by
cardiovascular magnetic resonance: A practical approach. J Cardiovasc Magn Reson 10:36. https://doi.org/10.1186/1532-429X-10-36
13. Rubinshtein R, Glockner JF, Feng D, et al (2009) Comparison of Magnetic Resonance Imaging Versus Doppler Echocardiography for the Evaluation of Left Ventricular Diastolic Function in Patients With Cardiac Amyloidosis. Am J Cardiol 103:718–723. https://doi.org/10.1016/j.amjcard.2008.10.039
14. Bollache E, Redheuil A, Clément-Guinaudeau S, et al (2010) Automated left ventricular diastolic function evaluation from phase-contrast cardiovascular magnetic resonance and comparison with Doppler echocardiography. J Cardiovasc Magn Reson 12:63
cardiac magnetic resonance imaging: validation with echocardiography and age-related reference values. Clin Res Cardiol 103:441–450. https://doi.org/10.1007/s00392-014-0669-3
16. Suzuki M, Kotooka N, Sakuma M, et al (2017) Validity and Reliability of chamber-View Three-directional Encoded Phase-contrast Magnetic Resonance Velocity-Vector Mapping for Transmitral Velocity Measurements: Comparison with Doppler Echocardiography and Intra- and Inter-observer Variability. Magn Reson Med Sci 16:152–158. https://doi.org/10.2463/mrms.mp.2015-0172
17. Seemann F, Baldassarre LA, Llanos-Chea F, et al (2018) Assessment of diastolic function and atrial remodeling by MRI - validation and correlation with echocardiography and filling pressure. Physiol Rep 6:e13828. https://doi.org/10.14814/phy2.13828
18. Fyrdahl A, Ramos JG, Eriksson MJ, et al (2019) Sector-wise golden-angle phase contrast with high temporal resolution for evaluation of left ventricular diastolic dysfunction. Magn Reson Med. https://doi.org/10.1002/mrm.28018
19. Thavendiranathan P, Guetter C, da Silveira JS, et al (2019) Mitral annular velocity measurement with cardiac magnetic resonance imaging using a novel annular tracking algorithm: Validation against echocardiography. Magn Reson Imaging 55:72–80. https://doi.org/10.1016/j.mri.2018.08.018
20. Litwin SE, Zile MR (2019) Should We Test for Diastolic Dysfunction? How and How Often? JACC Cardiovasc Imaging S1936878X19303523. https://doi.org/10.1016/j.jcmg.2019.02.029
21. Suzuki J, Caputo GR, Masui T, et al (1991) Assessment of right ventricular diastolic and systolic function in patients with dilated cardiomyopathy using cine magnetic resonance imaging. Am Heart J 122:1035– 1040. https://doi.org/10.1016/0002-8703(91)90469-X
22. Liu B, Dardeer AM, Moody WE, et al (2018) Normal values for myocardial deformation within the right heart measured by feature-tracking cardiovascular magnetic resonance imaging. Int J Cardiol 252:220–223. https://doi.org/10.1016/j.ijcard.2017.10.106
23. Sato T, Ambale-Venkatesh B, Lima JAC, et al (2018) The impact of ambrisentan and tadalafil upfront combination therapy on cardiac function in scleroderma associated pulmonary arterial hypertension patients: cardiac magnetic resonance feature tracking study. Pulm Circ 8:204589321774830. https://doi.org/10.1177/2045893217748307
24. Kukulski T, Hübbert L, Arnold M, et al (2000) Normal regional right ventricular function and its change with age: a Doppler myocardial imaging study. J Am Soc Echocardiogr Off Publ Am Soc Echocardiogr 13:194–204. https://doi.org/10.1067/mje.2000.103106
25. Watanabe S, Suzuki N, Kudo A, et al (2005) Influence of Aging on Cardiac Function Examined by Echocardiography. Tohoku J Exp Med 207:13–19. https://doi.org/10.1620/tjem.207.13
26. Innelli P, Esposito R, Olibet M, et al (2009) The impact of ageing on right ventricular longitudinal function in healthy subjects: a pulsed tissue Doppler study. Eur J Echocardiogr 10:491–498. https://doi.org/10.1093/ejechocard/jen313
27. Chiha J, Boyd A, Thomas L (2010) Does Normal Ageing Alter Right Ventricular Relaxation Properties? A Tissue Doppler Study. Heart Lung Circ 19:406–412. https://doi.org/10.1016/j.hlc.2010.03.001
28. D’Andrea A, Vriz O, Carbone A, et al (2017) The impact of age and gender on right ventricular diastolic function among healthy adults. J Cardiol 70:387–395. https://doi.org/10.1016/j.jjcc.2016.12.005
29. Aquaro GD, Pizzino F, Terrizzi A, et al (2019) Diastolic dysfunction evaluated by cardiac magnetic resonance: the value of the combined assessment of atrial and ventricular function. Eur Radiol 29:1555– 1564. https://doi.org/10.1007/s00330-018-5571-3
30. Zile MR, Baicu CF, Gaasch WH (2004) Diastolic heart failure--abnormalities in active relaxation and passive stiffness of the left ventricle. N Engl J Med 350:1953–1959. https://doi.org/10.1056/NEJMoa032566
31. Fiechter M, Fuchs TA, Gebhard C, et al (2013) Age-related normal structural and functional ventricular values in cardiac function assessed by magnetic resonance. BMC Med Imaging 13:6. https://doi.org/10.1186/1471-2342-13-6
32. Kawel-Boehm N, Maceira A, Valsangiacomo-Buechel ER, et al (2015) Normal values for cardiovascular magnetic resonance in adults and children. J Cardiovasc Magn Reson 17:. https://doi.org/10.1186/s12968-015-0111-7
33. Rommel K-P, von Roeder M, Oberueck C, et al (2018) Load-Independent Systolic and Diastolic Right Ventricular Function in Heart Failure With Preserved Ejection Fraction as Assessed by Resting and
Handgrip Exercise Pressure–Volume Loops. Circ Heart Fail 11:.
Tables.
Table 1. Basic characteristics, MRI-derived RV end-diastolic (EDV) and end-systolic (ESV) volumes, ejection
fraction (EF) and mass for both age groups.
≤ 40 years > 40 years p value
Number of subjects 47 42 Gender (Males: N, %) N=27, 57% N=23, 55% Age (years) 31±5.9 57±9.3 <0.0001 BMI (kg/m²) 24±4.1 25±3.3 0.02 Heart rate (bpm) 67±9.0 67±9.9 0.83 SBP (mmHg) 92±11 102±14 0.0003 DBP (mmHg) 70±9.8 81±11 <0.0001
MRI RV volumes and mass indices
EDV (ml) 148±34 129±46 0.02 EDV/BSA (ml/m²) 80±15 69±21 0.003 ESV (ml) 62±20 50±23 0.003 ESV/BSA (ml/m²) 34±9.4 26±11 0.0003 EF (%) 58±8.1 62±7.0 0.02 Mass (g) 37±9.7 38±12 0.85 Mass/BSA (g/m²) 20±4.1 20±5.2 0.96 Mass/EDV (g/ml) 0.25±0.06 0.30±0.08 0.0006
BMI: body mass index; BSA: body surface area; DBP: central diastolic blood pressure; EDV: end-diastolic volume; EF: ejection fraction; ESV: end-systolic volume; RV: right ventricular; SBP: central systolic blood pressure.
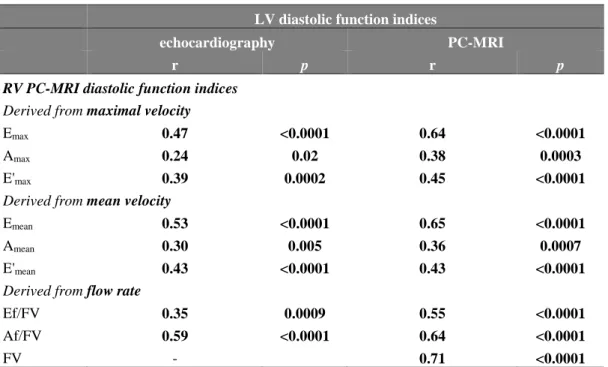
Table 2. Associations between PC-MRI-derived RV diastolic function indices and LV diastolic function indices
as extracted from either echocardiography (left) or PC-MRI (right). Correlation coefficients (r) and p values are provided.
LV diastolic function indices
echocardiography PC-MRI
r p r p
RV PC-MRI diastolic function indices
Derived from maximal velocity
Emax 0.47 <0.0001 0.64 <0.0001
Amax 0.24 0.02 0.38 0.0003
E'max 0.39 0.0002 0.45 <0.0001
Derived from mean velocity
Emean 0.53 <0.0001 0.65 <0.0001
Amean 0.30 0.005 0.36 0.0007
E'mean 0.43 <0.0001 0.43 <0.0001
Derived from flow rate
Ef/FV 0.35 0.0009 0.55 <0.0001
Af/FV 0.59 <0.0001 0.64 <0.0001
FV - 0.71 <0.0001
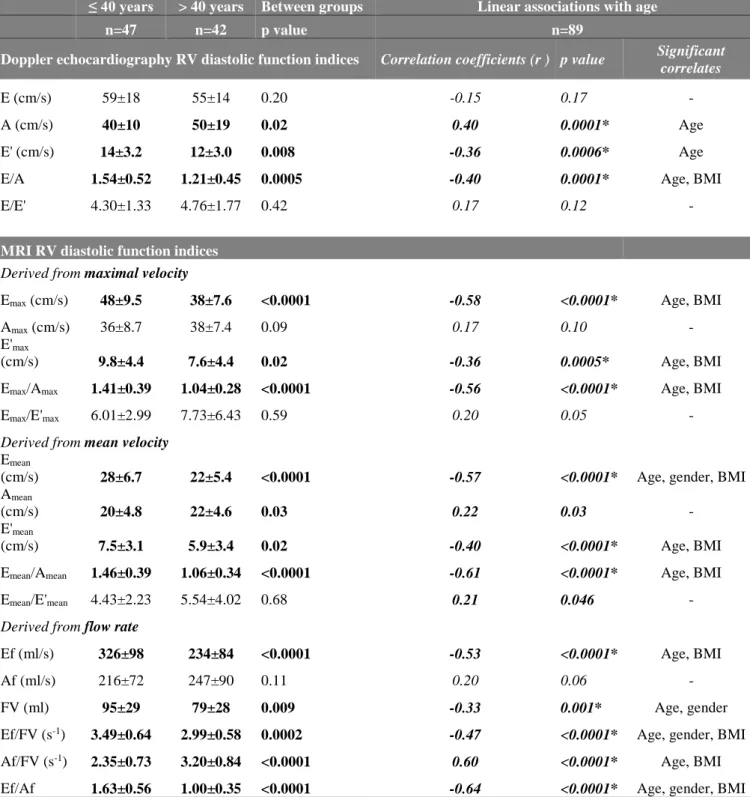
Table 3. Doppler echocardiographic and PC-MRI RV diastolic function indices for both age groups (left), along
with their linear associations with age over the whole group (right).
≤ 40 years > 40 years Between groups Linear associations with age
n=47 n=42 p value n=89
Doppler echocardiography RV diastolic function indices Correlation coefficients (r ) p value Significant correlates
E (cm/s) 59±18 55±14 0.20 -0.15 0.17 -
A (cm/s) 40±10 50±19 0.02 0.40 0.0001* Age
E' (cm/s) 14±3.2 12±3.0 0.008 -0.36 0.0006* Age
E/A 1.54±0.52 1.21±0.45 0.0005 -0.40 0.0001* Age, BMI
E/E' 4.30±1.33 4.76±1.77 0.42 0.17 0.12 -
MRI RV diastolic function indices
Derived from maximal velocity
Emax (cm/s) 48±9.5 38±7.6 <0.0001 -0.58 <0.0001* Age, BMI
Amax (cm/s) 36±8.7 38±7.4 0.09 0.17 0.10 -
E'max
(cm/s) 9.8±4.4 7.6±4.4 0.02 -0.36 0.0005* Age, BMI
Emax/Amax 1.41±0.39 1.04±0.28 <0.0001 -0.56 <0.0001* Age, BMI
Emax/E'max 6.01±2.99 7.73±6.43 0.59 0.20 0.05 -
Derived from mean velocity
Emean
(cm/s) 28±6.7 22±5.4 <0.0001 -0.57 <0.0001* Age, gender, BMI
Amean
(cm/s) 20±4.8 22±4.6 0.03 0.22 0.03 -
E'mean
(cm/s) 7.5±3.1 5.9±3.4 0.02 -0.40 <0.0001* Age, BMI
Emean/Amean 1.46±0.39 1.06±0.34 <0.0001 -0.61 <0.0001* Age, BMI
Emean/E'mean 4.43±2.23 5.54±4.02 0.68 0.21 0.046 -
Derived from flow rate
Ef (ml/s) 326±98 234±84 <0.0001 -0.53 <0.0001* Age, BMI
Af (ml/s) 216±72 247±90 0.11 0.20 0.06 -
FV (ml) 95±29 79±28 0.009 -0.33 0.001* Age, gender
Ef/FV (s-1) 3.49±0.64 2.99±0.58 0.0002 -0.47 <0.0001* Age, gender, BMI
Af/FV (s-1) 2.35±0.73 3.20±0.84 <0.0001 0.60 <0.0001* Age, BMI
Ef/Af 1.63±0.56 1.00±0.35 <0.0001 -0.64 <0.0001* Age, gender, BMI
* indicates that the relationship remained significant after adjustment for gender and BMI, and significant independent correlates among age, gender and BMI are provided in the last column.
Table 4. Linear associations of Doppler echocardiographic and PC-MRI RV E’ with RV mass to end-diastolic
volume ratio over the whole group.
Correlation coefficients (r ) p value
Doppler echocardiography RV diastolic function indices
E' (cm/s) -0.09 0.38
MRI RV diastolic function indices
E'max, maximal velocity (cm/s) -0.28 0.007
E'mean, mean velocity (cm/s) -0.36 0.0006*
* indicates that the relationship remained significant after adjustment for age.
Figure legends
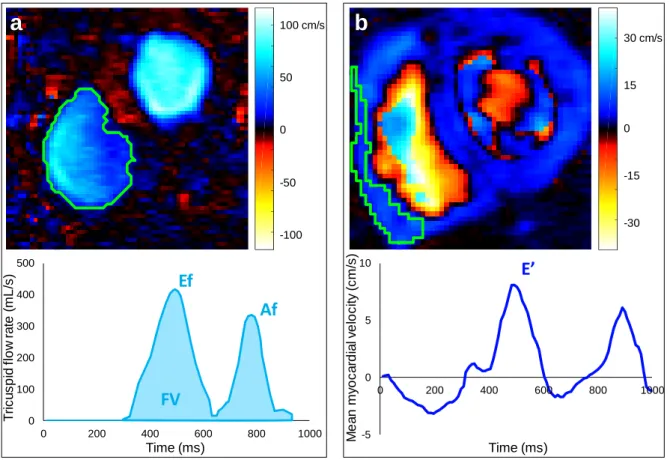
Fig. 1: Right ventricular tricuspid filling inflow (a) and myocardial annulus (b) phase-contrast (PC)-MRI data
analysis. Top: color-coded (see scale) through-plane velocity images on a diastolic phase. Results from the segmentation are illustrated with green contours. Bottom: extracted tricuspid flow rate (a) and myocardial longitudinal mean velocity (b) waveforms throughout the cardiac cycle, along with quantitative diastolic function indices: early (Ef) and late (Af) trans-tricuspid peak filling rate and filling volume (FV); basal myocardial early peak longitudinal velocity (E’).
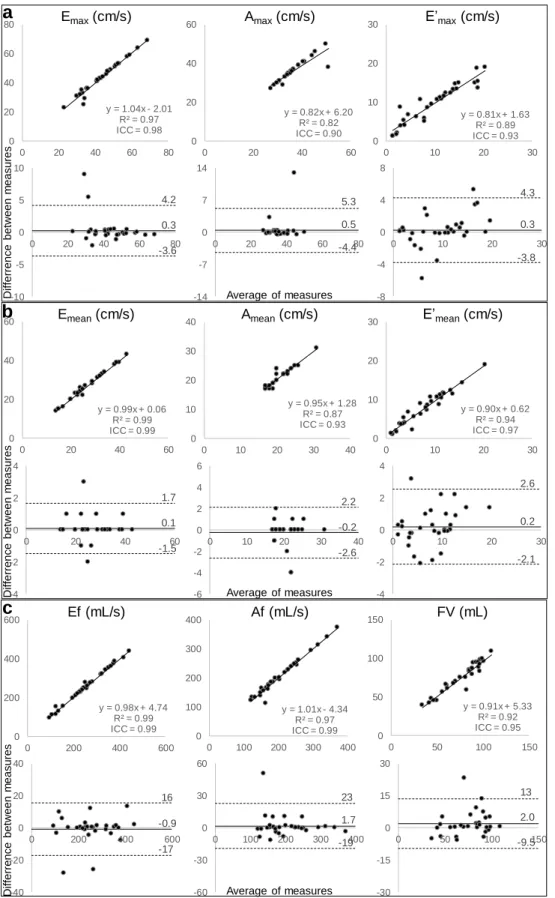
Fig. 2: Variability of repeated extraction by the same rater of PC-MRI RV diastolic function parameters derived
from maximal (a) and mean (b) velocities as well as flow rate (c), in terms of linear regression (top rows) and Bland-Altman analysis (bottom rows). Intra-class correlation coefficient (ICC) and mean bias (solid horizontal lines) along with limits of agreement (dotted lines), are provided.
Fig. 3: Variability of extraction by two independent raters of PC-MRI RV diastolic function parameters derived
from maximal (a) and mean (b) velocities as well as flow rate (c), in terms of linear regression (top rows) and Bland-Altman analysis (bottom rows). Intra-class correlation coefficient (ICC) and mean bias (solid horizontal lines) along with limits of agreement (dotted lines), are provided.
Fig. 4: Linear associations with age of echocardiographic (a) and PC-MRI (b) indices of tricuspid flow and
Figures
Fig. 1: Right ventricular tricuspid filling inflow (a) and myocardial annulus (b) phase-contrast (PC)-MRI data
analysis. Top: color-coded (see scale) through-plane velocity images on a diastolic phase. Results from the segmentation are illustrated with green contours. Bottom: extracted flow rate (a) and myocardial longitudinal mean velocity (b) waveforms throughout the cardiac cycle, along with quantitative diastolic function indices: early (Ef) and late (Af) trans-tricuspid peak filling rate and filling volume (FV); tricuspid myocardial early peak longitudinal velocity (E’). 0 100 200 300 400 500 0 200 400 600 800 1000 T ri c u s p id fl o w r a te ( mL /s ) Time (ms)
Ef
100 cm/s 50 0 -50 -100 30 cm/s 15 0 -15 -30 -5 0 5 10 0 200 400 600 800 1000 M e a n m y o c a rd ia lv e lo c it y (c m /s ) Time (ms)E’
Af
FV
a
b
Fig. 2: Variability of repeated extraction by the same rater of PC-MRI RV diastolic function parameters derived
from maximal (a) and mean (b) velocities as well as flow rate (c), in terms of linear regression (top rows) and Bland-Altman analysis (bottom rows). Intra-class correlation coefficient (ICC) and mean bias (solid horizontal lines) along with limits of agreement (dotted lines), are provided.
-30 -15 0 15 30 0 50 100 150 y = 0.91x + 5.33 R² = 0.92 ICC = 0.95 0 50 100 150 0 50 100 150 -60 -30 0 30 60 0 100 200 300 400 y = 1.01x - 4.34 R² = 0.97 ICC = 0.99 0 100 200 300 400 0 100 200 300 400 -40 -20 0 20 40 0 200 400 600 y = 0.98x + 4.74 R² = 0.99 ICC = 0.99 0 200 400 600 0 200 400 600 -8 -4 0 4 8 0 10 20 30 y = 0.81x + 1.63 R² = 0.89 ICC = 0.93 0 10 20 30 0 10 20 30 -14 -7 0 7 14 0 20 40 60 80 y = 0.82x + 6.20 R² = 0.82 ICC = 0.90 0 20 40 60 0 20 40 60 -10 -5 0 5 10 0 20 40 60 80 y = 1.04x - 2.01 R² = 0.97 ICC = 0.98 0 20 40 60 80 0 20 40 60 80
Emax(cm/s) Amax(cm/s) E’max(cm/s)
a
0.3 4.2 -3.6 0.5 5.3 -4.4 0.3 4.3 -3.8 -4 -2 0 2 4 0 10 20 30 y = 0.90x + 0.62 R² = 0.94 ICC = 0.97 0 10 20 30 0 10 20 30 -6 -4 -2 0 2 4 6 0 10 20 30 40 y = 0.95x + 1.28 R² = 0.87 ICC = 0.93 0 10 20 30 40 0 10 20 30 40 y = 0.99x + 0.06 R² = 0.99 ICC = 0.99 0 20 40 60 0 20 40 60Emean(cm/s) Amean(cm/s) E’mean(cm/s)
-4 -2 0 2 4 0 20 40 60
b
0.1 1.7 -1.5 -0.2 2.2 -2.6 0.2 2.6 -2.1 Ef (mL/s) Af (mL/s) FV (mL)c
-0.9 16 -17 1.7 23 -19 2.0 13 -9.5 Differrence between m ea su re s Diffe rr en ce between m easures Differrence between m easures Average of measures Average of measures Average of measuresFig. 3: Variability of extraction by two independent raters of PC-MRI RV diastolic function parameters derived
from maximal (a) and mean (b) velocities as well as flow rate (c), in terms of linear regression (top rows) and Bland-Altman analysis (bottom rows). Intra-class correlation coefficient (ICC) and mean bias (solid horizontal lines) along with limits of agreement (dotted lines), are provided.
-25 -13 0 13 25 0 50 100 150 y = 0.91x + 5.09 R² = 0.90 ICC = 0.94 0 50 100 150 0 50 100 150 -20 -10 0 10 20 0 100 200 300 400 y = 0.96x + 7.41 R² = 0.99 ICC = 0.99 0 100 200 300 400 0 100 200 300 400 -25 -13 0 13 25 0 200 400 600 y = 0.97x + 5.08 R² = 0.99 ICC = 0.99 0 200 400 600 0 200 400 600 -4 -2 0 2 4 0 5 10 15 20 y = 1.04x - 0.29 R² = 0.94 ICC = 0.97 0 5 10 15 20 0 5 10 15 20 -8 -4 0 4 8 0 10 20 30 40 y = 0.79x + 4.68 R² = 0.78 ICC = 0.88 0 10 20 30 40 0 10 20 30 40 -10 -5 0 5 10 0 20 40 60 y = 0.96x + 0.71 R² = 0.94 ICC = 0.97 0 20 40 60 0 20 40 60 -6 -3 0 3 6 0 10 20 30 y = 0.88x + 0.93 R² = 0.85 ICC = 0.92 0 10 20 30 0 10 20 30 -26 -13 0 13 26 0 20 40 60 y = 0.97x + 1.65 R² = 0.71 ICC = 0.83 0 20 40 60 0 20 40 60 -50 -25 0 25 50 0 20 40 60 80 y = 0.83x + 8.42 R² = 0.56 ICC = 0.75 0 20 40 60 80 0 20 40 60 80
Emax(cm/s) Amax(cm/s) E’max(cm/s)
a
-1 15 -17 -0.6 6.4 -7.7 0.3 4.3 -3.7Emean(cm/s) Amean(cm/s) E’mean(cm/s)
b
0.3 4.1 -3.5 -0.4 2.9 -3.7 0.0 2.1 -2.1 Ef (mL/s) Af (mL/s) FV (mL)c
1.7 16 -13 0.1 9.4 -9.1 2.2 15 -11 Differrence between m ea su re s Diffe rr en ce between m easures Differrence between m easures Average of measures Average of measures Average of measuresFig. 4: Linear associations with age of echocardiographic (a) and PC-MRI (b) indices of tricuspid flow and
myocardial longitudinal velocities.
y = 0.04x + 1.2 r = 0.60 p<0.0001 -1 1 3 5 7 0 20 40 60 80 100 y = -0.02x + 4.1 r = -0.47 p<0.0001 0 2 4 6 0 20 40 60 80 100 y = -0.16x + 64 r = -0.15 p=0.17 0 30 60 90 120 0 20 40 60 80 100 y = -0.02x + 2.38 r = -0.64 p<0.0001 0.0 1.0 2.0 3.0 0 20 40 60 80 100 y = -0.01x + 1.97 r = -0.40 p = 0.0001 0.0 1.0 2.0 3.0 0 20 40 60 80 100 y = -0.08x + 17 r = -0.36 p = 0.0006 0 5 10 15 20 25 0 20 40 60 80 100