JOURNAL OF GEOPHYSICAL RESEARCH, VOL. 106, NO. A10, PAGES 21,475-21,494, OCTOBER 1, 2001
The role of proton precipitation
in the excitation
of auroral
FUV
emissions
B. Hubert •nd J.-C. G6r•rd
Laboratoire de Physique Atmosph•rique et Plan•taire, Institut d'Astrophysique et de G•ophysique, Universit• de Liege, Liege, Belgium
D. V. Bisik•lo •nd V. I. Shem•tovich
Institute of Astronomy, Russian Academy of Sciences, Moscow, Russia
S.C. Solomon
Laboratory for Atmospheric and Space Physics, University of Colorado, Boulder, Colorado
Abstract. Far ultraviolet remote sensing from a high-altitude satellite is extensively used to image the global aurora, derive its energetics, and follow its dynamical morphology. It is generally assumed that the observed emissions are dominated by the interaction of the precipitated electrons with the thermospheric constituents. A model to calculate far ultraviolet emissions excited by auroral electrons and protons and the secondary electrons they generate has been used to calculate the volume
excitation
rate of the H I Ly-c•,
O I 1304
and 1356
•, N I 1493
• multipiers,
and the
N2 Lyman-Birge-Hopfield
(LBH) bands. The characteristic
energy and the energy
flux are derived from the observed statistical distribution of precipitated protons and electrons. This model is applied to the midnight aurora, the noon cusp, and a proton-dominated aurora for moderately disturbed conditions. We show that in the
first two cases, direct electron impact dominates the vertically integrated emission
rate over the proton component, although proton excitation plays an important role at some altitudes in the daytime cusp. In afternoon regions of the auroral zone near the auroral boundary, secondary electrons due to proton ionization are the main source of FUV emissions. The energy dependence of the efficiency of LBH band emission viewed from high altitude is calculated for electron and proton precipitations. Maps of the N2 LBH emission excited by both components are obtained, and regions of proton-dominated auroral emission are identified. It is found that the distribution of the ratio of proton-induced to electron-induced
brightness
resembles
maps of the ratio of the respective
precipitated energy fluxes.
Proton-dominated FUV emissions are thus located in a C-shaped sector extending from prenoon to midnight magnetic local times with a maximum proton contribution near the equatorward boundary of the statistical electron oval. The distribution of
the Ly-c•/LBH intensity ratio is found to mimic the ratio of the proton flux/total
energy flux, although it is insufficient by itself to accurately determine the relative fraction of auroral energy carried by the protons.1. Introduction
Global observations from space in the far ultraviolet
(FUV) make it possible to image the aurora in daytime
and nighttime conditions. Remote sensing of the en- tire polar region from highly excentric orbits provides
morphological observations, and time-dependent imag-
ing of the FUV aurora provides key information on tt•e
dynamical processes occurring in various regions of the
Copyright 2001 by the American Geophysical Union. Paper number 2000JA000288.
0148-0227/01/2000JA000288509.00
magnetosphere.
The measured
brightness
of specific
lines or molecular bands may be converted into a corre-
sponding flux of charged particles into the atmosphere if
the excitation mechanisms are identified. This conver-
sion of apparent emission rates into physical flux units requires the knowledge of relevant excitation, absorp-
tion and scattering cross sections, and density profiles of
the atmospheric constituents. This technique was suc-
cesfully applied to FUV cameras on board several satel-
lites. The implicit assumption generally used to convert
emission rates to incident energy fluxes is that electrons
carry the bulk of the precipitated auroral energy flux
[Ishimoto
et al., 1988; Germany et al., 1997]. How-
21,47521,476 HUBERT ET AL' FUV EMISSIONS IN PROTON AURORA
ever, ground-based observations lEather, 1967; Lum- merzheim and Galand, 2001] show the presence of the Ha and HZ lines of the Balmer series of atomic hy-
drogen. These lines are unambiguous signatures of the
presence of auroral protons. They are excited in charge
exchange collisions of precipitated protons with atmo- spheric constituents. In these collisions the incoming fast proton captures an electron from a neutral particle
(N2, 02, or O), producing an ion and a fast H atom in
an excited state. During deexcitation, Doppler-shifted
photons are emitted by the fast H atoms producing a broadened and shifted H I line. In situ satellite obser-
vations also indicate that protons are generally present in the particle beam interacting with the atmosphere
[Hardy et al., 1989]. Doppler-shifted Lyman-c• (Ly-c•) emission has been spectrally observed from space [Ishi- moro et al., 1988, 1989] and has been recently imaged [Mende et al., 2001] with the Spectrographic Imager on
board the Imager for Magnetopause-to-Aurora Global
Exploration
(IMAGE) satellite
[Mende
et al., 2000].
Numerous in situ measurements of energetic protons
suggest that protons may dominate the budget of en- ergy deposited in the atmosphere at selected local times
and latitudes. The statistical distribution of the precip- itating auroral ions [Hardy et al., 1989] indicates that
the maximum energy flux occurs in C-shaped regions symmetric about a meridian running prenoon to pre- midnight. For example, for Kp = 5 a maximum of 0,25
erg cm
-2 s -1 sr -1 is found in the premidnight
sector.
Globally, the protons carry 11 - 17% of the total en- ergy precipitated into the atmosphere. The difference in shape with the corresponding statistical pattern of
electron precipitation [Hardy et al., 1985] is such that
the statistical proton energy flux may locally exceed the
electron flux.
The FUV auroral spectrum is dominated by the N2
Lyman-Birge-Hopfield (LBH) bands, H I Ly-c•, the O I
multi.
piers
at 1304 and 1356 ]i, and several
N I lines
[Crosswhite and Fastie, 1962; Ggrard and Barth, 1976; Feldman and Gentieu, 1982; Ishimoto et al., 1988]. All
transitions
with the exception
of H I Ly-c• are excited
by electron impact on N2, 02, and O in the electron au-
rora. In the proton aurora the emissions are produced
by collisions of protons and fast H atoms with the at-
mospheric constituents as well as by secondary electrons
produced during ionization by the H + - H beam.
Several methods have been used to investigate the
interaction of proton and hydrogen auroral fluxes with
the atmosphere and to calculate their optical signatures.
These approaches can be generally categorized as (1) range method IRees, 1982], (2) linear transport theory [Jasperse and Basu, 1982; Basu et al., 1987, 1993;Ga- land et al., 1997; Lummerzheim and Galand, 2001], and (3) Monte Carlo test particle method [Kozelov and
Ivanov, 1992; $ynnes et al., 1998; LorentHen et al.,
1998]. These numerical methods allow the evaluation
of several
effects
induced
by proton
precipitation
such
as escape fluxes, heating rate of the atmospheric gas,
and optical emission rates. A more detailed review of the various methods used to calculate electron and pro-
ton transport, their advantages, and their drawbacks is
given by Solomon [2001]. Decker et al. [1996] compared
results obtained by three different methods and found good agreement for calculated quantities. Excitation of
FUV auroral emissions was discussed by $trickland et
al. [1993], who calculated emission yields for the excita-
tion of several FUV features by electrons and protons.
Recently, G•rard et al. [2000] showed that it is im-
portant to take into account the stochastic nature of
collisional scattering to properly describe the behavior
of high-energy
proton
s (or H atoms)
which collide
with
the target particles and change their direction follow- ing a probabilistic distribution of the scattering angle. This feature is an important component of the kinetic
model used in this work to calculate the proton trans-
port. A second advantage of this model was the use of updated cross sections and scattering angles based on experimental data.
In this study we combine an electron energy degrada- tion code with a proton Monte Carlo model to calculate
the relative contribution of individual processes to the
excitation
of the main
FuV auroral
features
in the pres-
ence or not of solar-induced emissions. We discuss theimportance of the protons and their FUV signatures for different typical auroral conditions. Regions where pro- tons make a significant contribution to the total FUV
emission rates are identified on the basis of the statis-
tical morphology derived from in situ particle measure-
ments. We discuss whether the Ly-a/LBH intensity
ratio may be used to remotely sense the relative energy
flux carried by auroral protons relative to electrons.
2. The Model
The methodology adopted to calculate the excitation
rates of the FUV emissions rests on the combination of
transport models describing the interaction of an elec-
tron and a proton beam, respectively,
with the atmo-
sphere.
The calculation of auroral electron energy degrada-
tion and excitation by solar-induced processes is based
on the GLOW model [Solomon et al., 1988; Solomon, 2001] with updated cross sections. An initial energy
distribution of the primary electrons is prescribed in an
analytical form. The two-stream transport algorithm is based on Banks et al. 's [1974] code, extended to higher energies for auroral calculations. The local electron flux is calculated using the two-stream approximation, solv- ing for the upward and downward hemispherical fluxes along a magnetic field line assumed to be vertical as
a function of energy. Elastic collisions, discrete energy
losses from inelastic collisions, and heating of the ther-
mal electrons are considered. The energy bins and the
altitude steps are variable in size. The inelastic cross
sections are used in the analytical form given by Jack-
man et al. [1977]
and Green
and Stolarski
[1972].
Tests
have shown that energy bonservation is ensured with
an accuracy better than 10%. Many of the excitation
cross sections were refit to reflect subsequent revisions,
as described
by Solomon
et al. [1988]. Monte Carlo
HUBERT ET AL.' FUV EMISSIONS IN PROTON AURORA 21,477
Table 1. Electron and Proton I]mission Cross Sections a Feature Process Peak value, 10-X7cm •" Peak Energy, eV
O I 1304 A e + O 2.4 23 e + O2 0.32 80 H + O 0.29 3730 H + O2 0.41 3730 O I 1356 ]• e + O 1.1 16 e -t- O•. 0.88 110 H + O 1.0 1650 H + O•. 1.4 1650 N•. LBH e + N2 3.0 20 H + + N2 6.0 16 H + N•. 4.7 16 N I 1493 ]k e + N•. 0.18 85 H I Ly-a H + + M H+M
a For the peak value of H I Ly-c•, please see the text.
angular distribution of the energetic particles which is missing in a two-stream approach. However, in a re-
cent comparative study, Solomon [2001] showed that
the vertical ionization profiles calculated with the two- stream method implemented in the GLOW model are in excellent agreement with those obtained with more
sophisticated Monte Carlo and multistream methods.
For its simplicity of use and reduced computing time, we adopt the simpler two-stream approach.
The proton energy transport code was described in
detail by G•rard et al. [2000]. It is based on the di- rect Monte Carlo method [Marov et al., 1997], which
is a stochastic implementation of the solution of the
Boltzmann equations for the H + - H beam. The model was validated against other model results using differ-
ent approaches but the same proton flux characteristics
[Decker et al., 1996]. We note that the energy flux used as an input of the Monte Carlo model for the case illus- trated in Figure 2 of G•rard et al. [2000] was actually
0.3 instead
pf 0,5 erg cm-2s
-x. Therefore
the peak of
the energy deposition for the Monte Carlo simulation must be scaled up by a factor of 1.7, bringing the two curves into closer agreement.
Once the protons reach the thermosphere, charge ex-
change collisions with ambient O, 02, and N2 generate
a population of fast H atoms which, in turn, may be
converted back to energetic protons. The Monte Carlo
proton
aurora
code
includes
a detailed
calculation
of
all elastic and inelastic processes for both species. A
detailed treatment of the momentum transfer in all col- , , lisions makes it possible to follow the pitch angle dis- tribution of the simulated particles. Three sources of velocity vector redistribution of the energetic protons
are considered: (1) magnetic mirroring in the dipole ge- omagnetic field, (2) geometric spreading caused by the convergent magnetic field lines, and (3) collisional an-
gular redistribution. Doubly differential collision cross sections are used to describe proton and H atoms' col- lisions from 0.5 to 5 keV, with extrapolations at higher energies. Ionization of the major constituents by colli-
sions
with energetic
H + and H particles
generates
sec-
ondary electrons:
H• + M • H• + M + + e,
(1)
H i + M-• H i + M + + e,
H i + M-• H• + M + e,
(a)where subscript f denotes a fast particle and M is one
of the major constituents.
The energy production rate of secondary electrons by
these processes is calculated on the basis of the ioniza-
tion and electron stripping cross sections by Edgar et
al. [1973, 1975]. The energy distribution of the ejected
electron
population
is given by Rudd [1979] and Basu
et al. [1993].
To simulate a combined electron-proton aurora this
population of proton-generated secondary electrons is
added to the electron-generated component. Their en-
ergy loss is calculated similarly to the energetic electron component. The temperature profile and the O, O2,
and N2 densities are calculated from the Mass Spec- trometer Incoherent Scatter-1990 (MSIS-90) model at- mosphere [Hedin, 1991]. Ionosphere electron tempera-
ture and density are taken from the International Ref-
erence
Atmosphere-1990
(IRi-90) model
[Bilitza,
1990].
The input energy flux and characteristic mean en- ergy of both types of charged particles for prescribed
geophysical conditions and geographic location are pro-
vided by the statistical precipitation model described
by Hardy et al. [1987, 1991]. The resulting volume ex-
citation
rates
for Ly-a, N I 1493
]k, O I 1304
and 1356
]k, and N•. LBH bands
are calculated
including
all photo
excitation and collisional excitation processes. Finally,
the emerging intensities for a given view angie are cal-
culated taking absorption into account.
The cross sections adopted to calculate the FUV
emission rates are listed in Table 1. The O I 1304 ]k
electron impact excitation cross section is that of Zipf
and
Erdman
[1985
]. The O I 1356
]k cross
section
was
obtained by reducing the measured value of Stone andZipf [1974]
by a factor of 2.8, in agreement
with the
recommendation by Zipf and Erdman [1985]. The total
N• LBH cross section is taken from Ajello and Sheman-
sky [1985].
The absolute
cross
section
of the N I •D -
2P line at 1493.3 ]k was based on the measurements by Ajello and $hemansky [1985] at 100 eV. The shape
21,478 HUBERT ET AL.' FUV EMISSIONS IN PROTON AURORA
of Mumma and Zipf [1971]. Many of the proton exci-
tation cross sections for FUV emission are still poorly
known or undetermined. The cross section leading to the production of the H(2s) state by collisional excita- tion of fast H atoms and charge exchange with O. O•.,
and N•. as described
in detail by Gdrard
et al. [2000].
The Ly-a excitation cross sections for collisions of fast
H + and H with O•. and N•. are from Van Zyl and Neu-
mann [1988]. The value for impact on O was set equal
to 0.7 times the O•. cross section. The excitation cross
section
of the O I 3 s
35 state by fast H atoms
is taken
from Edgar et al. [1975], and we assume again a value
of 0.7 that of dissociative excitation of O•.. As indicated
by Strickland
et al. [1993],
the 1356
• emission
cross
section by H + is negligible owing to the nature of thetransition. The value for collisions of H with O and
are adopted from Edgar et al. [1975]. As will be seen in section 3.2., these contributions are less than those
of the secondary electrons, so that the exact value of
the cross sections is not essential in this study. The LBH emission cross section due to H + and H collisions is from Kozelov and Ivanov [1992]. Because of the lack
of reliable laboratory data, direct excitation of the 1493
It emission
by protons
and H atoms
is not considered.
The average energy and the total energy flux car-ried by auroral electron and protons as a function of
location, time, and geophysical conditions are given by Hardy et al.'s [1987, 1991] empirical models based on
data collected over several years with detectors on board
the Defense
Meteorological
Satellite Program
(DMSP)
satellites. The measured
vertical energy flux (in eV
cm-2 $-1 st-X) iS converted
into a total energy
flux as-
suming that the precipitation of both types of particles
is isotropic over one hemisphere. Since the high-energy cutoff of the detectors is 30 keV, Hardy et al. [1987, 1991] estimated the high-energy component up to 100 keV using a simple extrapolation procedure. They de- rived the mean particle energy from the energy spec- trum above 30 eV. Robinson eta!. [1987] pointed out
that owing to the excess incident electron flux from a
Maxwellian at energies below 500 eV, the mean energy
provided may be lower than a Maxwellian fit to the data. As an approximation, we assume a Maxwellian
distribution with characteristic _ energy E0 for electrons such that the mean energy (E - 2 E0) is equal to the
mean electron energy determined from Hardy et al.'s ex- trapolated energy spectra. An estimate of the error re- sulting from the use of a single Maxwellian distribution
over the full range of electron energies may be obtained
from the discussion of the electron spectral shape mea-
sured with the DMSP detectors by Hardy et al. [1985].
They calculated the average energy and energy flux sep-
arately for electrons with 50 eV _• E • 660 eV and
E • 660 eV as a function of Kp. On the basis of these
numbers, we determine the contributions of both popu-
lations to the absorbed LBH emission rate. It is found
that for a total I erg cm
-•' s -1 precipitation,
the soft
component (• 660 eV) contributes 0.08 kR, and the
higher-energy flux contributes 0.81 kR, for a total of
0.89 kR/erg cm
-•' s -1. If the energy
distribution
is ap-
proached by a Maxwellian •vith the same mean energy;
the calculated LBH emission is 0.95 kR. The error due
to the use of a single Maxwellian instead of the sum of
two Maxwellian distributions in this case is thereibre 6%
but may reach
up to 30% for the O I 1356
• emission.
For protons, measurements suggest that a kappa dis-
tribution provides a better fit. Lyons and Evans [1984]
showed that the proton distributions at ionospheric al- titudes have high-energy components. Shatbet et al.
[1993] also observed with the UARS satellite ion spec-
tra with high-energy tails similar to those measured by
Christon et al. [1991] in the central plasma sheet. Con-
sequently, we determine the E0and n parameters fitting _
in such a way that the mean energy E = 2E0(n/(n- 2)) is equal to Hardy et al. [1991] value. The n index was
determined by fitting the average proton energy spec-
tra given by Hardy et al.'s [1989] Figure 7 for Kp- 3
at four different local times. As for incident protons,
Hardy ctal. [1989, 1991] derived the total energy flux
by extrapolating the particle flux toward high energies by a MaxwellJan. We use a kappa law, which decreases the relative importance of the low-energy protons and
increases that of the high-energy protons. This assump-
tion places the emission peak at a lower altitude than
it would with a Maxwellian, causing additional absorp- tion by 02. The difference between the two spectral
contributions was assessed by comparing the outputs
from two runs: (1) a 'kappa distribution characterized
by/• - 9.3 keV and •b0
- I erg cm
-•' s -• and (2) a
MaxwellJan distributionswith the same E and •)0. The
results indicate a 19% smaller vertical brightness for the
LBH intensity and a 17% smaller value for Ly-a in the case of the kappa distribution.
All photodissociation, photoionization, photoelectron,
and excitation processes in the dayglow are calculated
by the GLOW model.
The 1304
• triplet is excited
by
resonance scattering in addition to electron impact on
O and 02. The 1356 • doublet
is solely
produced
by
photoelectron impact on O and 02. The N•. LBH bands and the N I lines are produced by photoelectron impact on ground state N2. Doppler-shifted hydrogen emission is not excited in the dayglow.
The volume emission rates can be integrated for an
arbitrary view angle to simulate observations by a down-
ward looking FUV instrument on board a high-altitude spacecraft. This integration is straightforward in opti- cally thin cases such as Doppler-shifted Ly-a and N I
1493 • lines. In this case
only attenuation
by O•. ab-
sorption in the lower thermosphere must be considered.We use the 02 absorption cross section by Og•awa and
Ogawa
[1975].
The (6-0) band of LBH was shown
by
Conway
[1983]
to be optically
thick at low altit.l•des.
The total contribution of this band amounts to less than
10% of the total system intensity. In addition, absorp. tion by 02 becomes important in the region where op- tical depth effects in this band become significant. We thus ignore multiple scattering for the N•. LBH bands, but each line is attenuated by O•. and summed up to provide the total emergent LBH emission rate. Gen-
erally, attenuation may be important for emissions be-
low -- 1550 • but becomes
i•egligible
at longer
wave-
HUBERT ET AL' FUV EMISSIONS IN PROTON AURORA 21,479 250 2OO 150 lOO , , , , ,,,I , , I I I l lll I , , , , ,,,I 10 ø 101 10 2
Volume emission rate (photon cm -3 s -1) ,,I
10 -1
Figure 1. Vertical distribution of FUV excitation rates for a i erg cm- _
for an initial Maxwellian energy distribution with E = 20 keV.
2 s-1 pure electron
aurora
keV) typically encountered in the statistical database of
Hardy et al. [1987,
1991]
which
locate
the emission
peak
above 100 km. Similarly, the t•vo doublet components
of the 1356
]k transition
may be affected
by multiple
scattering. However, the e•ciency is relatively small
[Strickland
and Anderson,
1983],
and this effect
is neg-
ligible for view angles close to zenith and emission peaks
above 110 km. It has been neglected in this work. We
now analyze the relative role played by proton precipi-
tation in producing FUV auroral emissions.
3. Results
3.1. Pure Electron Aurora
We first illustrate some model results obtained for
a pure electron aurora. The solar and geomagnetic conditions correspond to nighttime high latitudes for maximum solar activity: December 25, 65øN, 0000 LT,
F10.•-- F•0.•z = 191. The local time and latitude are
such that there is no contamination by dayglow. As an example, the volume emission rates of the O I 1304
•, 1356
.•, N I 1493 .•, and LBH emissions
are cal-
culated for an isotropic electron precipitation having aMaxwellian
energy
distribution
characterized
by/• - 20
keV and a I erg cm
-2 s
-• energy
flux (Figure
1). This
mean energy is typical of electron energies encountered
during substorms in the midnight sector of the auro- ra! oval. The N2 LBH is the dominant emission of the
FUV spectrum, showing a peak at 99 km. The 1304
/• emission
peaks
slightly
higher
than both the 1356
.•
and the LBH bands.
The 1356
.• emission
has a larger
low-altitude
contribution
than 1304 .• does,
owing
to
the larger contribution of dissociative excitation of 02.
Multiple scattering
of the 1304 J• triplet is important
but was not considered here. Radiative transfer calcula-
tions have shown that the fraction of photon backscat- tered upward varies with the altitude of the emission peak in a complex way. When the mean electron en- ergy increases, the altitude of the emission peak moves down into a region richer in 02, causing more absorp- tion of the short-wavelength emissions. Therefore, as the emission peak reaches the region of O2 absorption, the probability that photons initially emitted downward
are backscattered decreases from unity to zero. In the
case shown here the attenuation by 02 is 11% for 1304
.•, 73% for 1356 .•, and 69% for the total LBH sys-
tem. The calculated emerging intensity of the total LBH bands is 3.2 kR. This value is to be compared
with Ishimoto et al. 's [1988] satellite nadir observation
that the average emergent intensity of the unabsorbed
(3,10) LBH band
at 1928
.• is 55 R/incident
erg cm
-2
s -• in Kp- 3 to 5 conditions.
Since
the (3-10) band
accounts for 1.7% of the total LBH brightness, their
total unabsorbed LBH emission rate is 3.3 kR, in excel-
lent agrce•nent with the case described here, although _
the exact value of E was not measured during these
21,480 HUBERT ET AL.: FUV EMISSIONS IN PROTON AURORA
Table 2. Geophysical Parameters of the Simulated Cases
Parameter Midnight Daytime Cusp Proton Aurora
Day Aug. 24 Aug. 24 Dec. 25
Latitude 66 ø N 76 ø N 63 ø N
Longitude 0 ø 0 ø 0 ø
Solar zenith angle 103.4 ø 65.7 ø 98.4 ø
MLT, 0000 1200 1630 F10.7 191 191 191 F10.7A 216 216 216 Kp 3 3 4 Qo (electrons), erg cm -2 s -x 2.7 0.26 0.01 Qo (protons), _ erg cm -2 s -x 0.46 0.07 0.15 E (electrons), _ keV 2.8 0.14 0.84 E (protons), keV 23.9 1.9 39.2 n (protons) 3.6 3.3 3.5
3.2. Combined Electron-Proton Aurora
Both electron and proton precipitations are gener- ally simultaneously present in the auroral region. To
illustrate and assess the role of proton precipation, we
use three different auroral cases corresponding to (1) a
midnight electron-dominated aurora, (2) a noon cusp aurora characterized by a softer precipitation, and (3)
a proton-dominated afternoon precipitation. Their ge-
ographic, geophysical, and solar activity conditions are
listed in Table 2. All three correspond to •noderately
disturbed conditions (Kp = 3).
3.2.1. Nightside aurora. The first case is night-
time aurora in the midnight sector (Magnetic Local
Time (MLT) = 0000,
latitude
= 66
ø) for solar
maximum
conditions. The mean proton energy is nearly 9 times as high as the electron energy, but the energy flux carried by protons is •- 15% of the total. This case was selected by taking the latitude giving the highest total energy flux precipitated in the atmosphere at 0000 MLT. The
vertical distribution of the excitation rates for the LBH
bands
and the O I 1356 • is shown
in Figures
2a and
2b. The LBH excitation peaks at 115 km and is domi- nated by the electron component. Since the excitation
cross section peaks near 20 eV, secondary electrons are
more efficient than are primary electrons. The second
source is the impact of secondm'y electrons due to ion-
izations by the H + - H beam, which contributes 10%. Finally, direct excitation by fast H + and H makes a
2% contribution to the total. The conclusion is similar
for 1356 •, which
is also
dominated
by the (primary
and secondary) electron component. However, in this case, direct H + - H impact and secondary electrons dueto protons both contribute -• 12% at 135 kin, reaching
their maximum contribution -• 20 km above the direct
electron component.
Table 3 gives the vertically integrated emission rates
of Ly-c•,
LBH, 1304
•, 1356/•, and 1493/• due to elec-
tron and protons separately. About 20% of the emerg- ing LBH intensity is due to the proton component. The
other proton contributions are 100% for Ly-a, 17% for
1304
• and 20% for 1356/•. Consequently,
the proton
contribution to the O I and N2 LBH emissions is closeto the fractional energy flux carried by protons in the
precipitation (15%).
3.2.2. Noon cusp aurora. Noon cusp conditions (MLT = 1200, latitude = 75 ø N) have been selected for
the next case. The mean proton energy is now more than 10 times that of the electrons, and the proton en- ergy flux is 0.26 of the electron energy flux. It corre- sponds to the latitude of maximum energy flux statis- tically precipitated in the noon cusp sector.
Figures 3a and 3b show the vertical distribution of
the LBH and 1356 ]i excitation rates. The LBH excita-
Table 3. FUV Vertically Integrated Emission Rates a
Ly-a LBH 1304 A 1356 A 1493 Midnight aurora Electrons - 2.9 1.5 0.39 Protons 1.1 0.8 0.31 0.096 Noon cusp Electrons - 0.2 0.63 0.16 Protons 0.6 0.05 0.023 0.01 Proton aurora Electrons - 0.001 0.02 0.005 Protons 0.27 0.18 0.01 0.03 0.23 0.02 0.014 0.001 o.ool 0.02
HUBERT ET AL.' FUV EMISSIONS IN PROTON AURORA 21,481 500 4OO 300 20O 100 50O 40O 3OO 20O 100 LBH -
•.•,•
(a)
-
_ '. _ x Total 2-. 'x •.•. •
... Secondaries
from
p
-
'..,..-x
x x'x,•
....
Protons
-
'"',i•
... Electron
aurora z
'"-3 'x
""•"•"x.._
'•'
x.••.
2
-
k. 'x
x.k.(,....
x,
x.x•
'
-
2
_
_- , _71
I
I
I
I
1-
10 -2 10 -1 10 ø 10 • 10 2 l0 sVolume emission rate (photon cm -s s -1)
1356• i I i i i iii I i I i i i i i i [ I i I i i ill I i I i i i
•.x.x•
(b)
-
_'..
x'x.%
Total
-
\ L '\ -x ".
\ ".,x'x.%
'\... Secondaries
from
p _-
_x "..
\ ".x'x.x'x,.
'\....
Protons
-
-x '"'...
x'x•
... Elec•on
aurora
-
k '". '•.•.•.•
k "- •--
-•
•
•'"'"'"'"...,..
•' '•
-
, x '-. 'x - k ", 'N - 2 x '-. 'x _ _•
x
". 'x
x.• -
_ k ".•
xxxxx
x "...
'x.
_
xx
x
...
_ _ ill i i I i i i ii 10 -2 10 -l 10 ø 10 • 10 2Volume emission rate (photon cm -3 S -1)
Figure 2. Vertical distribution of (a) the N2 LBH and (b) O I 1356 I excitation rates for a
midnight aurora.
tion is also largely dominated by the solar component
(Figure 3a). The electron
component
(primaries
and
their secondaries) peaks at 280 km, an altitude consid- erably higher than that in the previous case. This is a
consequence of the low energy of the electrons associ-
ated with the noon polar cusp region. The direct H + - H and their associated secondary electrons peak at lower altitude (• 160 km) and are both comparable in
magnitude. The total production rate below 300 km is
nearly totally solar-controlled with a small contribution
from nonairglow processes. One should note, however, that the relative importance of the excitation by auro-
ral particles compared to the solar (airglow) component
will be variable under different conditions. In particu- lar, it will vary with solar cycle and geomagnetic activ-
ity and with season through the solar zenith angle. The
actual instantaneous energy flux may thus exceed the statistical value adopted here. The statistical auroral components may be viewed as statistically fixed values while the airglow contribution varies depending on sea-
21,482 HUBERT ET AL- FUV EMISSIONS IN PROTON AURORA 500 400 300 200 lOO 5oo 4oo 3OO 200 lOO LBH
'-•.•,•,•
Total
(a) -
-- x
"•."•.•.•
...
Secondaries
from
p-
_ x x
"•'?..'
x.•
....
Protons
- x N "<".• "• • • ... Elec•on aurora-
• •
'%-%• ... EUV
- .
x
'•x.
] -.. x 'k. _ ... , '?•.• - ", N]
"-. • x
x'X.
"N•
T
'"'-,.
•x
'• '•,•
- ',,• x. ,/ "X• - ',.., X / ', • ... _5,1 , ,, ,,,,,I , ,, ,,,,,I , ,, ,,,,,I , ,, ,,,,,I , , ,
10-2 10-1 10 0 10 • 10 2
Volume emission rate (photon c• 3 s -•) 1356 -"1 ' ' ' ' ''"1 ' ' ' ' ''"1 ' ' ' ' ''"1 _
Z
Total
'"•'x NN,
(b)
-
. ...
Secondaries
from
p
":•,,•,
x .... Protons ":•,,x v ... Electron
aurora
-
ß
•\____
EUV
"x-N.
-
',,,,x.
'•:•.
•....
"•.
"x..•
_
", "-...
x '" ,/ \,•\
'..
./-/
"\•
...
.<.
:..
_':..
7.-:'
':'
'"
...
10 -2 10 -• 10 ø 101 10 2Volume emission rate (photon cm -3 S -1)
Figure 3. Vertical distribution of (a) the N2 LBH and (b) O I 1356 A excitation rates for a noon
cusp aurora
sonal conditions. The noon cusp aurora modeled here
has two regimes with the low-altitude component domi- nated by protons and a second higher-altitude peak due
to the electron component.
The 1356
J[ excitation
(Figure
3b) has
similar
char-
acteristics: Globally dominated by the airglow compo- nent, it also shows an upper region dominated by elec-
trons and a lower-altitude region below 200 km mostly controlled by protons and their associated secondary
electrons. The vertically integrated emission rates (Ta-
ble 3) clearly confirm the minor role played by protons in comparison to electrons.
The two cases described so far correspond to typical
auroral conditions (Kp = 3) where the electron energy
flux exceeds the proton component. We note that even
in these conditions, the H + - H beam interaction with
the atmosphere can generate altitude regions where ex-
citation of the FUV emission is primarily controlled by
protons in the lower part of the thermosphere under
HUBERT ET AL.- FUV EMISSIONS IN PROTON AURORA 21,483
3.2.3. Proton-dominated aurora. We now ex-
amine conditions
where the statistical proton precip-
itation accounts
for most of the local auroral energy
flux in the Northern Hemisphere. These conditions are
observed
in the afternoon
sector
near the equatorward
boundary of the statistical precipitation oval. Con- sidering all levels of geomagnetic activities, the ratio Q0,p/Q0,e of the precipitated proton to the electron en-
ergy flux reaches a maximum value of 14 near 1600 MLT
and 63øN for Kp = 4 (Table 2). The proton flux is -0 2
times as high e•s that in the noon cusp but is only 0.32
of the midnight auroral case. The electron flux in this
sector is very weak: 0.04 rimes its cusp value and 0.004 times the midnight aurora. It may thus be considered
as a case of quasi-pure proton. aurora in the premidnight
sector such as those described on the basis of Balmer
line observations by Vallances-Jones [1974], Mende and
Eather [1976], and Creutzberg
et al. [1988]. The esti-
mated mean proton energy (39 keV) is higher than both
in the cusp and midnight cases and exceeds the energy
range of the satellite detectors. it results from the ex-
trapolation procedure described by Hardy et al. [1989] and must be considered as indicative only. Figures 4a-
4e show
the volume
excitation
rates
of the LBH, 1356
500 4OO 200 100 LBH ''1 ' ' ' '' '''1 ' ' ' .... 'l ' ' ' '' '''1 ' ' ' ' ':
'"'•'"•X,,,
Total(a)
'x-.•.
... Secondaries
from
p
x..,•.
....
Protons
-c
• ...
•..,•
... Electron
aurora --
"•'•-'
...
"\,N
... Solar
EUV
""'•.•.
'"
i:.
..._
_
•.-- , • -,,•..-•'-
'\,? • • •'"'-,
ß • -.,...
. • - ---"
' '•
' •'
' /
• -..
- r,,J , , , , ,,111J I I t i i ill[ • • • • [ ,,•l , , t • ,'• ]0 -• ]0-• ]0 • ]0 •Volume emission rate (photon cm
500 400
300
200 100 1356 -1 i ] • 1' , , , i , i I ,_
. (b)-
_x •""'x
'"""..
• _ •' • •'. '"'.•" / - . ...--- -,,• ' N '. _- _--w-.-•
---_Total--'"-"
.'< -. "x'x, '"'"..
• '.-
_... Secondaries
from
p • • •
x,
-...x,,,.
_
... Protons
"' '-L
'"""% -
... Electron aurora ... Solar EUV ... ... _ 10 -2 10-• 10 0Volume emission rate (photon cm -3 s -1)
Figure 4. Vertical
distribution
of the excitation
rate for proton-dominated
aurora.
(a) LBH
21,484 HUBERT ET AL' FUV EMISSIONS IN PROTON AURORA 500 400 300 200 •0o 1304
:
x...•.•,.x.,
'
(c)
____ Total '•,... Secondaries
from
p -•, -"'....
....
Protons
_•
... Electron
aurora
_.•.•_. Solar
EUV
.•,. -. • -.. • -. ,\ -,,,. \ _. -- •-- •--•• •' • _ _ _ ,l ... ,I , ... I ... I ,_ 10 -2 10-• 100 10 •Volume emission rate (photon cm -• s -1)
350 300
250
:oo 150 100 1493 h- •
Total(d)
-- . •
... Secondaries
from
p -
'i•i•.;
• ...• ...
Electron
aurora
• /./ '... -
:
-
• _
0-2 10-• 100
Volume emission rate (photon cm -3 s -1)
Figure 4. (continued)
1304
_i, and 1493
• emissions,
respectively,
calculated
for winter solstice conditions. The LBH band excitation
(Figure 4a) is dominated by secondary electrons due to
proton impa
ct . The second
most important
source
is
direct H + - H excitation, which contributes 20% to the LBH band excitation at the peak. Excitation by pri-
mary electrons and their secondaries is a minor source
of emission at all altitudes. Because of the large value
of the solar zenith angle, the dayglow component is only
significant above • 300 km at solstice and contributes
1% to the total column.
The situation is qualitatively similar for O I 1356
_i (Figure
4b), where
the proton-induced
component
is dominant. However, direct impact by protons and H atoms plays a relatively less important role than it
does for the LBH bands. The direct electron contri-
bution peaks near 200 km, reflecting the lo;v mean en-
ergy of the auroral electrons precipitated in this region.
The dayglow component is negligible below 300 kin, al- though once integrated over the vertical column, it also
contributes • 16% to the total emission.
The 1304
• triplet (Figure
4c) is primarily
excited
by secondary electrons from proton impact, and di- rect proton excitation plays a very minor role. This
is a consequence of the shapes of the secondary elec-
HUBERT ET AL.: FUV EMISSIONS IN PROTON AURORA 21,485 5OO 400
• 300
._: 200 lOO _ _- I I I I I Ill I I • , , ,,,I • • , I I I ill I I I I
10 -] 10 ø 10 •
Volume emission rate (photon cm -s s -1)
Figure 4. (continued)
Therefore direct electron impact is the second source of
1304 • excitation.
Above
300 km the dayglow
compo-
nent (photoelectron
impact
and resonance
scattering)
becomes dominant. Figure 4d shows the N I 1493 A
excitation
sources.
They closely
follow
the LBH-band
excitation rate since the mechanism is identical and only
threshold effects produce some differences. Finally, the
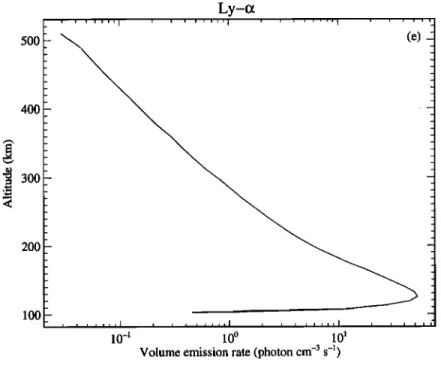
emission rate of the Doppler-shifted Ly-c• line (Figure 4e) shows a peak at the same altitude as that of the
other emissions.
4. Morphology of Proton-Induced
FUV
emission
The three cases described in sections 3.2.1-3.2.3 clear-
ly indicate that the relative role of electron and proton statistical precipitation in the excitation of the FUV
emissions strongly varies with local time and latitude.
In order to provide a global view- of the role played by
protons, •ve use Hardy et al. 's [1987, 1991] models to
map the FUV ernissions excited by both types of par-
ticles. We first establish the relationship between the
FUV emerging emission rates for a nadir observation
from a high-altitude orbit and the energy of the incom-
ing protons and electrons. These curves (Figure 5) are
obtained from the combined electron-proton code. A
fixed neutral atmosphere corresponding to the proton-
dominated aurora described before is used for all simu-
lati0ns.
Figure 5a shows the efficiency curve obtaiBed for the
hnabsorbed N2 LBH bands excited by electrons and protons. As was done previously, a MaxwellJan distri- bution is assumed for the initial energy of the precip-
itated electrons. A fixed neutral atmosphere structure is used as it is not established that the MSIS model
correctly reproduces the auroral composition in auroral
conditions, especially during magnetically active peri- ods. The sensitivity of these curves to the solar and ge-
omagnetic
conditions
will be discussed
in a later study.
The electron efficiency reaches a maximum of • 1.25
LB H kR per incident
erg cm
-2 s-1 at 15 keV and slowly
decreases
as a result of the increasing
efficiency
of the
ionization channel at higher energies. At lower energies
the LBH yield rapidly decreases,
mainly owing to the
drop of the N2 mixing ratio at higher altitudes
where
soft electrons deposit most of their energy. These val- ues compare well with those derived by $trickland et al.
[1993].
For
example,
for the 1700-1800
• region,
a yield
of 0.07 kR/erg cm
-2 s -1 is calculated
by $trickland
et
al. [1993] for electrons with a mean energy of 4 keV.Since this spectral band represents a fraction of 0.06 of
the total LBH excitation, their total (unabsorbed) LBH
yield is 1.2 kR/erg cm-2s
-1, identical
to our value
for
the same electron energy. At high energies, electrons
penetrate deeper into the atmosphere where 02 absorp-
tion becomes significant (Figure 5b). This causes the efficiency to depart from the unabsorbed values and to
drop to 0.2 kR/erg cm
-2 s -1 for • = 50 keV.
To calculate the efficiency curve for protons, a kappa
energy
distribution
is adopted
wikh
n = 3.5 for all en-
ergies.
In the case
of pure proton
precipitation
(Figure
5a) the unabsorbed LBH efficiency curve exhibits a be-havior similar to that of the electrons. A peak value
is reached folloxving an increase of the nonabsorbed ef-
ficien
cy' The nearly
equal
values
of the nonabsorbed
efficiency for electrons and protons stem from the dom- inant role played by secondary electrons generated by the primary beam for both types of energetic particles.
However,
for a given energy,
electrons
penetrate
deeper
than protons do into the thermosphere trees, 1989; Solomon, 2001] as a consequence of the lower value of
21,486 HUBERT ET AL- FUV EMISSIONS IN PROTON AURORA
1.5
o.sL
0.0 0
No absorption, vertical view
, , ,
' ' ' I ' ' ' I ' ' ' I ' ' ' I ' ' ' I ' ' '
20 40 60 80 100
Mean energy (keV)
With absorption, vertical view
lb)
• 1.O-/
• 0.5
0.0 120 0 20 40 60 80 100 120Mean energy (keV)
Figure 5. Efficiency of the emission rate of N2 LBH bands by electrons (solid line) and protons
(dashed
line) for a high-altitude
nadir observation
as a function
of the mean
particle
energy:
(a)
no absorption, (b) with 02 absorption.
mospheric gases. The resulting difference in the altitude
of the peak volume
excitation
rate for electrons
and pro-
•ons of a given
energy
produces
a different
absorption
by 02, causing
a lower
efficiency
of the electron
precip-
itation case.
The unabsorbed
(Figure 5a) and absorbed
(Figure 5b) proton
curves
are nearly
identical
up to •
50 keV since the bulk of the energy deposition occurs at
altitudes
above
120 km and is not significantly
affected
by 02 absorption. Our LBH efficiency values are close
to
those
obtained
by
$trickland
et
aI.•[1993]
at
high
en-
ergies.
Their peak
value
for the 1325 band
is 60 R/erg
cm-2s
-1, which
corresponds
to 1.2 kR/erg
cm-2s
-• to
be compared with our maximum unabsorbed value of
1.35
kR/erg cm-2s
-•. At lower
energy,
our curve
drops
to lower values than theirs does, possibly because of dii: ferences in the altitude of the energy deposition I)eak or the use of a different neutral composition.
Using the efficiency curves of Figure 5b combined with the energy flux and mean energy of electrons and protons, the distribution of the total LBH emission rate
in the (north) polar region
for nadir observations
may
be calculated
based
on the basis
of Hardy et al. 's [1985,
1991]
models.
Plates
la and lb show
the polar diagram
(orthographic
projections)
of the nadir LBH brightness
calculated for Kp= 3. In these plots the airglow com- ponent has not been included, as its brightness strongly depends on the solar illumination, that is on the da5 r of
HUBERT ET AL.: FUV EMISSIONS IN PROTON AURORA 21,487 12 % 3 29E+03 1.31E+03 5.21E+02
(a)
8.26E+01 < 3.29E+01 18 12 6.38E+02 2.54E+02 1.01E+02 O6 4.03E+01(b)
I 60E+01 • 6.38E+00Plate 1. Polar plot (orthographic projection) of the statistical distribution of the calculated nadir N2 LBH emission (in Rayleighs) for Kp = 3' (a) by electron; (b) by proton and (c) ratio of proton/electron excitation.
21,488 HUBERT ET AL' FUV EMISSIONS IN PROTON AURORA 18 40 06
(c)
1.04E+01 4.14E+00 1.65E+00 6.56E-01 2.61E-01 _< 1.04E-Ol Plate 1. (continuexl)HUBERT ET AL.- FUV EMISSIONS IN PROTON AURORA 21,489 18 12 6.27E+00 Z50E+00 9.94E-01 06 3.96E-01 1.57E-01 < 6.27E-02
Plate 2. Polar plot of the distribution of the ratio of the proton to electron energy fluxes for
Kp- 3. 12 1.46E+03 5.8 IE+02 2.3 IE+02 06 9.21E+01 3.67E+01 < 1.46E+01
Plate 3. Polar plot of the distribution of the auroral Ly-c• nadir emission rate (in Rayleighs) for Kp- 3.
21,490 HUBERT ET AL.: FUV EMISSIONS IN PROTON AURORA / ! I I I I I I % 40 ,' ' 50 , / ! ! / I I i I I ! ! 12 \• ' ,-"' I ' "• '.- ' / ,, 40 / % I ! % / \ ...- .A -- ... ! % ß ,%- '-/,, % I I % •'
% 60
•,%
% I t • ,,.'% ""'
I
%%
70.' k I ' , - 80 -,' '.80 . • • % I / ,%- % % I I ,,, % I i % t I I • .... r I ! % / Ii •% % I It
)'"' /
X / •.
I
I
• ' 80 ' ,.' , 80 ' ' 70 • . , I , • . 70 . / .. ./ , , "/• I .%' • •. / ! -- ,. "' '- --I-- --" / / I % / ,• / I I .// // I ', ,%"
-,-'
•0
ß ,. ! ..--. ., .. __
...
'--
%% /
' '40 I .(, ,, 8.63E-01 3.44E-01 1.37E-01 06 5.45E-02(a)
2.17E-02 •< 8.63E-03 18 40 ,' / , 50 ! /! !•' ' ,,.
,,. /!
/ 12 I I I I I I i I I i ! I % % % .,% % i i I 70 ! / \ \ % ., .½ ' ß x 40 ß - 50 % % % % / % / % ,, I % \ ß % % I I ! I I -%0 / / / 4.96E+00 1.97E+00 7.86E-01 06 3 13E-01(b)
1 25E-01 < 4 96E-02Plate 4. Validity of the Ly-a brightness as an indicator of the fraction of the energy flux
![Table 1. Electron and Proton I]mission Cross Sections a](https://thumb-eu.123doks.com/thumbv2/123doknet/6303575.165332/3.939.254.683.114.358/table-electron-proton-i-mission-cross-sections.webp)