The Effect of Environment, Chemistry, and Microstructure on the Corrosion Fatig Austenitic Stainless Steels in High Temperature Water
by
Lindsay Beth O'Brien
B.S. Nuclear and Mechanical Engineering, 2011 Rensselaer Polytechnic Institute
ie Behavior of
ARCHIVES
MASSACHUSETTS INSTITUTE OF TECHNOLOLGYMAY 0
6
2015
LIBRARIES
SUBMITTED TO THE DEPARTMENT OF NUCLEAR SCIENCE AND ENGINEERING
IN PARTIAL FULFILLMENT OF THE REQUIREMENTS FOR THE DEGREE OF MASTER OF SCIENCE IN NUCLEAR SCIENCE AND ENGINEERING
AT THE
MASSACHUSETTS INSTITUTE OF TECHNOLOGY September 2014
2014 Massachusetts Institute of Technology. All rights reserved.
Signature of Author: Certified by: Certified by:
Signature redacted
6'
ignature reda
Lindsay Beth O'Brien Department of Nuclear Science and Engineering
cted
August 29, 2014Ronald G. Ballinger rofessor of Nuc1ejr Science and Engineering, Materials Science and Engineering
ignature redacted
Thesis SupervisorMichael P. Short Assistant Professor of Nuclear Science and Engineering Thesis Reader
Signature redacted
Accepted by:
Mujid S. Kazimi CO Professor of Nuclear Engineering
r-The Effect of Environment, Chemistry, and Microstructure on the Corrosion Fatigue Behavior of Austenitic Stainless Steels in High Temperature Water
by
Lindsay Beth O'Brien
B.S. Nuclear and Mechanical Engineering, 2011 Rensselaer Polytechnic Institute
SUBMITTED TO THE DEPARTMENT OF NUCLEAR SCIENCE AND ENGINEERING
IN PARTIAL FULFILLMENT OF THE REQUIREMENTS FOR THE DEGREE OF MASTER OF SCIENCE IN NUCLEAR SCIENCE AND ENGINEERING
AT THE
MASSACHUSETTS INSTITUTE OF TECHNOLOGY September 2014
2014 Massachusetts Institute of Technology. All rights reserved.
Signature of Author:
Lindsay Beth O'Brien Department of Nuclear Science and Engineering
Signature redacted
August 21, 2014Certified by:
Ronald G. Ballinger Professor of Nuclear Science and Engineering, Materials Science and Engineering Thesis Supervisor
Accepted by:
Mujid S. Kazimi TEPCO Professor of Nuclear Engineering Chair, Department Committee on Graduate Students
The Effect of Environment, Chemistry, and Microstructure on the Corrosion Fatigue Behavior of Austenitic Stainless Steels in High Temperature Water
By
Lindsay Beth O'Brien
Submitted to the Department of Nuclear Science and Engineering On August 29, 2014, in partial fulfillment of the
requirements for the degree of
Masters of Science in Nuclear Science and Engineering
Abstract
The effect of sulfur on the corrosion fatigue crack growth of austenitic stainless steel was evaluated
under Light Water Reactor (LWR) conditions of 288'C deaerated (less than 5ppb 02) water, to
shed light on the accelerating effect of the LWR environment and to explore the effect of high sulfur content on the retardation of fatigue crack growth rates. Fatigue tests were performed using a trapezoidal loading pattern with rise times of 5.1, 51, 510, and 5100 seconds (fall time of 0.9, 9,
90, and 900 seconds), with Kmzx of 28.6 or 31.9 MPa'm and stress ratios (R, Pmin/Pmax) of 0.4 or
0.7. Two test materials were used to evaluate the effect of sulfur: (1) a low sulfur (<0.0025 wt%)
stainless steel and, (2) a high sulfur (0.032 wt% stainless steel. The low sulfur stainless steel
exhibited increasing crack growth rates from 9.4 x10⁻⁵ mm/cycle to 1.2x 1 04 mm/cycle as rise times
were increased from 5.1 to 5100 seconds with a stress ratio of 0.7. The high sulfur stainless steel exhibited decreasing crack growth rates from 1.4 x10⁻⁴ mm/cycle to 7.9 x105 mm/cycle as rise times were increased for a stress ratio of 0.4, and crack growth rates from 6.4 x105 mm/cycle to
3.6 x105 mm/cycle with increasing rise time at a stress ratio of 0.7. Evaluation of the crack growth
rates showed environmental enhancement of the crack growth rates for the low sulfur stainless steel, while the high sulfur stainless steel showed retardation of environmental crack growth rates, likely due to the increased corrosion at the crack tip associated with the high sulfur content. The crack surfaces were characterized using Scanning Electron Microscopy (SEM). The low sulfur material showed a light layer of corrosion product that decreased in thickness as the testing progressed, and faceting on the surface was highly crystallographic. Faceting ran both perpendicular and parallel to the crack for the short rise time steps of the test, but fewer perpendicular facets were evident at the longer rise times. The high sulfur material was heavily corroded throughout the fracture surface, and crystallographic faceting was seen for stages of the
Electrochemical tests were also performed at room temperature on both materials in pH 4 (using H2SO4), 7, and 10 (using NH40H). Peaks in the passive region of the high sulfur material were
seen at potentials of 160, 630, and 1400 mVsHE, due to dissolution of the MnS inclusions.
The results suggest that the high sulfur material provides an increase in corrosion when exposed to the environment, which leads to the retardation of crack growth rates at the longer rise times due to prolonged exposure of the crack tip to the environment. At low stress ratios, the proposed mechanism for retardation of crack growth rates is crack tip closure, due to a buildup of corrosion product at the fracture surface, which lowers the effective load that the crack tip experiences. At high stress ratios, the proposed mechanism for retardation is an increased in injected vacancies and enhanced creep, which disrupt the slip bands ahead of the crack tip, reducing the crack tip stresses. Fractography of the fracture surface and crack growth rate comparisons of the low and high sulfur material provide supportive evidence for the proposed mechanisms, and further work is proposed to examine the effect of increased corrosion ahead of the crack tip.
Thesis Supervisor: Ronald G. Ballinger
Acknowledgements
First, I would like to express my sincerest appreciation to my advisor, Professor Ronald Ballinger. Without his guidance, wisdom, and ideas, this project would not have been possible. I am extremely grateful for his expertise, through which I have learned both inside and outside of the classroom. He has brought new ideas and topics to the table throughout this project, progressing the subject above and beyond its original form.
I would like to thank Dr. Denise Paraventi, my fellowship mentor at Bettis Atomic Power
Laboratory. The amount she has taught me through this process is immeasurable, and her guidance, both professional and personal, has been above and beyond a mentorship role. From challenging engineering concepts that she has illuminated, to difficult times that she has helped me overcome,
I cannot thank her enough.This project is a result of years of previous research and study performed
in part by Bill Mills. In the short amount of time I spent learning from him, I was able to develop skills in both fractography and corrosion fatigue, and his wealth of knowledge, along with his friendship and patience, will be sorely missed.
I would also like to thank everyone at Bettis Atomic Power Laboratory that has guided and helped
me through this process, including Bill Moshier, Tom Webb, Earl Johns, Bryan Miller, and Kevin Fisher. I would also like to thank the countless other coworkers who have helped me prepare specimens, navigate the lab, and learn various concepts. I look forward to working with all of them in the future.
I would like to thank the other researchers I have had the pleasure of working with at MIT. I would
like to express my sincerest thanks to Dr. Yusaku Maruno, who not only helped significantly with the electrochemistry portion of this project, but also helped greatly in all portions of the work that was performed. His expertise and friendship has made this work successful. Special thanks to Pete Stahle, without whom I would not have been able to complete this project. From start to finish, his
I would like to thank Rachel Clark for her help as part of the Undergraduate Research
Opportunities Program at MIT. Her participation, both small and large, was an important part of this work.
I would like to thank Van Christie at Altran Solutions, Inc., for his help in the fractography of the high sulfur material that was studied.
Last but not least, I would like to thank my family, including my parents, David and Phylis O'Brien, and my brother, Matthew O'Brien. They have been a solid foundation throughout my education, and their encouragements have helped me overcome many difficult times.
This research project was performed as a collaboration between Bechtel Marine Propulsion Corporation: Bettis Atomic Power Laboratory and MIT. Targeted, specific experiments were performed at MIT to expand upon a large database of experimental data from Bettis. Microscopy, experimental work, and knowledge were shared between both sites in order to complete this research.
This research was performed under appointment to the Rickover Fellowship Program in Nuclear Engineering sponsored by Naval Reactors Division of the U.S. Department of Energy.
Table of Contents
A b stract ... 2
Table of Figures ... 8
Chapter -Introduction...16
1.1 Environm ental D egradation of N uclear M aterials ... 16
1.2 Enhancement and Retardation of Fatigue Crack Growth in Austenitic Stainless Steels ... 17
1.3 Research Objectives ... 22
Chapter 2 - Background...24
2.1 Corrosion Fatigue...24
2.2 A SM E A ir Curves ... 25
2.3 PW R Environm ent ... 27
2.4 Environm ental Enhancem ent ... 29
2.4.1 Proposed Mechanisms for Environmental Acceleration...29
2.4.2 W ater Flow Rate ... 32
2.4.3 W ater Tem perature ... 36
2.4.4 Rise Tim e...41
2.4.5 Stress Ratio and AK ... 44
2.5 Environm ental Crack Retardation... 46
2.5.1 Proposed Mechanisms for Retardation in Corrosion Fatigue ... 47
2.5.2 Sulfur Content... 50
Chapter 3 -Experim ental...53
3.1 A utoclave System ... 53
3.1.1 Autoclave Conditioning and pH Control ... 54
3.1.2 A utoclave Load Control System ... 57
3.1.3 D ata A cquisition and Test Data ... 57
4.1.2 Fractography ... 66
4.1.3 Optical M icroscopy ... 76
4.2 High Sulfur Material (Heat A16830-Specimen A16-LR-10) ... 78
4.2.1 Crack Growth Rate Testing ... 78
4.2.2 Fractography ... 82
4.2.3 Optical M icroscopy ... 91
Chapter 5 - Electrochem istry Results... 93
5.1 Cyclic Polarization ... 93
5.2 Optical M icroscopy (after Polarization Tests) ... 96
5.3 Potentiostatic Tests ... 96
Chapter 6 -D iscussion...98
6.1 Crack G row th Rate Com parisons... 98
6.2 Effect of Sulfur (w ith Respect to Proposed M echanism s)...104
Chapter 7 - Conclusions and Future W ork...108
7.1 Conclusions for Proposed M echanism s ... 108
7.2 Future W ork Recom m endations...109
References...110
Appendix A -Load Cell Calibration...112
Appendix B - Crack G rowth Rate D ata ... 114
Table of Figures
Figure 1: Time domain plot of crack growth rates in a PWR environment, shown for a range of tem p eratu res. [2 ] ... 18
Figure 2: Crack growth rates as a function of rise time, shown for a range of stress ratio (R) and A K . [2 ]... 18
Figure 3: Crack growth rate given as a time domain plot with equivalent ASME air rates. Both low sulfur heats, shown in red and yellow, have sulfur contents of 0.0005 wt%, and show fully enhanced rates close to those predicted by the dotted line. The high sulfur heat has a sulfur content of 0.034 wt%, and results are close to crack growth rates predicted by the ASME air rates. The test was conducted under short rise times, with an R of 0.7, at 2500C. [8]... 20
Figure 4: Crack growth under SCC of stainless steel in high purity water. [3]... 21 Figure 5: Fatigue Striations. Striations, when the distance between each striation is measured,
can often provide an estimate of the macroscopic crack growth rate. [3] ... 25
Figure 6: ASME air curves, predicting crack growth rates for room temperature and 2880C at a
ran ge o f R v alu es. [4 ]... 2 6
Figure 7: Evaluation of proposed crack growth rates from PWR curve with respect to
experimental data. Test parameters are given in the upper left corner. [10] ... 28
Figure 8: Blitzkrieg process. Panel (a) shows the crack advance process. When a crack resistant area is found, such as in (b), the crack proceeds around in the area, though more susceptible areas. Once the crack overtakes the area, the crack can then grow along the edges of the crack resistant area, due to environmental attack, as seen in (c). [3] ... 331
Figure 9: Crack growth rate as a function of AK under various rise times and flow conditions. Arrows denote crack growth rates that decreased or increased over time. Open symbols denote
low flow, while closed symbols are used for high flow conditions. Red squares are used for
tR=0.85 minutes, blue triangles for tR=8.5 minutes. The data designated by green diamonds was produced after the data in red and blue are produced. The high flow pump was then shut off, where the rates shown by red circles were produced. The high flow pump was then reinitiated, producing the data shown as purple diamonds. [2]...33
Figure 11: Crack growth rate as a function of rise time for two temperatures. Heat B is a 304 stainless steel with sulfur content <0.01 wt%. For both temperatures, crack growth rate decreases at a 500 second rise tim e. [7] ... 377
Figure 12: Fatigue crack growth surface in room temperature air, with irregular and rough faceting, (a). Fatigue crack growth in 288"C air, with faceting more crystallographic in nature,
(b). Fatigue crack growth in 288"C, highly crystallographic, with obvious river patterning, (c),
L W R type w ater. [14] ... 399
Figure 13: Time domain plot of crack growth rates in a PWR environment, shown for a range of temperatures. The black and red arrows denote locations of retardation in environmental crack grow th rates. [2 ]... 4 04 0 Figure 14: Crack growth rates as a function of AK and rise time (tR). 2 ... 4141
Figure 15: Crack growth rates as a function of rise time for Heats A and B. Crack growth rates are similar at short rise times, but deviate at longer rise times. [5] ... 4242 Figure 16: Surface features for 50 s rise time (top of figure) and 1500 s rise time (bottom of
figure). The fan shaped lines in the bottom part of the figure are possible areas of crack tip b lu n tin g . [5 ]... 4 3 3 Figure 17: Crack growth rate as a function of AK and stress ratio. [5]... 444 Figure 18: Crack growth rate effect of stress ratio and AK as a function of rise time. The overall trend for the data is increasing crack growth with increasing rise time. [2]... 455
Figure 19: Time domain plot of crack growth rate as a function of stress ratio. [2] ... 466 Figure 20: Low R crack growth rate as a function of AK. Certain crack growth rates for Heat
61115 (intermediate sulfur) are retarded below the predicted values for full environmental
enh an cem ent. [3]... 4 8 Figure 21: Oxides from mating surfaces can be "smashed" together. [3] ... 49 Figure 22: IVEC mechanism. On the left, a fully enhanced crack tip is shown, having planar slip bands. On the right, a retarded crack tip is shown, as suggested by the IVEC mechanism, where the planar slip bands are disrupted, and the crack tip stresses are reduced. [3]... 50 Figure 23: Crack growth rate as a function of AK, for R of 0.1, 0.3. Green data points are high
sulfur material (Heat A16830), red data points are low sulfur material (Heat 42322). [3] ... 51
Figure 24: Potential-pH diagram for MnS in LWR environment. Estimated crack tip pH and potential values are show n in red. [17]... 52
Figure 26: Images of waterboard and pump on left. On the right, the fully closed fatigue machine is sh o w n . ... 5 6
Figure 27: On the left, the specimen setup is shown within the fatigue machine. On the right is an example of the computer software used to run the fatigue test... 56
Figure 28: Specim en orientation from ASTM E3... 59
Figure 29: Electrochemistry specimen (front and side views)... 60
Figure 30: Gamry electrochemical cell and electrode arrangements used for electrochemical m easu rem en ts... 6 0
Figure 31: Crack length versus time for low sulfur test specimen (Heat E5174)... 63 Figure 32: Sectioning of specimens for further analysis. Cuts were made using wire EDM
(copper w ire in a w ater bath). ... 64 Figure 33: Side measurement of the crack from one of the outside pieces of specimen... 64 Figure 34: Measurements of the crack length, as measured from the notch, along the specimen.65 Figure 35: Corrected crack growth rate values as a function of cycles for the low sulfur test specim en (H eat E5174)... 66
Figure 36: Crack surface from precrack (A), to Step 1 (5.1s tR, B), to Step 2 (51s tR, C). Image is
at 300x magnification. Blue marks show approximate changes in steps... 67
Figure 37: Crack surface from Step 2 (51s tR, C), to stop Step 3 (51 Os tR, D), to Step 4 (5100s tR,
E ), to the fatigue apart (F)... 67
Figure 38: Step 1, 5.1 s rise time. Arrow A shows river patterns. Arrows B and C show areas where the cracking occurred perpendicular to the crack growth direction, which is possible
evidence for a B litzkrieg attack. ... 68
Figure 39: High magnification (1200x) of Step 1 (5.1 s tR)... 69
Figure 44: Step 3 (5 1Os tR) and Step 4 (5 100s tR). Step 4 starts at arrow 1, and the fatigue apart
starts at arrow 2 ... 74
Figure 45: Step 4 (5 100s tR). Arrow 1 shows an example of a grain boundary. Arrow 2 shows fatigue striations. The spacings were within a factor of 2 of the macroscopic crack growth rate fo r S tep 4 ... 7 5 Figure 46: Microstructure of the low sulfur test material (E5174)... 76
Figure 47: Microstructure of the low sulfur material (2739-LR-2)... 77
Figure 48: Crack growth rate versus time for high sulfur material (Heat A 16830)...80
Figure 49: Crack growth versus cycle for high sulfur material (Heat A 16830)... 81
Figure 50: DE correction for high sulfur material Heat A 16830...82
Figure 51: Entire fracture surface, with precrack (A), fatigue crack (B), Step 9 (51 00s tR, C) and fatigue apart (D ). ... 83
Figure 52: Example of fracture surface, which was heavily oxidized... 83
Figure 53: Fatigue surface covered in heavy layer of oxide... 84
Figure 54: Example of fatigue striations on the fracture surface... 85
Figure 55: Example of fatigue striations on the fracture surface. Striations were about 3 .2 p m ... . . 86
Figure 56: Fracture surface for the low stress ratio (R=04) portion of the test...87
Figure 57: Fracture surface for the high stress ratio (R=0.7) portion of the test. ... 88
Figure 58: Three steps (changes in rise times) of the fatigue test. Arrows show the transition in rise tim es on the fracture surface. ... 89
Figure 59: Fracture surface, with areas of crack arrest (A), heavy oxidation, and locations of M n S d isso lu tion (B , C ). ... 90
Figure 60: Fracture surface, with heavy oxidation and locations of MnS dissolution. ... 91
Figure 61: Optical microscopy for the high sulfur material (Heat A16830). ... 92
Figure 62: Cyclic polarization of the low and high sulfur materials. Peak in the passive region of the low sulfur material are most obvious at this pH of 10. ... 94
Figure 63: Cyclic polarization of the low and high sulfur materials. Peaks in the passive region of the high sulfur material are more obvious. Environment at pH 7. ... 95
Figure 64: Cyclic polarization of the three materials. Peaks in the passive region in the high sulfur material are not seen in the low sulfur materials. Environment at pH 4. ... 95
Figure 65: Surface appearance of high and low sulfur materials after potentiostatic tests. ... 96 Figure 66: Surface features after potentiostatic testing of high sulfur heat (Heat A 16830). Small pits are seen at 500x m agnification . ... . 97
Figure 67: Crack growth rate equations for air (ASME) and LWR-type environments. ... 99 Figure 68: Crack growth rates as a function of AK with JSME, ASME, and experimental data for the low sulfur m aterial. Stress ratio is R=0.4... 100
Figure 69: Crack growth rates as a function of AK with JSME, ASME, and experimental data for the high sulfur m aterial. Stress ratio is R =0.4. ... 10 1
Figure 70: Crack growth rates as a function of AK with JSME, ASME, and experimental data for the high sulfur m aterial. Stress ratio is R =0.7. ... 102
Figure 71 : Crack growth rates as a function of rise time for low and high sulfur materials...103 Figure 72: Comparison between high (A) sulfur and low (B) sulfur materials at R=0.4, tR >5I Os.
The arrow in A shows an example of an area where the corrosion product appeared damaged, due to crack closure. The change in appearance of the oxides, in both shape and amount, is ob v iou s b etw een th e tw o im ages. ... 104
Figure 73: Comparison between high (A) sulfur and low (B) sulfur materials at R=0. 1, 0.3. Features are sim ilar to those in Figure 72. [3]...105 Figure 74: Step 9 (5100 s tR) of the high sulfur specimen. There is less cleavage faceting, and the
fracture features are nondescript, as compared to fractrography from shorter rise times in Chapter 4 . ... 1 0 6
Figure 78: Applied Load Readings from Model #1020AJ-25K-B; Serial #186674A...113 Figure 79: Comparison of load vs. voltage between Instron load cell, left, and WMC-5000
c a lib ra te d lo a d c e ll, rig h t. ... 1 1 3
Figure 80: Crack length vs. time for Step #1 (5.1 second rise time) for the low sulfur heat. ... 114 Figure 81: Crack length vs. time for Step #2 (51 second rise time) for the low sulfur heat. ... 114 Figure 82: Crack length vs. time for Step #3 (510 second rise time) for the low sulfur heat. ... 115 Figure 83: Crack length vs. time for Step #4 (5100 second rise time) for the low sulfur heat.
... 1 1 5 Figure 84: Crack length vs. time for Step #1 (5.1 second rise time) for the high sulfur heat.
... ... . ... 1 1 6
Figure 85:. Crack length vs. time for Step #2 (51 second rise time) for the high sulfur heat.
... 1 1 6
Figure 86: Crack length vs. time for Step #3-1st Section (510 second rise time) for the high
sulfur heat. ... 117
Figure 87: Crack length vs. time for Step #3-2nd Section (510 second rise time) for the high
sulfur heat. ... 117
Figure 88: Crack length vs. time for Step #4 (5.1 second rise time) for the high sulfur heat...118 Figure 89: Crack length vs. time for Step #5 (5100 second rise time) for the high sulfur heat... 118
Figure 90: Crack length vs. time for Step #6 (5.1 second rise time) for the high sulfur heat. 119
Figure 91: Crack length vs. time for Step #7 (51 second rise time) for the high sulfur heat. ... 119
Figure 92: Crack length vs. time for Step #8 (5100 second rise time) for the high sulfur heat....120 Figure 93: Crack length vs. time for Step #9 (5100 second rise time) for the high sulfur heat....120 Figure 94: Example of Pre-Treatment for Potentiostatic Specimens. ... 121
Figure 95: Results of Potentiostatic Test at 220mVsHE for High S Specimens in 0.1N Na2 S04 S o lu tio n (p H 7 ) . ... 1 2 1
Figure 96: Results of Potentiostatic Test at 650mVSHE for High S Specimens in 0.1N Na2 S04 S o lu tio n (p H 7 ) . ... 1 2 2
List of Abbreviations and Symbols
APW Aerated Pressurized Water
BWR Boiling Water Reactor
CT Compact Tension
da/dN Crack growth/Cycle
DPW Deaerated Pressurized Water
DSA Dynamic Strain Aging
EDM Electrical Discharge Machining
EDX Energy-Dispersive X-ray Spectroscopy
EAC Environmentally Assisted Cracking
FCGR Fatigue Crack Growth Rate
HIC Hydrogen Induced Cracking
LWR Light Water Reactor
MnS Manganese Sulfide
Kmax Maximum Stress Intensity Factor
PWR Pressurized Water Reactor
AK Range in Stress Intensity Factor, Kmax-Kmin
tR Rise Time
SEM Scanning Electron Microscopy
SCC Stress Corrosion Cracking
Chapter 1 - Introduction
1.1 Environmental Degradation of Nuclear Materials
Material performance is often a limiting factor for nuclear power plant design and operations; parameters such as peak fuel temperature, heat transfer, performance during transients, and neutron flux, to name a few, set limits on material performance. Material selection is a critical part of the design process to ensure safe and economic operation. In a corrosive environment, such as that found in a water cooled nuclear reactor, component lifetimes are often estimated using a combination of experimental data and conservative estimates. However, component behavior estimates are often still uncertain, resulting in parts that either fail before their estimated lifetime (often from a misunderstanding of how the material behaves in the chosen environment) or that require replacement due to manifestations of degradation phenomenon unknown at the design stage, or estimates that are too conservative, resulting in economical poor operations (unnecessary inspections, etc.). Both of these outcomes are costly, but in many cases could have been mitigated
by a better understanding of the mechanisms underlying material response in the environment.
Environmental degradation in the form of stress corrosion cracking, hydrogen embrittlement, corrosion fatigue, or a combination of these, is often the limiting factors for material performance in a Light Water Reactor (LWR). Specifically, austenitic stainless steels, which are used extensively in Pressurized Water Reactor (PWR) and Boiling Water Reactor (BWR) system components, are susceptible to corrosion fatigue crack growth when exposed to the LWR environment. The extent of cracking is dependent on the material chemistry, water chemistry (including temperature), and mechanical loading conditions. For instance, laboratory testing of
stainless steels in LWR environments both in fatigue life (S-N) testing and fatigue crack growth testing have shown reduced cycles to failure and increases in measured crack growth rates by factors of up to 100 over those in air. [1,2,3] As a result, the industry has been working to revise
conservative factors lead to reduced calculated lifetimes and potentially increased inspection intervals, increasing cost. While emphasis in recent years has been on fatigue life, there has also been work on factoring environmental effects on the crack growth rate curves. The focus of this work is on the crack growth rate behavior in high temperature water as a function of material chemistry.
1.2 Enhancement and Retardation of Fatigue Crack Growth in Austenitic Stainless Steels
Experimental data and lifetime performance in LWRs of stainless steels show that fatigue crack growth is greatly accelerated in a PWR environment compared to air. [5] On the primary
side, a PWR operates at 15.2 MPa and at about 2870C to 324'C, with deaerated, high purity water
(< 5ppb 02). In high temperature, deaerated water, the environmental enhancement of the crack growth rates increases with increasing temperature, well over the rates predicted by the ASME air curves. Figure 1 shows an example of environmental enhancement of FCGRs for a low sulfur
(0.001 wt%) austenitic stainless steel in PWR water. [2] Shown in Figure 1 are the rates predicted by the ASME curve in air, compared to the measured rates in high temperature water, with the
different temperatures denoted by the symbols. The dashed line represents the one-to-one line where the air rates equal the high temperature water rates. Deviations from the one-to-one line (above the line) indicate environmental enhancement. As the temperature is increased, crack growth rates also increase, further deviating from the ASME air rates. Experimental crack growth rates vary in the extent of enhancement, due to the effects of test conditions including the stress ratio R (ratio of minimum to maximum load, P), rise time (the length of time the load is increasing in the total cycle), and the range in stress intensity factor, AK. [2] Figure 2 shows an example of the effect of rise time on crack growth rates during trapezoidal loading as a function of rise time and stress ratio for austenitic stainless steel. It is observed that the crack growth rates increase with increasing rise time in most cases, indicating increases in environmental enhancement at longer the rise times.
PWR waO R-0, 7 -0 8 A2W0L *02=U A' 250~~
1.OE-13 1.OE-12 1.0E-11
dWt* (sk) U S
1.OE-10 1.0E-09 1.OE-08
Figure 1: Time domain temperatures. [2] 1.OE05 T I .OE06 I.OE-0 1.OE-09 1
plot of crack growth rates in a PWR environment, shown for a range of
-
-.O 0
10 100 1000
Me dw I sws
10000 10
Figure 2: Crack growth rates as a function of rise time, AK. [2]
shown for a range of stress ratio (R) and
'I 1.0E-12 -1.OE-14 AK vakue in MPaan a ",4 1. Deft K 41* a R-03. Do". K labS OR-01 DeaK-11 ER-C.7 De.a X 12-15 R-as Do"K 1-10 *R-00 Do"ta9b4 *R.0. DWI& K 4-300C 0 .. .. ... . .. . ... i.OE-07 A
high temperatures (around 300'C, shown in Figure 1 at 300'C) [2], certain material chemistries
(high sulfur) [7], specific loading conditions (high R) [2,7], and at longer rise times under
trapezoidal loading. [8]
The focus of this thesis is on the effect of material chemistry on crack growth rates, specifically the sulfur content, which has been shown to slow environmentally enhanced crack growth rates in austenitic stainless steels with high sulfur content (but still within the ASTM specifications). In this thesis, compositional ranges of sulfur chemistry are defined in Table 1. The effect of material sulfur content on environmental cracking has been observed in both corrosion fatigue (under long cycle times), as shown in Figure 3, and stress corrosion cracking (SCC), as shown in Figure 4. The results for the high sulfur heat shown in Figure 3 show retardation of the crack growth rates compared to those predicted by the ASME air curve. This is shown by the blue data points, designating a high sulfur material, which fall along the ASME air curve prediction, whereas the red and yellow data points, designated for low sulfur materials, are at higher rates, close to those predicted for environmentally enhanced crack growth rates. The test in Figure 3 was a rise time test, with rise times from 5.1 s to 600s. In SCC tests, the high sulfur heat crack growth rates, shown in Figure 4 as the dark blue data, appear to fall to rates that are below measureable at around 2000 hours. Tests were performed with sensitized and cold worked with specimens with low (Heat ECT-57) and high (Heat GCT-40) sulfur in aerated and deaerated pressurized water
(APW and DPW). The specimens were initially in the environment at 249"C with Ippm 02 (APW)
for 1700 hours. The environment was then degassed and hydrogen added to obtain (30cc/kg) DPW conditions. The first 1891 hours was performed with a load cycle of 9000s, and then held at constant load after until 3019 hours, when unload and load cycles of 12 (at 3370 hours) and 24 (at
3845 hours) hours were introduced. Finally, constant load was applied at 4152 hours. The
corrosion potential for 304 stainless steel is shown in purple at the top of the figure. SCC tests are relevant to corrosion fatigue at long rise times because the low frequency of the loading pattern in fatigue approaches static conditions. The environmental effect is increased in SCC and longer rise time fatigue tests, compared to shorter rise times.
Table 1: Compositional ranges for sulfur in austenitic stainless steel.
Designation Compositional Range
Low sulfur chemistry 0.001-0.002 wt%
Intermediate sulfur chemistry 0.005-0.0012 wt%
High sulfur chemistry 0.030-0.015 wt%,
AK - 5MPa m, R=0.7
(Blue-High Sulfur) fully enhanced, (Red, Yellow-Low Sulfur) non-enhanced rates throughout
1 ~ I WA I WF-u 1 OF-14 A * 01 4. SE WO A )W Al wh~aA JL a JJ 1IFA
A ME )a crack g#me tiso mas
Figure 3: Crack growth rate given as a time domain plot with equivalent ASME air rates. Both low sulfur heats, shown in red and yellow, have sulfur contents of 0.0005 wt%, and show fully enhanced rates close to those predicted by the dotted line. The high sulfur heat has a sulfur content of 0.034 wt%, and results are close to crack growth rates predicted by the ASME air rates. The test was conducted under short rise times (5.1s to 210s), with an R of 0.7, at 250*C. [8]
1 20 I 249'C Nonfaulted APW/DPW 200 -200 IE -400 L -600 -800 W ( 5'x10 1(5x1O ) 0 " (1 1x10⁴) 21 (6x10') xeo) 29.9 E MPa m 0x0' z 20 27.7 MPavm S (datdt=5x006 minis) 19 . (4x1 __ 25.7 (6x10⁴) I (6x10 )f(9x10) MPa8m 18 24.0
(da/dt=2x10' mmnis) C ECT-47 (R-L, 10%CW, 0.001%S) MPa m
o GCT-31 (R-L, 10%CW, 0.026%S)
0 1000 2000 3000 4000 5000
TIME, hours
Figure 4: Crack growth under SCC of stainless steel in high purity water. [3]
The retardation effect of high sulfur content is not observed in all types of steels, and the increase in the corrosive environment as the MnS particles (which are prevalent in high sulfur steels) dissolve often has a negative effect on component lifetime. This is the case with ferritic (low alloy) steels, where a high sulfur content will lead to an enhancement in environmentally assisted cracking. [9] Nonetheless, it could be beneficial to lifetime analyses if reduced FCGRs can be justified for austenitic stainless steels in specific environments. However, in order to account for the retardation effects that are seen in austenitic stainless steels on the prediction of crack growth rates, a better understanding of the underlying mechanism is necessary.
1.3 Research Objectives
The goal of this thesis is to
* Examine the effect of sulfur on the corrosion fatigue behavior of austenitic stainless steels in high pH LWR-like environments, and
" Provide additional insight into the likely mechanisms controlling retardation of fatigue
crack growth in higher sulfur material.
To accomplish the above goals, the areas of focus will include FCGR testing and electrochemical characterization of low and high sulfur containing 304/304L stainless steel heats to fully quantify the effect of high sulfur on fatigue crack growth. Fractographic analysis including Scanning Electron Microscopy (SEM) and metallographic analysis of the fracture surfaces were also performed. The discussion below further expands upon the tasks that will be used to accomplish the goals.
1. Materials & Characterization: Two low carbon (304L) heats of stainless steels were used
in the program. Their chemistries are provided in Table 2. Material included a low sulfur material (Heat E5174, used to develop techniques and analysis) and a high sulfur material (Heat A16830). The high sulfur material was at the maximum allowed by the ASTM specification (A666, 0.030 wt%). Materials were characterized using standard metallographic as well as electrochemical techniques.
Special Note: The low sulfur heat had a higher than normal, but still within specification, boron content of 18ppm. This resulted in the precipitation of (Cr,Fe)2B-type borides which may have affected the corrosion behavior. However, there was no observed effect on the FCGR when compared with other lower sulfur material from the literature.
Table 2: Material Chemistries (wt%)
Heat C Mn S Cr Ni N Fe
E5174 (Low Sulfur) 0.02 1.6 <0.0025 19.8 10.1 0.085 Bal
A16830 (High Sulfur) 0.021 1.73 0.032 18.5 8.2 0.089 Bal
3. Post-Test Characterization: Post-test analysis of fracture surfaces using SEM and other
metallographic techniques to provide insights into the nature of the processes involved in controlling behavior.
Chapter 2 - Background
2.1 Corrosion Fatigue
Corrosion fatigue is the result of the combined effects of cyclic stresses, a susceptible material, and a corrosive environment. [9] Cyclic stresses during corrosion fatigue are defined by parameters such as frequency of the loading cycle, stress ratio (the ratio of the minimum load to the maximum load, R), cyclic stress intensity (AK), and rise time of the cycle for trapezoidal
loading (tR). Failure of materials due to corrosion fatigue processes occurs at much lower stresses than failure due to static loads, or failure due to cyclic loads in air. Furthermore, crack initiation and growth can occur even faster when the material contains stress risers, such as notches, which increase local stresses and susceptibility to corrosion fatigue. Both alloys and pure metals are susceptible to corrosion fatigue. [9]
Failure due to corrosion fatigue, rather than other environmental cracking phenomena such as SCC and hydrogen induced cracking (HIC), can be confirmed, at least in part, through study of the fracture surface. Several surface features offer clues as to the nature of the crack growth mechanism, such as crack growth rate, crack arrest, and crack propagation direction. Crack growth in fatigue is often transgranular in nature (both SCC and HIC can be either transgranular or intergranular), and the crack tip will appear blunted. Striations, a result of the crack opening in increments as the load is applied cyclically, are unique to corrosion fatigue, and can be used to determine the macroscopic da/dN (crack growth per cycle, or change in crack length with cycle). Figure 5 shows an example of clearly defined striations, which appear as periodic ripples on the crack surface. Striations appear perpendicular to the cracking direction. Crack arrest, or a change in crack growth in which the crack propagation rate is changed from one rate to another, can result
in a macroscopic "beach mark" on the surface due to the buildup of corrosion products or a change in the character of the propagation process. [3,8]
Figure 5: Fatigue Striations. Striations, when the distance between each striation is measured, can often provide an estimate of the macroscopic crack growth rate. [3]
2.2 ASME Air Curves
To account for fatigue crack growth in design and performance of stainless steels at a given stress ratio and temperature in air, the ASME air curve can be used. [4] The ASME air rates as a function of applied AK for austenitic stainless steels are shown in Figure 6, for multiple stress ratios for room temperature (21"C) and a higher temperature (288"C), such as those temperatures seen in an LWR environment. Crack growth rate curves are plotted in inches per cycle as a function of the cyclic stress intensity factor, AK. To predict corrosion fatigue crack growth in an environment, experimental data is used to determine conservative factors that can be applied to
ASME reference curves in air, which can then be used to predict component lifetime. Although
based on experimental results, these predictions still contain considerable uncertainty due to the lack of mechanistic understanding of the environmental processes that can enhance or retard the crack growth rates; these include varying load conditions during operation, material chemistry, or environmental factors, and can greatly affect the crack growth rate. Enhancement of crack growth rates above the air curve can be as high as 100 times the predicted value [3], while retardation under some loading and material conditions can produce environmental crack growth rates that approach those values observed in air.
~-t--T -~ r
111271A:
1I
2 U I 1111I11rA.'Ii U IIvv Ill, VIA 9 I* j 1J. F~U4 1sN&W _ OSUMM 9" C-28 goFigure 6: ASME air curves, range of R values. [4]
predicting crack growth rates for room temperature and 288"C at a It, 1-A'
I
I
104 A r. E-WS' 104 Son I- -t Li * I r 12.3 PWR environment
In the United States, the most common LWR type is the PWR, which is comprised of a primary coolant system which operates at a pressure of 15.2 MPa to maintain a single phase in the water that is used for cooling and neutron moderation, and a secondary heat transfer side (via a steam generator) that operates at a maximum pressure of approximately 6.9 MPa. PWRs are markedly different from another, less common LWR, the BWR, which operates using a direct cycle. The two systems differ in such areas as water chemistry and operating conditions. PWR primary side environments contain several important features that can play a large role in materials performance, especially environmentally enhanced fatigue crack growth and stress corrosion
cracking (SCC). PWR coolant and moderator temperature ranges from about 2870C to 324'C on
the primary side. Plants operate with a hydrogen overpressure, and the 02 concentration is thus maintained at a minimum (less than 5 ppb), so PWR environments are much less oxidizing than BWR environments, which contain small amounts of oxygen due to air in-leakage as well as water radiolysis. This difference results in different performance of stainless steels in the two environments. Nomura et al. discussed the inappropriateness of the use of BWR fatigue crack growth curves that were prescribed by the Japan Society of Mechanical Engineers (JSME) in 2003 for austenitic stainless steels. [10] Due to the marked differences in water chemistry, as well as the lack of consideration for temperature effects in the BWR reference curves, these curves were judged to not be representative of PWR conditions. Instead, PWR curves were recommended based on calculations considering only data generated in PWR conditions, considering variations in temperature, stress ratio, and loading frequency. Material chemistry was not generally varied, or
accounted for, during experiments. Environmental temperatures tested were between 1 000C and
3500C. The stress ratio, R, was varied from 0.1 up to 0.95. The data, along with the proposed PWR
curve, is shown in Figure 7. The application of a factor of 2.7 multiplied by the reference curve gives a conservative estimate of FCGRs for almost all of the experimental data. The general forms of both the BWR and PWR corrosion fatigue crack growth curve equations are given in Equations 1 and 2, respectively, where C", n, m' and m are constants that depend on the environment, such as temperature (as given, there is no temperature dependence in the BWR reference curves). [10]
a = C- T r- AK"'/(1 - R)" dN da = 1.61X10~10 -T 0.63 -Tr O.33 - AK 3.0/(1 _ R) 1.56 dN
I
t
II
I
I
1.1-04 1.-06 .5-07 1 2 d.MHw4 35N1O'4AK' 231 a/ 3 n.1**
dam". 1.611 01A Aa ...2.4 Environmental Enhancement
It has been suggested that environmentally assisted crack growth is promoted by a critical concentration of dissolved sulfur at the crack tip, as studied by James et al. on low alloy steels. [11] This sulfur is a product of the dissolution in high temperature water of MnS inclusions that exist in low-alloy as well as stainless steels, which are detrimental to the corrosion fatigue properties of low-alloy steels; this is not necessarily true for stainless steels, as is discussed earlier. Since conditions at the crack tip can promote dissolution of the MnS inclusions one would expect that aqueous conditions (temperature, electrochemical potential, transport of species by diffusion, ion migration, convection) will have a strong effect on behavior. Furthermore, the combination of environmental conditions and mechanical loading conditions leads to a large degree of variation in crack growth rate behavior. It is important to note that the mechanisms for crack growth are different in low-alloy and stainless steels. Low-alloy steels experience hydrogen embrittlement ahead of the crack tip, whereas stainless steel crack growth is largely dependent on the state of the slip bands ahead of the crack. The potential effect of all variables is discussed below.
2.4.1 Proposed Mechanisms for Environmental Acceleration
The fracture surface for low AK regimes and high AK regimes have different appearances; at AK values below approximately 13 MPalm, crystallographic faceting dominates, whereas a combination of crystallographic faceting and fatigue striations is more dominant at higher values. The change in fracture morphology is hypothesized to be a result of differences in slip behavior between a large plastic zone that develops at the maximum load and a smaller plastic zone that develops during reversed cyclic loading. The existence of both crystallographic faceting and fatigue striations at higher AK suggests that there are two slip modes occurring in the different regions of the plastic zone. The largest zone, the cyclic plastic zone, which expands ahead of the crack tip, experiences heterogeneous slip: planar slip bands are weakened by heterogeneous slip mechanisms as hydrogen is diffused ahead of the crack, creating a path for faceting to occur. In the smaller, fully reversed plastic zone, homogenous slip is responsible for the creation of the striation formation. Crack growth at AK above 13 MPalm therefore results in striations that occur in addition to or within the crystallographic facets. Under low AK testing, both plastic zones
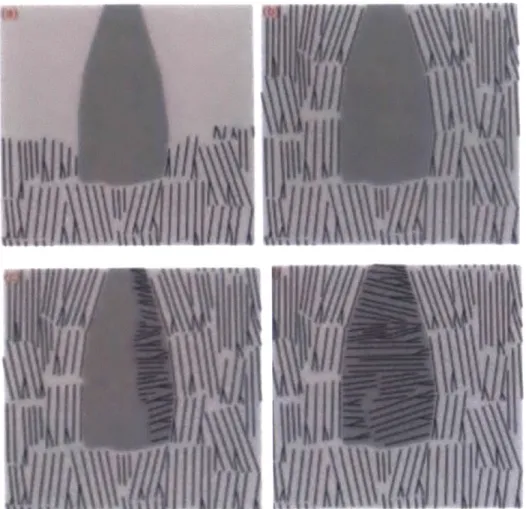
undergo the same heterogeneous slip. Mills also noted faceting that was oriented normal to the direction of crack propagation, the occurrence of which is described by him as "blitzkrieg" attack, because susceptible regions will grow quickly around crack resistant regions; the resistant region eventually will be "attacked" by cracking orthogonal to the primary growth direction as a result of high stresses developing in the uncracked region. This attack occurs at both low and high AK regimes, and allows for the crack growth to continue without arresting. Mills suggested that this process is due the presence of crack resistant areas, which the advancing crack will grow adjacent to, along less resistant regions. The edges of the crack resistant region will then undergo environmental attack, and the crack will grow along the more susceptible direction. The local crack growth direction will then appear perpendicular to the macroscopic crack growth direction. Figure
8 shows a schematic of the blitzkrieg attack, which is thought to contribute to the environmentally
enhanced cracks growth rates, due to the growth of the crack not being restricted by these crack resistant regions. [3]
Figure 88: Blitzkrieg process. Panel (a) shows the crack advance process. When a crack resistant area is found, such as in (b), the crack proceeds around in the area, though more susceptible areas. Once the crack overtakes the area, the crack can then grow along the edges of the crack resistant
area, due to environmental attack, as seen in (c). [3]
During corrosion fatigue, an additional process of dynamic strain aging (DSA) occurs in materials exhibiting both environmentally enhanced and retarded FCGRs. DSA is a phenomenon observed during high temperature tensile deformation, and manifests itself as "serrated yielding" in tensile tests. Interactions between dislocations and carbon and other interstitial atoms in the material result in temporary "pinning" of dislocations. Continued straining breaks the dislocations free from the carbon atmospheres; with sufficient diffusion the carbon moves to the dislocations again, resulting again in dislocation pinning. The pinning and unpinning of dislocations by carbon results in small load increases and decreases during deformation (the serrated yielding observed in the plastic regime of a tensile test). [12] During fatigue crack growth, DSA can occur and cause
the crack growth to experience bursts of plastic deformation, and they can appear as "super" striations the crack surface, although they do not correspond to the macroscopic crack growth rates. Even though they may blunt the crack tip, as the crack is briefly arrested, they do not lead to a change in macroscopic crack growth rate; the crack arrest is temporary, and is reinitiated easily along the same path. Furthermore, DSA events appear in both low and high sulfur materials, and therefore is not expected to be the mechanism leading to retardation of the environmentally enhanced crack growth rate. [3]
2.4.2 Water Flow Rate
Sulfur can be removed via various types of mass transport (diffusion, convection, ion migration), and therefore transport into and out of the crack tip can influence the crack growth behavior. [11] In an LWR environment, the mass flow rate of the coolant can be as high as 20000 kg/s (Reynolds number of 500000), which can have a strong effect on chemistry within a crack tip and the movement or removal of species and corrosion products within the crack face. [13] Tice et al. modified fatigue crack growth rate testing for austenitic stainless steels in order to create a turbulent, rather than quasi-static (which is generally assumed for corrosion fatigue testing), flow rate environment around the compact tension (CT) specimen in order to study the effect of flow rate on FCGR. His results are shown in Figure 9. Under turbulent/high flow (with a flow rate of 20 L/min, around a Reynolds number of 200000), the crack growth rates are about 2 times lower than those in quasi-stagnant conditions. His test was performed at 2500C, with an R of 0.7. Rise
times are reported on the figure in the upper left hand comer. For austenitic stainless steels with low sulfur content, as was used in Figure 9, crack growth rates would be expected to increase with increase in rise time. In terms of flow, the crack growth rates decrease in turbulent flow over the quasi-static flow crack growth rates. [2]
1.OE-06
00.05min Low Flow a .5min Low Flow
0 86mWn High Flow
& 8.6min High Flow
* 51min High Flow
* 51min Low Flow
o 8.5 min Low Flow
* S1min Low Flow
* 61min High Flow
6 ASME XIA R-0
1
.E-9Arrows show time dependent changes
to growth rate
1.OE-08
1.0 10.0 100,0
K / MPUIm
Figure 9: Crack growth rate as a function of AK under various rise times and flow conditions. Arrows denote crack growth rates that decreased or increased over time. Open symbols denote low flow, while closed symbols are used for high flow conditions. Red squares are used for tR=0.8 5
minutes, blue triangles for tR=8.5 minutes. The data designated by green diamonds was produced after the data in red and blue are produced. The high flow pump was then shut off, where the rates shown by red circles were produced. The high flow pump was then reinitiated, producing the data shown as purple diamonds. [2]
James et al. also investigated the mitigating effect of water flow rate, this time on SCC in low alloy steel, which again may apply to FCGR testing at long rise times. [11, 14] He conducted experiments using flow rates of 78.9 L/min, 27.0 L/min, and 8.69 L/min with corresponding Reynolds numbers of 643000, 221000, and 72200, respectively. Materials used had high sulfur
contents, ranging from 0.024-0.027 sulfur (wt.%). [11] Specimens were machined to include a semi-elliptical surface crack in order to provide easier mass transport. Test conditions were similar to an LWR environment, with a temperature of 288"C and a pressure of 15.2 MPa. The results of his experiments are shown in Figure 10. The highest flow rate shows a complete mitigation of environmentally enhanced cracking, while the intermediate flow rate also shows some success in mitigating environmental effects to well below the environmentally assisted cracking (EAC) line. The lowest flow rate results demonstrate a lack of EAC mitigation, suggesting flushing of the crack tip to remove the deleterious sulfur species led to migration of the cracking, which contributes to environmental enhancement in low alloy steels. Water flow rate, therefore, may be one of the largest contributors to the presence (or lack thereof) of EAC under the conditions of his experiments, at least for the removal of harmful species, and when no other competing retardation mechanism is at play (as discussed in Section 2.5). Since his experimental conditions were similar to those in a PWR, this behavior could at least partially explain the general lack of environmentally assisted fatigue cracking over a reactor's lifetime under actual plant conditions, especially if
t5.4 1E-4
Ip
c.1
ommn
4444 "Msme bee d 4 64640 141 WIP 1546 1646 144TkmeSmd
Ak
Rim,mvoboend
Figure 10: Time domain plot of low-alloy, high sulfur steel. Under low flow (denoted by squares), crack growth rates are well predicted by previous methodology assuming full environmental enhancement at the test temperature, at both the surface and deepest penetration of the crack. Under high flow, denoted by triangles, these rates drop below both the prediction for no environmnetal enhancement, as well as the ASME air rates. [11]
James et al., in a second report, [14] also studied the effect of water flow rate on low-alloy steel (high sulfur) that was overlaid with corrosion resistant cladding of Alloy EN82H (low sulfur), in order to study the flow pattern changes, as well as galvanic effects that could impact transport of dissolved sulfur from the crack tip. Flow velocities of 1.69 and 4.74 m/s were used, corresponding to the intermediate and high velocities used in Reference 11. Unlike previous results from James et al. [11], the high flow rate did not mitigate EAC with as much success as the unclad specimens, and effects of the high flow were not seen until the very end of the test (around 2200
hours, only for a flow rate of 4.74 m/s). Computational Fluid Dynamics (CFD) modeling using the
FIDAP code (Fluid Dynamics International) demonstrated hindrance of flow to the crack tip region due to the cladding, which further implies that mass transport at the crack tip is successful at mitigating EAC. The CFD code was used to evaluate the mass transport that occurred within the
crack, accounting for the crack, the surface surrounding the crack, and the free stream flow. The cladding provided a greater surface roughness on the surface of the crack, impeding the free flow of species from the crack tip; sulfur species were not as easily removed as they had been in the previously non-clad specimens. [14]
In austenitic stainless steel, Tice et al. [2] reported that the effect of flow rate is similar to that of low-alloy steels, but disagreed that the environmental enhancement was due to sulfur species. Due to the lower crack growth rates of stainless steel in oxygenated high temperature water, in which sulfides remain at the crack tip due to the electrochemical potential gradient, Tice suggested that sulfides were not the species responsible. He suggested that some other soluble species was responsible.
2.4.3 Water Temperature
Wire et al. performed fatigue tests at 288'C and 243'C in order to measure the temperature dependence of the FCGR of austenitic stainless steels. [7] His data was obtained at a temperature of 288"C under a fully reversed stress ratio (R=-1) and at high stress ratios (R=0.7, 0.83), and had produced rates that were as high as 20 times those in air. Experimental conditions were LWR-type, with a pH from 10.1 to 10.3, and 02<20 ppb. Figure 11 shows the crack growth rate as a function of rise time and temperature. Measurements taken at the lower temperature showed lower crack growth rates at rise times of 5 and 50 seconds than the higher temperature, though the lower temperature rates were still accelerated above the air data by 7-8 times. At the longest rise time of
5000 seconds, both temperatures produced similar crack growth rates. The crack growth rates at 288"C were lower at the 500 second rise time than at the 50 second rise time for this temperature,
suggesting a retardation mechanism. The possible explanation for this retardation is the increased sulfur content in the material, discussed in Section 2.5.
10-1
U
0
Ak RoO.7. 8K1I I WAPdm
10 100 1000
Me
Time,
s
Figure 91: Crack growth rate as a function of rise time for two temperatures. Heat B is a 304 stainless steel with sulfur content <0.01 wt%. For both temperatures, crack growth rate decreases at a 500 second rise time. [7]
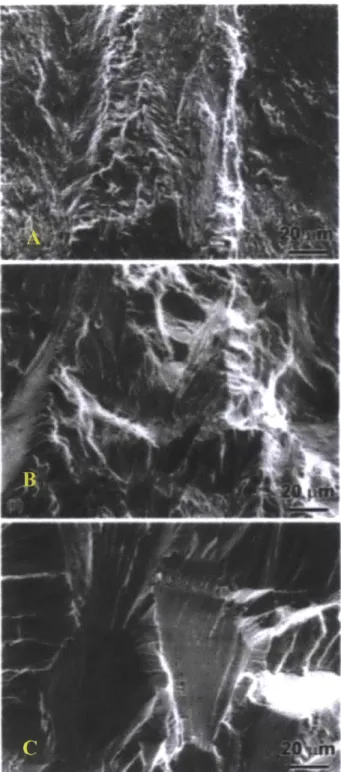
In an attempt to qualify the effects of environmental enhancement and retardation, Wire and Mills presented fractographic evidence to describe and characterize the different regimes of cracking. [15] Figure 12 shows three fractographs of 304 stainless steel (low sulfur), for material tested in room temperature air (240C), 2880C air, and 288"C water (LWR-type). The images in
Figure 12 show features that exemplify the testing condition. Fatigue tests were performed under different stress ratios and rise times, but the fractography is discussed only for temperature and environment changes. At room temperature, facets were irregular, compared to the more crystallographic nature of the facets in air at 288"C. Since the temperature for martensitic transformation is 100"C, the test in air at 2880C is above the temperature for martensite to form
upon cold working, which explains the lack of quasi-cleavage faceting in the higher temperature, and there are clear river patterns on the specimen face following the crack growth direction. [15] Under high temperature water conditions, facets are crystallographic, as opposed to rough and irregular in air. The river patterns are even more visible and crisp in high temperature water (as
:R4.7,1S1-13MPaan
o
2A 24ft
opposed to 288'C air), and are observed for all environmentally enhanced crack growth rates. Furthermore, for the high temperature water conditions, the crack paths (direction) in specific areas can deviate from the overall crack path, which is a result of specific regions of susceptibility and hydrogen embrittlement that occurs in water, and the authors suggested that these regions contributed to the enhanced rates observed in this environment. Susceptibility is relative; resistant ligaments in the material will hinder crack growth in that direction, forcing the crack to locally grow in less resistant directions. Lastly, the appearance of cleavage-like sharp facets at high temperature (in water) suggests a hydrogen embrittlement mechanism, due to absorption of hydrogen from the environment into the crack tip. [15]
Figure 12: Fatigue crack growth surface in room temperature air, with irregular and rough faceting, (a). Fatigue crack growth in 288C air, with faceting more crystallographic in nature, (b). Fatigue
crack growth in 2880C, highly crystallographic, with obvious river patterning, (c), LWR type
In addition to the previously discussed research of Wire and Mills [15] regarding temperature effects, Tice et al. also investigated the influence of four different temperatures on fatigue crack growth in a PWR environment. [2] Their results are shown in Figure 13. The results show an increase in crack growth rate with an increase in temperature, where crack growth rates are accelerated over the AMSE curve, shown by the dotted line. Tice et al. also reported crack growth retardation at 300'C at a rise times greater than 60 minutes (denoted by the black arrow), which agrees with data from Wire et al, where the environmental enhancement effects of water
temperature decrease at long rise times. The same is also seen for 250'C. [2]
4.. 1.OE-07 '.oE-08 1.0(-09 t.OE-il 1 flE-12
1.OE-13 1.OE-12 1.OE-11
daA (A&) /S
1.E-10 1.OE-09 t.OE-08
Figure 13: Time domain plot of crack growth rates in a PWR environment, shown for a range of temperatures. The black and red arrows denote locations of retardation in environmental crack
growth rates. [2] PWR water R-0.7 - 0.8 300C A-1OEE-14 I
2.4.4 Rise Time
At a constant temperature, FCGRs in PWR water increase as the rise time increases for low sulfur material, as measured by Tice et al. [2], shown in Figure 14. Here, the maximum environmental effect occurred at the longest rise time of 567 minutes, at a low AK, where crack growth rates were enhanced around 100 times over those in air. Experimental conditions are the same as mentioned in previous sections for Reference 1, which are LWR-type conditions.
1.OE-06
I
I
I
I
1.OE-07 t.E -0 I R4..7, 2500i 1 0~ " mink-O ____ - minm - or 0 min AL o-bi um A k-309 Pull * r-Iu mln 10Cyclic Straa ntenalty Factor Range (MPaIrm)
100
Figure 14: Crack growth rates as a function of AK and rise time (tR). [2]
Wire et al. (in continuation of work from Evans and Wire [16]) measured the effect of rise time using very similar heats, but with different sulfur contents, with chemistries shown in Table 3. For short rise times of 8.5 and 50 seconds, the crack growth rates increased with increasing rise time, as shown in Figure 15, with very slight differences between the heats. [5]
![Figure 4: Crack growth under SCC of stainless steel in high purity water. [3]](https://thumb-eu.123doks.com/thumbv2/123doknet/14757107.583122/22.918.277.680.106.605/figure-crack-growth-scc-stainless-steel-purity-water.webp)


![Figure 14: Crack growth rates as a function of AK and rise time (tR). [2]](https://thumb-eu.123doks.com/thumbv2/123doknet/14757107.583122/42.918.236.648.328.817/figure-crack-growth-rates-function-ak-rise-time.webp)


