EFFECT OF PRACTICAL LOSSES ON
OPTIMAL DESIGN OF BATCH RO SYSTEMS
The MIT Faculty has made this article openly available. Please share how this access benefits you. Your story matters.
Citation Swaminathan, Jaichander, Stover, Richard; Tow, Emily W.,
Warsinger, David M. and Lienhard, John H. "EFFECT OF PRACTICAL LOSSES ON OPTIMAL DESIGN OF BATCH RO SYSTEMS." The
International Desalination Association World Congress, October 15-20, 2017, Sao Pauelo, Brazil, International Desalination Association, 2017
As Published http://41ipz630t2to3vry2u24eq1kuxx.wpengine.netdna-cdn.com/wp-content/uploads/2017/10/IDA-WC17-Final-Program.pdf
Publisher International Desalination Association
Version Author's final manuscript
Citable link http://hdl.handle.net/1721.1/111971
Terms of Use Creative Commons Attribution-Noncommercial-Share Alike
The International Desalination Association World Congress on Desalination and Water Reuse 2017/Sao Paulo, Brazil
REF: IDAWC17-Swaminathan Page 1
EFFECT OF PRACTICAL LOSSES ON OPTIMAL DESIGN OF BATCH RO
SYSTEMS
Authors: Jaichander Swaminathan, Richard Stover, Emily W. Tow, David M. Warsinger, John H.
Lienhard V
Presenter: Jaichander Swaminathan
Massachusetts Institute of Technology – United States jaichu@mit.edu
Abstract
Batch reverse osmosis (BRO) systems may enable a significant reduction in energy consumption for desalination and water reuse. BRO systems operate with variable pressure, by applying only slightly more pressure than is needed to overcome the osmotic pressure and produce reverse water flux. This study explains, quantifies, and optimizes the energy-saving performance of realistic batch designs implemented using pressure exchangers and unpressurized tanks. The effects of additional design parameters such as feed tank volume at the end of the cycle, volume of water in the pipes, per-pass recovery, cycle operating time, and cycle reset time on the performance of BRO are captured. Loss mechanisms including hydraulic pressure drop and concentration polarization as well as friction and mixing in the energy recovery devices are considered. At low cycle-reset time (10% of productive time) and low piping volumes (12% of volume inside membrane elements), about 13% energy savings is possible compared to a continuous system operating at the same overall pure water productivity. Under these conditions, we also show that the ideal per-pass recovery is close to 50%, similar to single-stage RO. This recovery reduces the need for system redesign with additional pressure vessels in parallel, contrary to predictions in the literature. The projected savings in terms of the overall cost of water is around 3%. Additionally, advanced ultra-permeable membranes, such as those based on graphene or graphene oxide, are expected to lead to more significant energy savings in BRO than in single-stage RO.
I. INTRODUCTION
The energy required for seawater desalination has been reduced by a factor of four in the last three decades through advances in energy recovery devices and membrane designs. As the energy required has moved closer to the thermodynamic minimum energy for conventional continuous reverse osmosis (RO) processes, many authors have concluded that further research and development could only yield incremental reductions. However, by changing the process configuration, batch RO systems have demonstrated the potential to provide major additional reductions in energy consumption. Batch RO (BRO) systems operate with variable pressure, applying only enough to overcome the osmotic pressure barrier and maintain water flux. The average applied pressure in BRO weighted by the rate of permeate production over the cycle operating time is lower than that required in conventional continuous single-stage RO systems which operate at constant pressure [8].
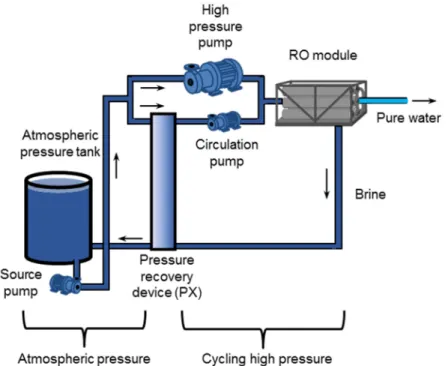
BRO can be implemented in one of two ways: using a pressurized feed container or an unpressurized feed container with a pressure exchanger. In this study, we consider BRO implemented with an unpressurized feed tank in combination with a pressure exchanger (PX), as shown in Figure 1. This design may not be optimal in terms of energy efficiency compared to use of a pressurized feed container, but it is easier to implement since all necessary components are readily available in the market and are
The International Desalination Association World Congress on Desalination and Water Reuse 2017/Sao Paulo, Brazil
REF: IDAWC17-Swaminathan Page 2
widely utilized in the desalination industry.
Fig. 1. Batch RO implemented with an atmospheric pressure tank and pressure exchanger.
While the relative advantage of batch RO over conventional single stage systems is likely to be higher for brackish water desalination at high recovery [9], in this study, we focus on seawater RO (SWRO) to understand the potential for energy and cost savings. The goal of this study is to identify practical energy loss mechanisms in batch RO and quantify their effect on the energy consumption. The effects of various design variables that are unique to BRO systems are considered in detail to lay out a framework for the design and evaluation of BRO systems.
II. METHODOLOGY
Energy consumption is evaluated using numerical models for SWRO and SWBRO. The models build on the simpler model for batch systems presented by Warsinger et al. [9] and additionally include membrane physical variables such as water and salt permeability, channel mass transfer coefficients, and friction factors, giving a more realistic accounting of concentration polarization, salt passage, and pressure drop in the channels. The one-dimensional convection equation is solved in the feed channels in space and time. A central difference scheme is used for evaluating derivatives in space, and an explicit method is used to evolve the batch system in time. For batch processes, the inlet boundary condition is linked to the outlet concentration through a well-mixed tank and pipes connecting the inlet and outlet to the tank. The pressure applied at any point in time can be controlled to produce a required average flux from the module. Empirical equations for pump and energy recovery device efficiencies are incorporated.
Werber et al. [10] also present a detailed numerical model of the batch RO process, accounting for physical parameters such as membrane permeability and channel mass-transfer coefficients. The present model is compared to the results reported in [10] at similar operating conditions and pump and PX efficiencies as a validation exercise in Section 3.
The International Desalination Association World Congress on Desalination and Water Reuse 2017/Sao Paulo, Brazil
REF: IDAWC17-Swaminathan Page 3
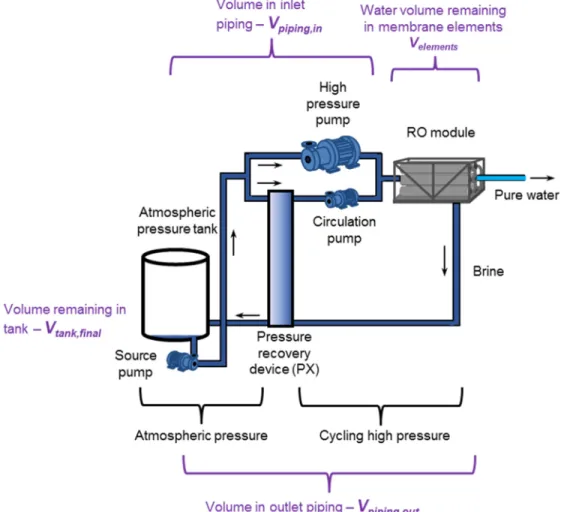
A large external tank was assumed in Ref. [10]. However, a large external tank is inimical to overall energy consumption as will be shown in Section 4.2. Warsinger et al. used a collapsing tank whose volume would approach zero at the end of the cycle, which results in the best possible energy efficiency. Figure 2 shows the BRO system at the end of one cycle of pure water production. In this study, the volume of fluid in the pipes connecting the tank to the RO modules (Vpiping,in, Vpiping,out relative to Velements, which is the volume of the feed channels of the membrane elements) is explicitly considered. A
lower limit on piping volume is enforced, and the effect of changing the piping volume and volume of the feed tank at the end of the cycle (Vtank) on energy efficiency and process cycle time are evaluated.
The volume of fluid remaining outside the membrane elements at the end of each cycle is a key parameter influencing the ideal per-pass recovery, specific energy consumption, and cycle time of the batch process (as shown in Section 4.2), and motivating detailed modeling including this parameter as is done in the present study.
Fig. 2. Distribution of water volume in a BRO system towards the end of its operating cycle (not to
scale). The effect of Vpiping,in, Vpiping,out and Vtank relative to Velements is investigated in this study.
The present model has several other unique features:
1. A detailed model of PX performance accounts for various internal loss mechanisms
2. Pressure drop along the length of the elements is explicitly considered and taken into account, as are pressure drops in the piping outside of the RO module
The International Desalination Association World Congress on Desalination and Water Reuse 2017/Sao Paulo, Brazil
REF: IDAWC17-Swaminathan Page 4
The osmotic pressure, density, and viscosity of the feed solution are approximated using properties of a pure NaCl solution, and a constant recovery ratio of 50% is considered in all cases.
The modeled batch system operates in cycles. First, the system is filled with feed water. Then the feed is circulated and pressure is applied until 50% of the original feed mass is recovered as pure product. At this point, the remaining brine is discharged as new feed re-enters the system. The model simulation only accounts for the pure-water producing portion of the cycle time. This time is referred to as tproductive.
The amount of time required to expel high salinity brine and refill the system with the required quantity of feedwater before the high pressure pump resumes operation is referred to as the cycle-reset time (treset). The overall cycle time of the batch process tcycle is tproductive + treset.
2.1 Baseline system properties
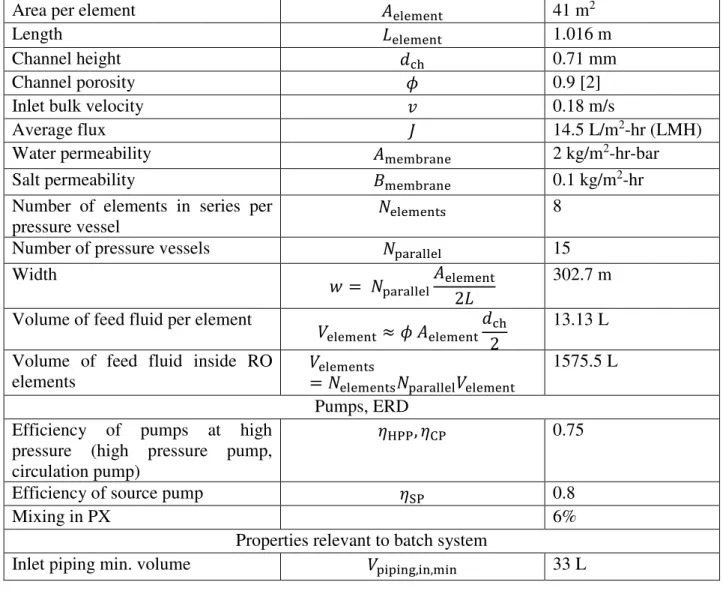
The feed solution salinity is 35 g/kg and recovery ratio is 50%. Overall permeate production of 1633 m3/day (300 GPM) is considered. Membrane geometry is based on a DOW SW30ULE-440i element [1]. The baseline system properties are listed in Table 1.
Table 1. Baseline system properties
Area per element 41 m2
Length 1.016 m
Channel height 0.71 mm
Channel porosity 0.9 [2]
Inlet bulk velocity 0.18 m/s
Average flux 14.5 L/m2-hr (LMH)
Water permeability 2 kg/m2-hr-bar
Salt permeability 0.1 kg/m2-hr
Number of elements in series per pressure vessel
8
Number of pressure vessels 15
Width
2
302.7 m Volume of feed fluid per element
2
13.13 L Volume of feed fluid inside RO
elements
1575.5 L Pumps, ERD
Efficiency of pumps at high pressure (high pressure pump, circulation pump)
, 0.75
Efficiency of source pump 0.8
Mixing in PX 6%
Properties relevant to batch system
The International Desalination Association World Congress on Desalination and Water Reuse 2017/Sao Paulo, Brazil
REF: IDAWC17-Swaminathan Page 5
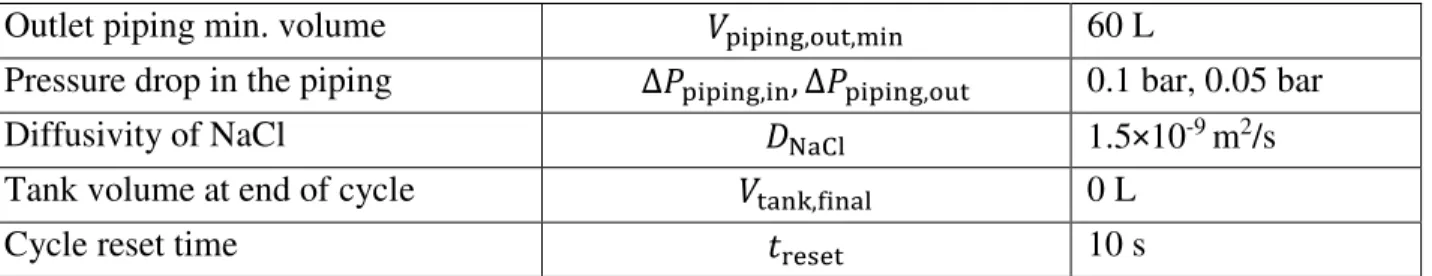
Outlet piping min. volume ! ! ",#$ , ! 60 L
Pressure drop in the piping Δ& ! ! ",! , Δ& ! ! ",#$ 0.1 bar, 0.05 bar
Diffusivity of NaCl '( 1.5×10⁻⁹ m2/s
Tank volume at end of cycle ),*! 0 L
Cycle reset time + 10 s
2.2 Modeling the isobaric energy recovery device (ERD): The isobaric ERD is modeled by considering three loss mechanisms: [6]
1. Pressure drop from the inlet to the outlet of both the high- and low-pressure streams through the ERD,
2. Leakage reducing the high pressure flow and increasing the low pressure flow exiting the ERD, and
3. Mixing increasing the salinity of the high pressure stream exiting the ERD.
III. VALIDATION
The present model was compared with a previous implementation of SWBRO with a PX [10]. The following parameters and assumptions were adapted from [10]: = 3 kg/m2-hr-bar,
= 0 kg/m2-hr, = 15 LMH, = 0.2 m/s, = = 0.8,
2 = 98%, and Δ& ! ! " =
0.1 bar. The two model predictions for optimal per-pass recovery ratio as well as specific energy consumption were close. The difference could be a result of different correlations used for osmotic pressure as a function of salinity, channel friction factor and channel mass transfer coefficient.
Fig. 3. The ideal per-pass recovery for SWRO is around 18%, close to the result in Werber et al. [10].
),*! = 12700 L is about 8 times larger than .
A large external tank was considered in [10]. As a result, for this comparison, the tank volume at the end of the cycle was taken to be around 8 times larger than the volume of fluid inside the membrane
1.8 1.9 2.0 2.1 2.2 2.3 2.4 2.5 2.6 2.7 2.8 0 0.1 0.2 0.3 0.4 0.5 S p e ci fi c E n e rg y [k W h /m 3 ] Per-Pass Recovery, r [-] Werber et al. Present Model
The International Desalination Association World Congress on Desalination and Water Reuse 2017/Sao Paulo, Brazil
REF: IDAWC17-Swaminathan Page 6
elements. Going forward, such a large external volume will not be assumed, and hence the optimal per-pass recovery ratio obtained in this study is quite different. A detailed discussion on optimal per-per-pass recovery is included in Section 4.3.
IV. RESULTS
In this section, several aspects of BRO system design are considered in order to optimize BRO operation before comparing with single-stage continuous SWRO. In Section 4.1, the performance of continuous SWRO under the baseline conditions is reported. All subsequent results for SWBRO are compared as a function of these metrics. The effect of external volume on specific energy consumption and cycle time is evaluated in Section 4.2. An ideal system should have lowest possible values of external volume 7 = ! ! "+ ),*! . The ideal per-pass recovery ratio and the resulting ideal number of elements in series are evaluated in Section 4.3. Unlike previous studies [10], we find that for SWBRO, the ideal per-pass recovery ratio is about 50% (or optimal 9:9;9<=> ≈ 8, the same as the baseline continuous RO system). The implications of this result for BRO system design and capital cost are briefly discussed. The effect of the reset time ratio + /+ #@$ !A on the comparative performance of BRO to continuous RO is considered in Section 4.4. Reset time + is a very important variable that impacts the predicted savings associated with BRO. In Section 4.5, the effect on overall cost of water from BRO is estimated in terms of both CapEx and OpEx. Finally, in Section 4.6, the effect of ultrapermeable membranes on specific energy consumption is compared between SWBRO and SWRO systems. Ultrapermeable membranes result in larger energy savings in the case of BRO compared to continuous RO.
4.1 Baseline case: single stage SWRO with isobaric ERD
The batch RO model is used to simulate continuous RO by fixing the tank salinity at 35 g/kg. The overall specific energy consumption of SWRO is 2.32 kWh/m3in the base case. The average flux over the entire length of the RO elements is 14.5 LMH, and the maximum flux at the lead element (at the entrance) is 52 LMH.
4.2 Effect of 7 (volume outside the module at the end of the cycle time)
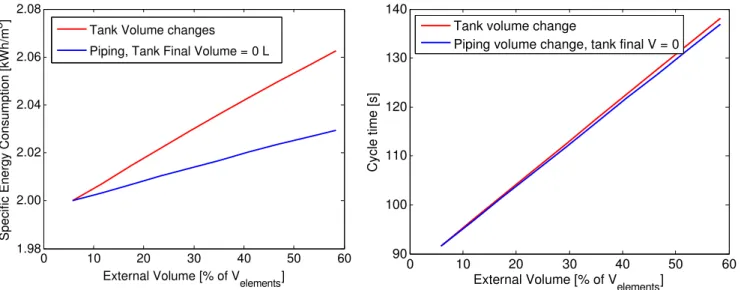
The total external volume at the end of the batch process cycle is represented as 7 . Figure 4 shows the effect of 7 on the specific energy consumption and cycle time of the BRO process. A larger external volume at the end of the cycle leads to a higher specific energy consumption.
The total external volume ( 7 ) is the sum of the volume in the piping ( ! ! ") and the final tank volume ( ),*! ). For the same final external volume, having the volume in the piping system is better than having it in the tank. The cycle time is almost identical in these two cases, but the specific energy consumption is higher for the case where ),*! increases, compared to when ! ! " increases. This is because the tank is well mixed, whereas the pipes hold a range of salinity levels. At the end of the cycle, the fluid in the pipe from the module outlet to the tank has a higher salinity than the tank itself, and the tank has a higher salinity than the inlet to the feed tank. On the other hand, when low piping volume and high tank volume are considered, the salinity of the tank tends towards the highest salinity and the module inlet is also exposed to high feed salinity, leading to higher pressures and therefore higher energy requirements. As an extension of this analysis, we can also expect that it is better to design the outlet piping to be longer than the inlet piping so that some of the highest salinity
The International Desalination Association World Congress on Desalination and Water Reuse 2017/Sao Paulo, Brazil
REF: IDAWC17-Swaminathan Page 7
brine remains unmixed with the tank at the end of the cycle. This was numerically verified, although the corresponding savings are low at least for low overall 7 . An design ramification of this result would be to locate the tank near the module inlet and have a longer pipe from the module outlet back into the tank.
While ),*! ≈ 0 may be achieved by designing the outlet from the tank and the source pump system appropriately, some volume in the piping is unavoidable. An attempt to decrease the volume of fluid in the piping by reducing the pipe diameters would lead to an increase in frictional pressure drop. A minimum piping volume of 93 L (33 L in the inlet section and 60 L in the outlet) is obtained by considering large enough pipes to reduce pressure drop and estimating lengths for these pipe networks. 93 L corresponds to about 6% of the volume of fluid inside the module elements, and is the lower limit considered in this study (cf. Fig 7). Including the volumes in the heads of the pressure vessels and in the pumps, etc., results in an external volume of 186 L (corresponding to about 12% of the element volume).
Fig. 4. (a) Specific energy consumption as a function of Vexternal. (b) Productive cycle time D+ #@$ !A E
as a function of Vexternal. Nelements = 8. J = 14.5 LMH. Red lines correspond to increasing the tank volume
only; blue lines correspond to increasing the piping volume (beyond 6%) only
At 7 = 0.12 and ),*! = 0, the specific energy consumption is around 2.01 kWh/m3. The cycle time of the process is around 96 s. This corresponds to a 13.4% reduction in specific energy consumption compared to the continuous RO system. In the subsequent sections, this analysis is expanded upon to consider the overall performance of BRO compared to continuous SWRO. The costs of BRO and continuous SWRO are also compared.
A lower final brine volume implies a correspondingly lower volume of initial feed (since recovery ratio is constant). Since flux and membrane area are constant in the present comparisons, cases where the final brine volume is lower have a lower operating cycle time (+ #@$ !A ). This explains the linear relationship between + #@$ !A and final external volume in Fig. 4b. This has been highlighted as a reason for choosing zero final tank volume by Warsinger et al. [9].
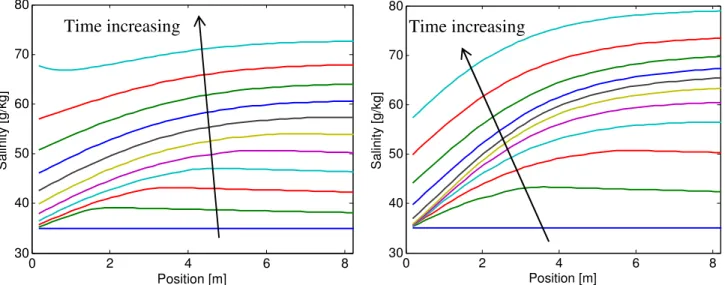
In order to understand the influence of final external volume on specific energy consumption, the salinity profiles within the membrane module are plotted as they evolve with time in Fig. 5. Figure 5a
0 10 20 30 40 50 60 1.98 2.00 2.02 2.04 2.06 2.08
External Volume [% of Velements]
S p e c if ic E n e rg y C o n s u m p ti o n [ k W h /m
3 ] Tank Volume changes
Piping, Tank Final Volume = 0 L
0 10 20 30 40 50 60 90 100 110 120 130 140 External Volume [% of V elements] C y c le t im e [ s ]
Tank volume change
The International Desalination Association World Congress on Desalination and Water Reuse 2017/Sao Paulo, Brazil
REF: IDAWC17-Swaminathan Page 8
shows the salinity profiles for low 7 and 5b shows the salinity profile evolution with time for high 7 .
Fig. 5. Effect of Vout on the salinity profiles within the RO module in BRO over the process cycle-time.
(a) Vout = 6% Velements (limiting case) (b) Vout = 120% Velements
Note that for the low external volume case, the highest salinity observed within the module is around 70 g/kg, whereas it is around 80 g/kg for the case with higher external volume. In both cases, the average salinity of all the remaining brine in the system at the end of the productive part of the cycle is 70 g/kg. If the mass outside the elements is negligible, this implies that the average salinity within the RO elements is also around 70 g/kg. If significant brine exists outside the module in the tank, in order to increase the tank salinity close to 70 g/kg, the RO membranes themselves have to concentrate water to an even greater salinity, leading to a higher average pressure and higher energy requirements.
More curves in Fig. 5a are relatively flat at the beginning of the cycle time compared to in Fig. 5b. In both cases, equal time is required for the initial low salinity feed water inside the module to be displaced completely by inflow of feed. Since the total cycle time is lower for the low external volume case, the time to displace the flat salinity profile within the system constitutes a larger fraction of the total time in this case compared to the system with large 7 . When the external volume is low, the salinity vs. position curves flatten towards the end of the productive part of the cycle time as well, further reducing energy consumption. The local minimum in salinity at the end of a cycle with low external volume occurs due to the rapid return of concentrate exiting the module to the beginning of the module, as discussed in Ref. [9].
4.3 Ideal per-pass recovery or number of elements in series per pressure vessel
In Section 3, we noted that the per-pass recovery is lower than overall recovery of 50% for systems with large external volume. In Section 4.2, we demonstrated that a large value of 7 is counterproductive from an energy efficiency stand-point. As a result, in this section, we evaluate the optimal per-pass recovery for systems with more practically relevant lower external feed volumes at the end of each cycle.
In this study, the module feed inlet velocity is kept constant at 0.18 m/s. Per-pass recovery ratio (RRpass)
0 2 4 6 8 30 40 50 60 70 80 Position [m] S a lin it y [ g /k g ] 0 2 4 6 8 30 40 50 60 70 80 Position [m] S a lin it y [ g /k g ]
The International Desalination Association World Congress on Desalination and Water Reuse 2017/Sao Paulo, Brazil
REF: IDAWC17-Swaminathan Page 9
is defined as the fraction of the incoming mass flow rate that is being recovered as pure permeate at any given time. While feed inlet velocity can be changed, the range of values over which the velocity can be varied is limited considering the maximum and minimum flowrates recommended by membrane manufacturers. On the other hand, by maintaining the feed inlet velocity at 0.18 m/s, the range of velocities within the system can be maintained within the allowable range of values.
While holding the feed inlet velocity constant, RRpass can be adjusted in the design stage by choosing the
number of membrane elements in series in each pressure vessel appropriately. Since the overall flux is also fixed along with inlet velocity, RRpass increases linearly with number of elements in series in each
pressure vessel. As a result, while the original arrangement of membrane elements may be similar to what is shown in Fig. 6a, in order to reduce the per-pass recovery ratio to half the original value (in the continuous RO system), would have to be reduced to half its original value, as shown in Fig. 6b. In order to keep the overall permeate productivity constant, the number of pressure vessels in parallel would have to be increased.
Fig. 6. Example of reverse osmosis modules and elements with different arrangements to implement
different RRpass: (a) 8 elements per module and 4 modules in parallel (higher RRpass).(b) 4 elements and
8 parallel modules (lower RRpass).
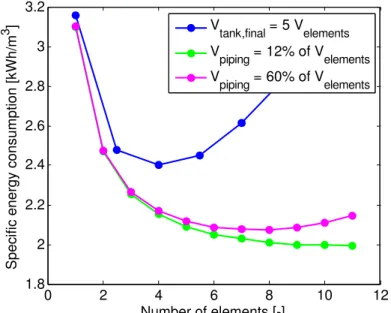
Figure 7 shows the effect of number of elements in series and correspondingly, the per-pass recovery ratio on the specific energy consumption for various values of 7 . At larger 7 , such as 500% of the element volume, the ideal value of number of elements and per-pass recovery ratio is about half of what is used in the continuous system (cf. Section 3). On the other hand, at more practically relevant, lower values of 7 = 6 G 12% , the ideal number of elements is around 8. The ideal number of elements is greater than 8 for very low , but the difference in performance is small and so = 8 is used for all the values of 7 considered in this study.
In the absence of any loss mechanisms such as pump and PX inefficiencies or frictional pressure drops, the ideal per-pass recovery ratio is zero, corresponding to an infinitesimally small membrane area. This way, the applied pressure can almost perfectly follow the osmotic pressure evolution of the system without spatial variations in flux, leading to the best energy efficiency possible [7]. At zero system area, the feed has to be recirculated through the system an infinite number of times to achieve desired concentrations, resulting in significant energy loss in the circulation pump and pressure exchanger. As is reduced, the flowrate through the circulation pump and pressure exchanger increases. The number (or capacity) of required circulation pumps and pressure exchangers and the total energy
The International Desalination Association World Congress on Desalination and Water Reuse 2017/Sao Paulo, Brazil
REF: IDAWC17-Swaminathan Page 10
consumption increase correspondingly. With a large number of elements, a large salinity gradient arises within the RO module, resulting in higher pressure requirements than what is dictated by the osmotic pressure of the inlet feed stream. The optimal number of elements represents a balance of these competing mechanisms.
Fig. 7. Identifying the optimal number of elements (and correspondingly per pass recovery) as a
function of external volume.
One implication of the ideal number of elements being close to eight for an SWBRO system is that no additional pressure vessels, PXs, or pumps are required compared to a continuous SWRO system of the same production capacity. The only additional cost of capital for SWBRO is related to the tank and control system for draining and refilling the BRO system at the end of the cycle. The next section deals with the effect of this reset time on energy consumption.
4.4 Cycle-reset time
A BRO process doesn’t produce pure water continuously; it produces pure water during the productive time and not while it is emptying the high salinity brine and refilling feedwater into the membrane system and tank. A separate pump system is required for this cycle-reset process. The volumetric flowrate during normal operation at the inlet of the RO module is around 37.8 L/s. In order to refill the entire volume of the RO elements (1575.5 L) at this flowrate, it would take about 41.7 s. Recall that the total productive time of the process (in each cycle) is only around 96 s.
The effective flux in a batch RO process can be represented as:
** = ×
+ #@$ !A
+ #@$ !A + +
Because of the reset time, a batch system requires a higher flux or more membrane elements to produce the same permeate flow rate as a continuous RO system.
0 2 4 6 8 10 12 1.8 2 2.2 2.4 2.6 2.8 3 3.2 Number of elements [-] S p e ci fi c e n e rg y c o n s u m p tio n [ k W h /m 3 ] Vtank,final = 5 Velements V piping = 12% of Velements V piping = 60% of Velements
The International Desalination Association World Congress on Desalination and Water Reuse 2017/Sao Paulo, Brazil
REF: IDAWC17-Swaminathan Page 11
Figure 8 shows the specific energy consumption and + #@$ !A as a function of operating flux over the process cycle time. As operating flux is increased, the required pressure increases, corresponding to higher energy consumption. Simultaneously, + #@$ !A also decreases with increasing flux since permeate is produced faster. The effect of piping volume on both specific energy consumption and cycle time is similar to what was observed in Section 4.2.
Fig. 8. Specific energy consumption and productive cycle-time as a function of operating flux. At
higher operating flux, the specific energy consumption increases, and the process cycle time decreases. Figure 9 compares energy consumption to effective flux for two values of +I9>9=. Performance is again calculated for a range of values of external volume. At an effective flux of 14.5 LMH, and ! ! " = 0.12 , specific energy consumption increases from 2.03 kWh/m3 for + = 10 s to 2.14
kWh/m3 for + = 30 s. Note that in spite of the increase, specific energy consumption of SWBRO is still lower than for continuous SWRO, which was 2.32 kWh/m3.
Fig. 9. Specific energy consumption of BRO as a function of effective flux for two values of cycle reset
time = 10 s and 30 s. 15 20 25 2 2.1 2.2 2.3 2.4 2.5 Flux [LMH] S p e c ifi c e n e rg y c o n s u m p tio n [ kW h /m 3 ] Vpiping ≈ 60% Velements V piping ≈ 30% Velements V piping ≈ 12% Velements V piping ≈ 6% Velements 15 20 25 50 60 70 80 90 100 110 120 130 140 Flux [LMH] C y c le T im e [ s ] V piping ≈ 60% Velements V piping ≈ 30% Velements V piping ≈ 12% Velements Vpiping ≈ 6% Velements 12 14 16 18 20 22 2 2.05 2.1 2.15 2.2 2.25 2.3 2.35 2.4 2.45 2.5 Effective Flux [LMH] S p e c if ic E n e rg y C o n s u m p ti o n [ k W h /m 3 ] V piping ≈ 60% Velements V piping ≈ 30% Velements V piping ≈ 12% Velements V piping ≈ 6% Velements t reset = 10 s 11 12 13 14 15 16 17 18 2 2.05 2.1 2.15 2.2 2.25 2.3 2.35 2.4 2.45 2.5 Effective Flux [LMH] S p e c if ic E n e rg y C o n s u m p ti o n [ k W h /m 3] V piping ≈ 60% Velements V piping ≈ 30% Velements V piping ≈ 12% Velements V piping ≈ 6% Velements t reset = 30 s
The International Desalination Association World Congress on Desalination and Water Reuse 2017/Sao Paulo, Brazil
REF: IDAWC17-Swaminathan Page 12
Additional concerns associated with operating at higher flux are related to membrane fouling and exceeding maximum flux recommendations. Batch RO systems have exhibited greater fouling and scaling resistance compared to continuous systems due to unsteady operation and the associated decrease in the amount of time that supersaturated salt solutions spend within the RO modules [5]. While specific manufacturer recommendations for maximum flux per element are not considered, the maximum flux during the operation of the batch process can be compared with the maximum flux at the inlet of the module observed in the continuous system (52 LMH). When operating at effective flux of 14.5 LMH, the maximum flux in SWBRO is 40 LMH for + = 10 s and it increases to 55 LMH for + = 30s.
By comparing the specific energy consumption at equal effective flux, we observe a 12.7% lower energy consumption for SWBRO (if + = 10 s), whereas the energy saving is only 7.8% when + = 30 s. In addition, there may be practical constraints with respect to operating at higher flux to achieve the same effective flux, especially for the cases with larger fraction of cycle-reset time.
4.5 Cost comparison
One way to overcome the limitations highlighted in the previous section with respect to comparing batch and continuous SWRO processes is to keep the same operating flux in batch, but relax the condition of keeping membrane area the same across the two systems. Since the batch system has a lower effective flux, the membrane area in the batch system is increased in order to produce the same overall permeate quantity per unit time. The SWBRO system with ! ! " = 12% of , = 8, = 14.5 LMH is considered and the corresponding energy consumption and productive time were previously evaluated as 2.01 kWh/m3 and around 96 s respectively.
The additional membrane area required for the SWBRO system to produce the same amount of permeate water as the continuous system is given by: # ! $#$ ×=KLMNOPQRSTU=LTVTQ
=KLMNOPQRST . The cost of capital
can be considered to linearly vary with system size, and hence the cost of capital linearly increases with + . Assuming a capital cost of $608K, plant life of 20 years and interest rate of 8% for a 300 GPM desalination plant, the total amortized cost of capital is $0.12/m3. The energy cost at 2.32 kWh/m3 is $0.23/m3 assuming an electricity cost of $0.10/kWh.
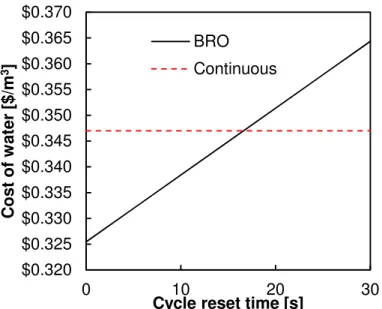
For a SWBRO system, the energy cost is reduced to $0.20/m3. The baseline capital of SWBRO including the additional tank and pump is $655K. Depending on + , the capital cost is higher than $0.12/m3. Based on the linear relationship between CapEx and + , Fig. 10 shows the overall specific
cost of water (considering cost of capital and electricity consumption), considering both electricity cost and amortized cost of capital as a function of + .
The International Desalination Association World Congress on Desalination and Water Reuse 2017/Sao Paulo, Brazil
REF: IDAWC17-Swaminathan Page 13
Fig. 10. Specific cost of water production as a function of + . This shows that SWBRO is cheaper
only if cycle reset time can be much lower than 16 s (for a cycle productive time of 96 s)
For a system with + = 10 s, while the energy saving was predicted to be about 12%, the overall cost saving considering both CapEx and OpEx is about 2.6%. Batch RO systems will need to be designed to rapidly refill the tank and eject brine from the membrane module to minimize the reset time.
4.6 Effect of membrane permeability
The impact of ultra-permeable membranes on the energy consumption and performance of continuous RO desalination systems has already been considered by Cohen-Tanugi et al. [3] who showed that some energy savings are possible in brackish water and seawater desalination. McGovern and Lienhard [4] showed the asymptotic flux limits with ultra-permeable membranes due to limitations imposed by concentration polarization. However, the effect of introducing ultra-permeable membranes into batch RO has not been studied.
Figure 11 shows the effect of increasing membrane permeability on the energy consumption of SWBRO. The specific energy consumption drops by about 10% (0.2 kWh/m3) with an increase in
permeability from 2 LMH/bar to 10 LMH/bar. On the other hand, our model shows that the continuous SWRO system energy consumption would decrease only by about 0.11 kWh/m3. SWBRO is likely to benefit more from the development of novel ultra-permeable membranes such as graphene- and aquaporin-based membranes. $0.320 $0.325 $0.330 $0.335 $0.340 $0.345 $0.350 $0.355 $0.360 $0.365 $0.370 0 10 20 30 C o s t o f w a te r [$ /m 3]
Cycle reset time [s]
BRO Continuous
The International Desalination Association World Congress on Desalination and Water Reuse 2017/Sao Paulo, Brazil
REF: IDAWC17-Swaminathan Page 14
Fig. 11. Effect of water permeability on energy consumption.
VI. CONCLUSIONS
Batch RO implemented with an atmospheric pressure tank and pressure exchanger has the potential to reduce the energy consumption and overall cost of seawater desalination compared to conventional single-stage RO.
1. The volume of fluid outside the membrane elements at the end of the productive part of the cycle time should be small – less than around 20% of the volume inside the membrane elements. The tank volume should ideally tend towards zero at the end of the cycle.
2. For the component efficiencies used here, the ideal number of elements in SWBRO is close to what is used in continuous SWRO and ideal per-pass recovery ratio is around 50%.
3. The reset time is a key variable controlling overall performance of BRO.
a. BRO can be operated at higher flux or with higher area to match the pure water productivity of continuous RO.
b. When BRO is operated at higher flux, if the reset time is small (around 10% of the total time), 10% energy savings are possible compared to conventional RO.
4. Compared to conventional RO, the cost of water is around 2.6% lower with BRO (for + = 10 s) if BRO is operated at the same flux, but with additional membrane area to maintain same overall productivity. The cost of BRO can be higher than continuous RO if the reset time is larger than about 15% of the total time.
5. Ultrapermeable membranes are likely to yield significantly higher energy savings when coupled with SWBRO than when used in SWRO.
VII. ACKNOWLEDGMENT
JS thanks the Tata Center for Technology and Design at MIT for funding his work. EWT would like acknowledge that this material is based upon work supported by the National Science Foundation Graduate Research Fellowship Program under Grant No. 1122374.
1.8 1.9 2 2.1 2.2 2.3 2.4 0 5 10 15 S p e c if ic E n e rg y [ k W h /m 3]
Membrane Permeability [LMH/bar] Continuous Batch RO
The International Desalination Association World Congress on Desalination and Water Reuse 2017/Sao Paulo, Brazil
REF: IDAWC17-Swaminathan Page 15
VIII. REFERENCES
[1] Dow SW30ULE-440i element. http://msdssearch.dow.com/PublishedLiteratureDOWCOM/-dh_097a/0901b8038097ad12.pdf?filepath=liquidseps/pdfs/noreg/609-03004.pdf&fromPage=GetDoc . Accessed: 2017-03-29.
[2] S. S. Bucs, Andrea I. Radu, Vasile Lavric, Johannes S. Vrouwenvelder, and Cristian Picioreanu. Effect of different commercial feed spacers on biofouling of reverse osmosis membrane systems: a numerical study. Desalination, 343:26–37, 2014.
[3] D. Cohen-Tanugi, R.K. McGovern, S.H. Dave, J.H. Lienhard V, and J.C. Grossman. Quantifying the potential of ultra-permeable membranes for water desalination. Energy and Environmental Science, 7(3):1134–1141, 2014.
[4] R. K. McGovern and J. H. Lienhard V. On the asymptotic flux of ultrapermeable seawater reverse osmosis membranes due to concentration polarisation. Journal of Membrane Science, 520:560 – 565, 2016.
[5] S. Sen, A. Lau, E. Idica, and S. Trussell. Maximizing product water through brine minimization. In Proceedings of the WateReuse Forum, Tampa, FL, Sept., 2016.
[6] R. L. Stover and W. Andrews. Isobaric energy recovery devices - past, present and future. In Proceedings of The International Desalination Association World Congress on Desalination and Water Reuse, Perth, Australia, 2011.
[7] G. P Thiel, R. K McGovern, S. M Zubair, and J. H. Lienhard V. Thermodynamic equipartition for increased second law efficiency. Applied Energy, 118:292–299, 2014.
[8] D. M. Warsinger, K. G. Nayar, E. W. Tow, and John H. Lienhard V. Efficiency and fouling of closed circuit reverse osmosis and a novel variant: Pushing the limits on desalination efficiency. In Oral Presentation, New England Graduate Student Water Symposium (NEGSWS), Amherst, MA, USA, 2015. [9] D. M. Warsinger, E. W. Tow, K. Nayar, L. A. Masawadeh, and John H. Lienhard V. Energy efficiency of batch and semi-batch (CCRO) reverse osmosis desalination. Water Research, 106:272– 282, 2016.
[10] J. R. Werber, A. Deshmukh, and M. Elimelech. Can batch or semi-batch processes save energy in reverse-osmosis desalination? Desalination, 402:109 – 122, 2017.