HAL Id: tel-01679292
https://tel.archives-ouvertes.fr/tel-01679292
Submitted on 9 Jan 2018HAL is a multi-disciplinary open access archive for the deposit and dissemination of sci-entific research documents, whether they are pub-lished or not. The documents may come from teaching and research institutions in France or abroad, or from public or private research centers.
L’archive ouverte pluridisciplinaire HAL, est destinée au dépôt et à la diffusion de documents scientifiques de niveau recherche, publiés ou non, émanant des établissements d’enseignement et de recherche français ou étrangers, des laboratoires publics ou privés.
Quantifying economic values of coastal and marine
ecosystem services and assessing their use in
decision-making : applications in New-Caledonia and
Australia
Jean-Baptiste Marre
To cite this version:
Jean-Baptiste Marre. Quantifying economic values of coastal and marine ecosystem services and assessing their use in decision-making : applications in New-Caledonia and Australia. Economics and Finance. Université de Bretagne occidentale - Brest, 2014. English. �NNT : 2014BRES0087�. �tel-01679292�
i
Keywords
Analytic hierarchy process; Attribute non-attendance; Choice modelling; Coastal and marine ecosystems; Coastal management; Decision-making; Discrete choice experiment; Economic valuation; Ecosystem Services; Multi-criteria analysis; Non-market valuation; Non-use values; Preference heterogeneity; Stated preference; Willingness to pay.
iii
Abstract
Coastal and marine ecosystems are some of the most heavily exploited with intense and increasing degradation. This alarming situation appeals for urgent and effective actions. The optimal balance between use and conservation of ecosystems theoretically requires all costs and benefits to be considered in decision-making, including intangible costs and benefits such as non-market use and non-use values. The broad aim of this PhD is to examine how these economic values associated with coastal and marine ecosystem services can be measured, and how the economic valuation exercise may be considered and influence management decision-making.
The first analytical part of the thesis focuses on assessing non-market use and non-use values, through econometric methods. The characterization and estimation of the latest are complex and controversial; especially when the valuation exercise is focusing on individuals who are users of the ecosystem services being considered. An original approach based on a stated preference method, namely choice experiments, is developed then empirically applied in quantifying non-market values for marine and coastal ecosystems in two areas in New Caledonia. It allows the estimation of non-use values for populations of users in an implicit way. An in-depth analysis of the individuals’ choice heuristics during the valuation exercise is also conducted, with a focus on payment non-attendance. This issue is dealt with by comparing multiple modelling approaches in terms of: (1) inferred attendance, in relation to stated attendance; (2) attendance distribution according to several socio-economic variables; and (3) welfare estimates.
After noting that the potential influence of economic valuation in decision making is unclear and largely unexplored in the literature, the second major component of this PhD aims to examine if, how and to what extent various types of economic information on ecosystem services, including measures of non-use values, influence decision making regarding coastal and marine ecosystems management in Australia. Based on two nation-wide surveys, the perceived usefulness of the economic valuation of ecosystem services by the general public and decision-makers is studied, and the reasons why decision-makers may or may not fully consider economic values are elicited. Using a multi-criteria analysis, a part of the surveys also aims at examining the relative importance of different evaluation criteria (ecological, social and economic) when assessing the consequences of a hypothetical coastal development project on commercial activities, recreational activities and marine biodiversity.
v
Table of Contents
Introduction ... 1
1. The development of economic valuation of ecosystem services ... 4
2. Key challenges ... 10
3. Research objectives ... 14
4. Structure of the thesis ... 16
Part 1 Quantifying ecosystem services values: New Caledonian application ... 17
Chapter 1 Measuring Non-Use values ... 21
1. Introduction ... 21
2. Stated preference methods ... 25
2.1 Random Utility Theory ... 25
2.2 From Contingent Valuation Method to Discrete Choice Experiment ... 27
2.2.1 Contingent Valuation... 27
2.2.2 Discrete Choice Experiments ... 29
2.3 Validity and reliability of stated preference methods ... 31
3. A pragmatic approach to measuring non-use values ... 33
3.1 Proposed approach ... 33
3.2 Application through Discrete Choice Experiment ... 34
4. Data collection and econometric methods ... 36
4.1 Conservation of New Caledonian coral reef ecosystems ... 36
4.2 Selection of attributes, levels and DCE design... 39
4.2.1 Attributes selection process ... 40
4.2.2 Levels selection process ... 44
4.2.3 DCE design ... 46
4.3 Questionnaire, sampling strategy and survey ... 50
4.3.1 Development of the questionnaire ... 50
4.3.2 Sampling strategy ... 52
4.3.3 Conducting the surveys ... 53
4.4 Econometric analysis ... 55
4.4.1 Conditional and Multinomial Logit Model ... 55
4.4.2 Latent Class Logit Model (LCM) ... 57
4.4.3 Random Parameters Logit models (RPL) ... 58
5. Results ... 59
5.1 Perceptions about coastal and marine preservation ... 59
5.2 Individuals retained for choice modelling ... 60
5.3 Utility specification ... 61
5.3.1 Generic models ... 61
5.3.2 Non-linear specification ... 64
5.3.3 Integrating socio-economic variables ... 65
5.4 Panel EC-RPL and LCM with stated cost attendance groups ... 71
vi
5.4.2 Panel EC-RPL ... 73
5.5 Individual WTP and non-use values ... 74
6. Discussion and conclusions ... 79
6.1 Discussion of the main results ... 79
6.2 Further work and limitations ... 82
6.3 Conclusion ... 84
Chapter 2 Dealing with payment non-attendance in DCE ... 87
1. Introduction ... 87
2. Materials and methods ... 89
2.1 Quantifying attributes non-attendance ... 89
2.2 Modelling approaches ... 91
2.2.1 Latent class models... 91
2.2.2 Random parameters models ... 93
2.3 Case study... 94
3. Results ... 96
3.1 Stated choice behaviour ... 96
3.2 Panel LCM results ... 99
3.3 Panel EC-RPL models results ... 109
3.4 WTP results ... 113
4. Discussion ... 116
4.1 Quantifying payment non-attendance ... 116
4.2 Determininants of payment non-attendance ... 118
4.3 Reasons behind non-attendance ... 120
4.4 Welfare estimates ... 122
4.5 Further research ... 123
5. Conclusions ... 123
Part 2 Assessing the use of ecosystem services economic valuation: Australian application ... 127
Chapter 3 Exploring the use and influence of economic valuation in decision-making: application to coastal and marine ecosystems services in Australia ... 131
1. Introduction ... 131
2. Material and method ... 139
2.1 Surveys design ... 139
2.1.1 General approach ... 139
2.1.2 Main challenges ... 139
2.1.3 Design of the questionnaires ... 142
2.1.4 Structure of the questionnaires ... 143
2.2 Data collection ... 146
2.2.1 General public and decision-makers samples ... 146
2.2.2 Running the survey ... 147
2.3 Profile of respondents ... 148
vii
3. Results ... 153
3.1 General public’s perception about the preservation of coastal and marine ecosystems ... 153
3.2 Populations’ and decision-makers’ perceptions about ESV ... 154
3.3 Socio-economic factors of knowledge and use of ESV ... 161
3.3.1 General public ... 161
3.3.2 Decision-makers ... 163
3.4 The use of ESV by decision-makers ... 167
3.4.1 Frequency and types of utilization of ESV ... 167
3.4.2 Examples of ESV use ... 169
3.4.3 Examples where ESV was ignored ... 173
3.4.4 Need for more ESV ... 175
4. Discussion and conclusion ... 175
4.1 Comparing decision-makers and general public results ... 175
4.2 Usefulness and use of ESV in decision-making ... 178
4.3 Limits... 181
4.4 Conclusions ... 184
Chapter 4 Assessing the relative importance of the economic valuation of ecosystem services in coastal and marine decision-making ... 187
1. Introduction ... 187
2. Material and methods ... 189
2.1 Analytic Hierarchy process ... 189
2.1.1 A brief literature review ... 190
2.1.2 Steps to develop and conduct an AHP... 191
2.2 Survey design ... 195
2.2.1 Targeted populations ... 195
2.2.2 Development of the AHP framework ... 196
2.3 Online survey and data collection ... 203
2.4 Statistical analysis of AHP results ... 205
2.4.1 Deriving robust weights ... 205
2.4.2 Cluster analysis ... 206
2.4.3 Coherence analysis ... 207
2.4.4 Regression models ... 208
3. Results ... 210
3.1 Elicitation of weights of stakeholder preferences ... 210
3.1.1 Consistency and relevant preferences... 210
3.1.2 Weights observed ... 212
3.2 Cluster analysis results ... 215
3.2.1 Final weights clusters for the general public and decision-makers ... 215
3.2.2 Socio-economic characteristics of clusters for lower and higher level objectives ... 220
3.3 Coherence analysis results ... 229
3.3.1 Overall coherence in general public and decision-makers sample ... 229
3.3.2 Coherence within groups in general public and decision-makers sample ... 231
3.4 Determinants of final weights ... 238
3.4.1 General Public ... 239
viii
4. Discussion and conclusion ... 243
4.1 Preferences for economic valuation, ecological and socio-economic indicators: decision-makers and general public ... 243
4.2 Determinants of individual relative preferences ... 248
4.3 Limits and further research work ... 251
4.4 Conclusion ... 253
Discussion and conclusion ... 255
1. Study Objectives ... 256
2. Main results ... 257
3. Main contributions ... 259
4. Implications for policy and research ... 261
4.1 On the estimation of robust non-use values and their relevance for decision-making ... 261
4.2 The role and use of economic valuation of ecosystem services in decision-making ... 264
5. Limitations of the study ... 266
6. Recommendations for future research ... 267
7. Final comments ... 269
ix
List of Appendices
Appendix A: Brief history of the neoclassical framework of environmental valuation ... 271
Appendix B: Typologies and methods ... 278
Appendix C: Limits, debates and the birth of Ecological Economics ... 281
Appendix D: IFRECOR and New Caledonian economic valuation studies ... 285
Appendix E: Tests of the experimental design ... 287
Appendix F: Description of the attributes and choice set example ... 288
Appendix G: New Caledonian application questionnaire ... 298
Appendix H: Quotas ... 305
Appendix I: Models with socio-economic variables ... 307
Appendix J: Tobit Model ... 309
Appendix K: Attendance and non-attendance for all attributes ... 310
Appendix L: Panel EC-RPL models’ results for both areas with all parameters following constrained triangular distributions ... 314
Appendix M: Glossary and participant information sheet ... 315
Appendix N: Questionnaires Australian Application ... 318
Appendix O: Additional information from surveys ... 336
Appendix P: Example of ESV use by types of utilization and management context ... 338
Appendix Q: Example of weight computation ... 343
Appendix R: Pair-wise comparisons tool developed in Excel ... 344
Appendix S: Instruction sheet for the AHP ... 345
Appendix T: Box plots of the different AHP weights ... 347
Appendix U: Socio-demographic composition of decision-makers by State ... 352
Appendix V: Cluster analysis ... 353
x
List of Tables
Table 1-1 Typical example of questionnaire format in DCE ... 30 Table 1-2 Estimating Non-use values for users and non-users: a new estimation procedure ... 34 Table 1-3 Attributes and levels ... 47 Table 1-4 Main motivations to preserve New Caledonian coastal and marine ecosystems: average scores (0=Not important; 4=Very important) ... 60 Table 1-5 Socio-economic characteristics of individuals retained for analysis, for each area ... 61 Table 1-6 MNL and Panel EC-RPL model results for each area with non monetary attributes under non continuous form ... 63 Table 1-7 MNL and Panel EC-RPL models for each area with log-linear utility specification (WTP are in CFP/month) ... 66 Table 1-8 Panel EC-RPL models with log-linear utility specification: individual WTP estimates (CFP/month) and standard deviation estimates of individual WTP for all individuals, in each area .... 67 Table 1-9 MNL and Panel EC-RPL models with non-continuous non-monetary attributes and socio-economic variables ... 68 Table 1-10 MNL and panel EC-RPL models results with log-linear utilities specifications and socio-economic variables ... 69 Table 1-11 MNL and Panel EC-RPL models with log-linear utility specifications and Age interacting with non-monetary attributes ... 70 Table 1-12 Panel LCM results for each area: individuals who stated attendance or non-attendance of payment ... 72 Table 1-13 Panel EC-RPL models with different payment coefficients for individuals who stated attendance or not to payment ... 73 Table 1-14 Panel EC-RPL models with log-linear utility specification for each area: Individual WTP (CFP/month) for individuals who stated attendance to payment and associated standard deviation .... 76 Table 1-15 Computed WTP (CFP/month) during and over life expectancy for ZCO and VKP areas using panel LCM or EC-RPL models individual WTP estimates ... 76 Table 2-1 Attributes and levels ... 95 Table 2-2 Stated payment attribute consideration during choice process for each area (% with no responses excluded from sample) ... 98 Table 2-3 Stated attributes attendance behaviours for each area (percentages exclude no responses) . 98 Table 2-4 Panel LCM for different groups of populations in VKP area ... 101 Table 2-5 Panel LCM for different groups of populations in ZCO area ... 102 Table 2-6 Panel LCM with parameters restrictions for different groups of populations in VKP area 103 Table 2-7 Panel LCM with parameters restrictions for different groups of populations in ZCO area 104
xi Table 2-8 Inferred versus stated attendance to payment for VKP area using panel LCM with
parameters restrictions ... 105 Table 2-9 Inferred versus stated attendance to payment for ZCO area using panel LCM with
parameters restrictions ... 105 Table 2-10 Tobit model on individuals’ probabilities of non-attendance to payment computed with the LCM: results for VKP and ZCO areas ... 107 Table 2-11 Tobit model on individuals’ probabilities of attendance to payment computed with the LCM: results for VKP and ZCO areas ... 108 Table 2-12 Panel EC-RPL models results for VKP area with normally distributed payment coefficient: all sample and for tribe versus non-tribe populations... 110 Table 2-13 Panel EC-RPL models results for ZCO area with normally distributed payment coefficient: all sample and for tribe versus non-tribe populations... 111 Table 2-14 Inferred versus stated attendance to payment for VKP area using panel EC-RPL models: all sample and tribe versus non-tribe results ... 112 Table 2-15 Inferred versus stated attendance to payment for ZCO area using panel EC-RPL models: all sample and tribe versus non-tribe results ... 112 Table 2-16 Panel EC-RPL models with different payment coefficients for individuals who stated attendance or not to payment ... 113 Table 2-17 WTP (CFP/month) obtained with different models for each area: MNL, panel LCM, panel LCM with parameters restriction on payment ... 115 Table 2-18 Panel EC-RPL models with log-linear utility specification: Individual WTP (CFP/month) and standard deviation of individual WTP for each area (payment (t,0.5) distributed and other
attributes (t,1) distributed) ... 115 Table 3-1 Possible reasons for using or not ESV and potential limits to its use ... 144 Table 3-2 Socio-economic characteristics of the general public and decision-makers samples used for this analysis ... 149 Table 3-3 Proportions of individuals in the general public and decision-makers samples who stated ESV as “necessary” or “useful” for each reason behind ESV usefulness ... 156 Table 3-4 Limits of ESV selected by the general public and decision-makers: proportions in each sample ... 157 Table 3-5 Average scores (0=Not important, 3=Highly important) associated with estimating an economic value for each coastal and marine ecosystem services, based on decision-makers and general public’ statements (excluding individuals having stated “Do not know”) ... 161 Table 3-6 Socio-economic characteristics of individuals having heard (or not) about ESV in the general public: proportions and average categories ... 162 Table 3-7 Logit model on the perceived knowledge of ESV for the general public (n=250) ... 163
xii
Table 3-8 Socio-economic characteristics of individuals having heard (or not) about ESV in the decision-makers ... 164 Table 3-9 Ordered logit regression on the perceived knowledge and use of ESV for the respondents (n=88) ... 165 Table 3-10 Logit model on the perceived use of ESV for the respondents (n=88) ... 166 Table 3-11 Average stated frequency scores (1=Never considered; 3=Often considered) for the different types of use of ESV by management contexts ... 168 Table 3-12 Stated Australian cases of ESV uses by management context and types of uses ... 170 Table 3-13 Stated Australian case studies where ESV was considered to have a significant impact on policy or management ... 172 Table 4-1 Scale of pairwise comparison intensity of importance ... 192 Table 4-2 Average random indexes ... 194 Table 4-3 Consistency breakdown General Public: proportions of consistent individuals across the different set of comparisons based on the consistency ratios ... 210 Table 4-4 Consistency breakdown Decision-makers: proportions of consistent individuals across the different set of comparisons based on the consistency ratios ... 210 Table 4-5 Proportions of robust preferences in the general public sample ... 211 Table 4-6 Proportions of robust preferences in the decision-makers sample ... 211 Table 4-7 Relative weights associated with the types of consequences to be assessed (taken
independently): general public and decision-makers ... 212 Table 4-8 Relative weights associated with the economic, ecological and socio-economic indicators (taken independently): general public and decision-makers ... 212 Table 4-9 Overall weights associated with the economic, ecological and socio-economic assessment of the different types of consequences: general public and decision-makers ... 213 Table 4-10 Hierarchical clusters for general public’s final weights associated with consequences to be assessed ... 215 Table 4-11 Hierarchical clusters for decision-makers’ final weights associated with consequences to be assessed ... 216 Table 4-12 Hierarchical clusters for general public’s final weights associated with the assessment of development consequences ... 219 Table 4-13 Hierarchical clusters for decision-makers’ final weights associated with the assessment of development consequences ... 219 Table 4-14 Socio-demographic characteristics of clusters for general public’s final weights associated with types of consequences to be assessed ... 221 Table 4-15 Socio-demographic characteristics of clusters for general public’s final weights associated with the assessment of development consequences ... 222
xiii Table 4-16 Socio-demographic characteristics of clusters for decision-makers final weights associated with the development consequences ... 226 Table 4-17 Socio-demographic characteristics of clusters for decision-makers final weights associated with the assessment of development consequences ... 227 Table 4-18 Coherence level and proportion of extreme cases ... 230 Table 4-19 Overall weights, coherence level and proportion of extreme cases for the general public by geographical location ... 232 Table 4-20 Overall weights, coherence level and proportion of extreme cases for the decision-makers by types of organizations they are working for ... 233 Table 4-21 Overall weights, Coherence level and proportion of extreme cases for the decision-makers by types of management they are involved in ... 235 Table 4-22 Overall weights, coherence level and proportion of extreme cases for the decision-makers by types of role in decision-making ... 237 Table 4-23 Overall weights, coherence level and proportion of extreme cases for the decision-makers by groups of years experience in decision-making ... 238 Table 4-24 Tobit regression results on the AHP weight associated with the economic assessment of commercial activities (general public) ... 239 Table 4-25 Tobit regression results on the AHP weight associated with the economic assessment of recreational activities (general public) ... 240 Table 4-26 Tobit regression results on the AHP weight associated with the economic assessment of marine biodiversity (general public) ... 240 Table 4-27 Tobit regression results on the AHP weight associated with the economic assessment of commercial activities (decision-makers) ... 242 Table 4-28 Tobit regression results on the AHP weight associated with the economic assessment of recreational activities (decision-makers) ... 242 Table 4-29 Tobit regression results on the AHP weight associated with the economic assessment of marine biodiversity (decision-makers) ... 242
xiv
List of Figures
Figure I-1 Economic values for coastal and marine ecosystems and most frequently associated
valuation methods... 8
Figure 1-1 Localization of New Caledonia ... 37
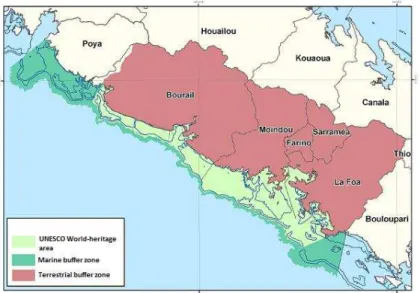
Figure 1-2 Map of ZCO area and associated UNESCO world-heritage zones ... 38
Figure 1-3 Map of Voh-Koné-Pouembout (VKP) area ... 39
Figure 1-4 Example of a choice card ... 49
Figure 1-5 Part-worth utilities (dummy coding) of three attributes over time: Quantity of animals fished, Health and richness of the marine life, Coastal and lagoon natural landscape ... 64
Figure 1-6 Distribution of individual use and non-use values for VKP and ZCO, from panel LCM. Kernel density plots on the left represent individual WTP during life expectancy, the ones on the right represent individual WTP beyond life expectancy ... 77
Figure 1-7 Distribution of individual use and non-use values for VKP and ZCO from EC-RPL model. Kernel density plots on the left represent individual WTP during life expectancy, the ones on the right represent individual WTP beyond life expectancy ... 78
Figure 3-1 Decision-makers sample: types of organizations represented (n=88) ... 150
Figure 3-2 Decision-makers sample: jurisdictions in which respondents are involved by types of management... 150
Figure 3-3 Decision-makers sample: role in decision-making (n=88) ... 151
Figure 3-4 Most important reasons to preserve coastal and marine ecosystems: normalized weighted indexes based on proportions of stated importance ... 154
Figure 3-5 Stated familiarity with ESV: proportions of general public (left, n=256) and decision-makers (right, n=88) ... 155
Figure 3-6 Stated usefulness of ESV: proportions of general public (left, n=256) and decision-makers (right, n=88) ... 155
Figure 3-7 Proportions of general public (left, n=242) and decision-makers (right, n=83) who stated there were limits to the use of ESV ... 157
Figure 3-8 General public’ stated importance of estimating an economic value for the different types of services provided by coastal and marine ecosystems ... 159
Figure 3-9 Decision-makers’ stated importance of estimating an economic value for the different types of services provided by coastal and marine ecosystems ... 159
Figure 3-10 Decision-makers’ stated level of trust in each economic values associated with different types of services provided by coastal and marine ecosystems ... 160
Figure 3-11 Stated use of ESV as a way to communicate, advocate or raise awareness, by different management context ... 167
xv Figure 3-12 Stated use of ESV for evaluation and decision-making, by different management context
... 167
Figure 3-13 Stated use of ESV for establishing taxes, subsidies, fees or damage compensation, by different management context ... 168
Figure 3-14 Respondents involved in a decision-making process where ESV existed but was not used (N=70) ... 173
Figure 4-1 Classical structure of an AHP hierarchical tree ... 192
Figure 4-2 Typical pairwise comparison used in an AHP ... 193
Figure 4-3 AHP Hierarchical structure ... 200
Figure 4-4 General public and decision-makers final weights: higher level objectives (types of consequences to be assessed) ... 214
Figure 4-5 General public and decision-makers final weights: lower level objectives (various assessment of the different types of consequences) ... 214
Figure 4-6 Distribution of coherence scores for all general public overall weights (lower level objectives) ... 230
Figure 4-7 Distribution of coherence scores for all decision-makers overall weights (lower level objectives) ... 231
xvii
List of Abbreviations
AHP: Analytic Hierarchy Process CBA: Cost Benefit Analysis
CME: Coastal and Marine Ecosystems CV: Coefficient of Variation
CVM: Contingent Valuation Method CR: Consistency Ratio
DCE: Discrete Choice Experiment
EC-RPL: Error Component Random Parameters Logit model ES: Ecosystem Services
ESV: Ecosystem Services economic Valuation IA: Inferred Attendance
INA: Inferred Non-Attendance LCM: Latent Class Model MCA: Multi Criteria Analysis MNL: Multinomial Logit Model NUV: Non-Use Values
RPL: Random Parameters Logit model RUT: Random Utility Theory
SA: Stated Attendance SNA: Stated Non Attendance SP: Stated Preference
TEV: Total Economic Value WTP: Willingness-To-Pay WTA: Willingness-To-Accept
xix
Statement of Original Authorship
The work contained in this thesis has not been previously submitted to meet requirements for an award at this or any other higher education institution. To the best of my knowledge and belief, the thesis contains no material previously published or written by another person except where due reference is made.
Signature:
xxi
Acknowledgements
I first thank my supervisors for their outstanding continual support and encouragement throughout the duration of my PhD: Dr Olivier Thebaud, Dr Jean Boncoeur, Dr Sean Pascoe and Dr Louisa Coglan. Working with you was a great enriching experience, and your understanding and advices have considerably contributed to the fulfilment of this thesis. I also thank: Dr Sarah Jennings from the University of Tasmania for her help in finding financial support during all the time spent in Australia, and for her valuable collaboration in the survey work conducted in Australia; Dr Nicolas Pascal for having given me opportunity to conduct the New Caledonian application, and for his important support during this first research work; and Dr Luke Brander for his crucial help during the development and analysis of the Choice Experiment work conducted in New Caledonia.
I am grateful to the AMURE research centre in Brest, the Ifremer Nouvelle-Calédonie and the CSIRO Wealth from Ocean flagship and the Centre for Marine and Atmospheric Research (CMAR) in Brisbane for supporting this research work and providing a working place. The work reported in this thesis was also supported by the French National Initiative for Coral Reefs (IFRECOR) program, the Australian Fisheries Research Development Corporation (FRDC project 2008/306), and the Marine Biodiversity Hub of the National Environmental Research Program (NERP).
I am grateful to the IFRECOR, the members of the IFRECOR French national committee “TIT Economie” and the members of its local committee in New Caledonia, and ESCAL (Enquêtes statistiques Sondages Calédoniens) who helped us conducting the survey in New Caledonia. I thank all the individuals that participated in the focus group discussions and interviews when designing the survey and the choice experiments.
I am grateful to the Marine Biodiversity Hub of the NERP program, and especially to Dr Nic Bax from CSIRO and Paul Hedge from University of Tasmania for helping out with the launch of the Australian survey.
Many thanks to all the respondents from the New Caledonian and Australian populations who participated in both surveys, and thus made this research work possible. I would also like to thank all the coastal and marine “decision-makers” who took the time out of their busy schedules to take part in the Australian survey.
xxii
Finally, big thanks to all my family, friends, and to all the colleagues and peers from the Ifremer, UMR AMURE, QUT School of Economics and Finance and CSIRO CMAR with whom I had the pleasure to work and spend some great time.
1
2
We are currently facing a series of major global environmental challenges: climate change (IPCC, 2007; Stern, 2007), depletion of environmental resources (Meadows, 1972; Millennium Ecosystem Assessment (MA), 2003, 2005; Food and Agricultural Organization [FAO], 2007, 2009, 2012; International Energy Agency, 2011), and a persistently high rate of biodiversity loss (Mace et al., 2005; MA, 2005). Failure to adequately respond to these challenges is likely to lead to continued degradation and over-exploitation of ecosystems and the benefits they provide to humans i.e. ecosystem services (MA, 2005).
Response to these challenges is not costless, and in order to take appropriate measures, it is necessary to examine the consequences of such declines in terms of social welfare, which also means examining what are the costs or benefits of preserving or losing ecosystem services. The economy has an important role to play in determining these; as Georgescu-Roegen noted: "apt though we are to lose sight of the fact, the primary objective of economic activity is the self-preservation of the human species" (1971, p. 277).1
While human activities are largely guided by market incentives, these markets generally fail to capture costs implied by degradation of common pool resources and ecosystems. These degradations are traditionally referred to as “externalities”, since they escape exchanges on the market, and as such are not captured in the prices at which goods and services are produced and consumed in the economy. Thus, economic activities are a source of societal benefits and costs, some of which are external to private economic decisions, and relate in particular to the impacts of these activities on ecosystems. The quantitative evaluation of these impacts can help characterise their global or local consequences for social welfare. Similarly, slowing down the decline in ecosystems and the services they provide is often advocated through conservation measures (e.g. Marine Protected Areas or protection of endangered species2), alongside other measures that aim to “internalize externalities”; and this implies costs and benefits, some of which occur mainly over the long term. Determining the appropriate level of conservation requires balancing these costs with the benefits that are produced from preserving ecosystems services (Hanley and Spash, 1993).
This is the origin of the Ecosystem Services Economic Valuation (ESV) approach, which has rapidly developed as a pragmatic way to support decision-making in the domain of
1
A more recent transcription of this statement is the sustainability concept (e.g. Brundtland report, World Commission on Environment and Development 1987).
3
biodiversity conservation compared to other ecological or moral argumentation (Pearce and Moran, 1994; Costanza et al., 1997; Boyd and Banzhaf, 2007; TEEB, 2008; Liu et al., 2010). Non-market valuation (Adamowitz, 2004) was designed to account for the changes regarding Ecosystem Services (ES), which would usually escape the market and therefore imply no economic signals regarding their contributions to social welfare or threats in their capacity to do so.
The rationale is that where no prices exist, values must be assessed and quantified whenever possible in order to appropriately guide decision to effectively manage ecosystems and to strike an optimal balance between use and conservation. Though the concept of value has many different meanings to different groups, estimating a monetary value using a common numeraire3 allows for simple comparisons between groups to be made, and as such it contributes to bridge different systems of knowledge (science, policy and common public). In particular, the call for increased economic valuation of ES has especially been observed for coastal and marine ecosystems (CME). These ecosystems are some of the most heavily exploited globally (UNEP, 2006; Halpern et al., 2008): as an example coastal zones make up just 4% of the earth’s total land area and 11% of the world’s oceans, yet they contain more than a third of the world’s population and account for 90% of marine fisheries catch (MA 2005). As Barbier (2012) noted, the degradation and loss of CME are intense and increasing worldwide, with 50% of marshes, 35% of mangroves, 30% of coral reefs, and 29% of sea grasses either lost or degraded (FAO, 2007; MA, 2005; Orth et al., 2006; UNEP, 2006; Waycott et al., 2009). This decline of CME goes along with the growing concerns due to overfishing (Worm et al., 2009; FAO, 2009; Swartz et al., 2010) and water quality issues (MA, 2005; Halpern et al., 2008). Thus, services provided by those ecosystems to humans are threatened: provision of renewable resources through the number of viable fisheries, filtering and detoxification provided by suspension feeders, submerged vegetation, and wetlands, protection against shore erosion, coastal flooding or storm events (Koch et al., 2009), recreational, cultural, existence as well as aesthetic values (MA, 2005), and more broadly resilience to external shocks. The strong dependence of populations towards this huge flow of services necessary to human welfare clearly exacerbates the issue. In addition to this, several factors dramatically complicate the design of potential management responses, such as a high
3 It is necessary, however, to be aware of what these dollar values actually represent. For example, marginal and total dollar values cannot be directly compared. A certain level of knowledge or understanding of the techniques might be required.
4
degree of “connectivity” with land ecosystems, cross border and jurisdictional issues, an important lack of understanding of these interactions and impacts as well as subsequent uncertainty, and strong links with climate change issues.
Benefits associated with these services, or the costs of losing these services and associated values, have been estimated worldwide (e.g. Barbier et al. 2007, Barbier 2011, 2012; MA, 2005; Brander et al., 2007), as a way to legitimate conservation. It is indeed crucial to measure the value of these ecosystem services so we can better understand what is at stake if these habitats are lost and to incorporate these values into coastal and marine management and planning (Barbier, 2012). Yet many of the benefits of CME habitats are undervalued or even ignored in coastal and marine development decisions (Barbier, 2012; Brander et al., 2006).
The broad aim of this thesis is hence to examine how some intangible economic values associated with coastal and marine ecosystem services and their conservation can be measured, and how the economic valuation exercise may be considered and influence management decision-making.
The development of economic valuation of ecosystem services
1.
Ecosystem Services Economic Valuation (ESV) was originally developed as a tool within environmental economics (see Appendix A for a brief historical review of environmental valuation), and is based on utilitarianism. As such, ESV is ideologically grounded in anthropocentrism, both philosophically and ethically.
The development of typologies and techniques for estimating robust monetary values, reflecting the actual contribution of ES to social welfare has become an increasingly important area in environmental economics, and, for the past thirty years, economists have committed important theoretical and empirical efforts to reliably classify and quantify these costs and benefits (Liu et al., 2010). Environmental valuation methods based on neoclassical economic theory were continuously developed and theoretically refined (e.g. progress on taking into account uncertainties), as well as more and more applied worldwide.
In parallel, several international agreements and declarations such as the United Nations Conference on Environment and Development (1992), the multiple Conference of the Parties4
4 The Conference of the Parties is the governing body of the Convention of Biological Diversity (CBD), and advances implementation of the CBD through the decisions it takes at its periodic
5
or the Convention on Biological Diversity5 have demonstrated the increased international recognition of biodiversity and ecosystems protection and sustainable use as a common concern of Human Kind. At national levels, legislations evolved in order to account for and limit ecosystem degradation (e.g. Comprehensive Environmental Response, Compensation, and Liability Act in the US6). This growing recognition in public policy of the need to protect biodiversity has led to the development of a number of valuation typologies, defining the different sources of values derived from ecosystems (e.g. MA 2005; Turner et al., 2003; de Groot et al., 2002; Costanza et al., 1997; Pearce and Moran, 1994). The growing number of practical applications of these typologies over the last three decades has largely confirmed the predominant interest for such tools in support of decision making at different scales.
x Value typologies and valuation methods
The Total Economic Value typology is commonly encountered in the literature (e.g. Costanza et al., 1997; Garrod and Willis, 1999; Turner et al., 2003; Bateman et al., 2002), and is based on the multiple types of humans’ interactions with ecosystems. Total economic value is defined as the sum of use, option and non-use values. The former can be measured by revealed preference techniques since they relate to uses which leave a behavioural trace even if only indirect; the latter, by definition, can only be measured by stated preference methods since there is no behavioural trace (Carson, Flores and Mitchell, 1999). Indeed, use values refer to current (and future depending on the specified time frame considered) direct or indirect physical interactions with the good (thus divided into direct or indirect use values). Option values refer to the current value of maintaining several futures possible uses (either a willingness-to-pay to preserve the possibility of using the good later, or the expected economic rent of future planned activities). Non-use, also known as passive-use, values refer to economic values held for the good independently of any direct or indirect uses (in the present as well as in the future, which also means independently of any expected uses from the value holder).
meetings. To date the Conference of the Parties has held 10 ordinary meetings, and one extraordinary meeting.
5
http://www.cbd.int/
6
The Comprehensive Environmental Response, Compensation, and Liability Act of 1980 (42 United States Code 9601–9675) consists of Public Law 96–510 (Dec. 11, 1980) and the amendments made by subsequent enactments. http://www.epa.gov/oecaagct/lcla.html
6
Links have since been established between this typology and the ecosystem services typologies that arose with the development of an ecosystem services science. For a historical review of the ecosystem services theory and practice, the reader can refer to the article of Gómez-Baggethun et al. published in 2009. The concept of ecosystem service emerged in the economic valuation literature in the late 1990s. The Millennium Ecosystem Assessment (MA, 2003) was a critical landmark that firmly established the ecosystem services concept on the policy agenda (Gómez-Baggethun et al., 2009). While based on an anthropocentric approach, the MA framework stressed human dependency not only on ecosystem services, but also on the underlying functioning of ecosystems, making visible the role of biodiversity and ecological processes in human well being (MA, 2005). Since then, the literature on ecosystem services and its uptake at all policy levels has increased dramatically (Fisher et al., 2009). The new challenge of economic valuation became to estimate, in monetary terms, the value of these ecosystem services. Efforts were made to better classify ecosystems services and their associated values, with distinctions between functions, processes and benefits (e.g. Fisher et al., 2009; Balmford et al., 2011), also in order to avoid possible double counting issue that arose for example with the well-known MA classification (Fisher et al., 2009). Several typologies (see Appendix B for an example) regarding ecosystem services and associated economic values were proposed (e.g. de Groot et al., 2002; Balmford et al., 2011), with the objective of being integrated into governance to improve decision-making (Daily et al., 2009). In addition, methods aimed at establishing monetary measures of each group of values and associated services were developed and refined. Techniques and methods can be broadly grouped into two categories: revealed preference (RP) methods and stated preference (SP) methods. The former attempts to value public goods using actual consumer behaviour by examining marketed goods that are related to the public good (Freeman, 2003). Market data can be retrieved regarding purchased goods that are complementary to the public good, or through inputs to the household’s production function, to derive a demand curve (Garrod and Willis 1999). RP approaches include (Liu et al., 2010): market methods (also known as Adjusted market prices), productivity (or Dose-Response) approaches, travel cost methods and hedonic pricing methods (details on these methods are given in Appendix B). The second type of approach, namely SP methods, is used in the valuation of public goods where limited (or no) real or associated market data exists. Thus values are based on willingness to pay (WTP) or willingness to accept (WTA) that are generally elicited through a questionnaire. SP methods are the only methods available for estimating non-use values, or any WTP/WTA
7
when no behavioural data exists. They include: the Contingent Valuation Method (CVM) where people are directly asked their willingness to pay or accept compensation for some change in ES, and Discrete choice experiments (DCE) where people are asked to choose or rank different scenarios concerning ES, or ecological conditions that differ in the mix of those conditions.
In addition to revealed and stated preference methods, other commonly employed approaches in ESV should be mentioned. The first are commonly referred to as cost-based methods: replacement cost and avoidance cost (also known as Avoided damages). The second is benefit transfer, which is based on the adaptation of existing ESV information or data to new policy contexts that have little or no data, and thus estimate values in a far less expensive process. The latter method has raised many issues and concerns, and the possibility of its application is carefully discussed and studied within a specific part of the academic literature (e.g. Plummer, 2009)7.
x Application to coastal and marine ecosystem services
The different values of coastal and marine ecosystems services, and the most frequently encountered valuation methods, are synthesized in Figure I-1 below.
Numerous works have focused on valuing services associated with CME, using the various methods available. Several general reviews have already been undertaken regarding these applications (e.g. Barbier, 2012; Barbier et al., 2011; TEEB, 2010; Pendleton et al., 2007; Brander et al., 2007; and Heal et al., 2005 among others). Other reviews have focused on specific areas. For example, Schuman (2011) undertook valuation studies in the Caribbean, Laurans et al. (2013a) reviewed coral reefs economic valuation in the South Pacific, Stoeckl et al. (2011) presented the state of knowledge concerning economic value of ecosystem services in the Great Barrier Reef, and Gillespie and Bennett (2011) reviewed economic valuations studies through the use of DCE in Australia concerning Marine Protected Areas (MPA).
7
An associated issue is the meta-analysis techniques, which is a statistical analysis of results from multiple but similar empirical studies. In environmental valuation contexts, this can help determining what factors statistically influence values and thus better guarantee the success of benefit transfers (see Brander et al., 2007, for an example on the recreational value of coral reefs).
9
The economic values associated with these services have been shown to be substantial. For example, in Hawaii, fisheries benefits have been estimated to be $1.3 million per year, and total net benefits for all services of $360 million a year (Cesar and van Beukering, 2004). In American Samoa, the total economic value of reefs has been estimated to US$14,300 per km2 in American Samoa (Spurgeon, 2004). Regarding aquarium trade, global benefits have been estimated to reach $90 to $300 million per year in 2002 (Sadovy et al., 2002). Barbier (2012) presents other examples in his review.
Regarding tourism and recreational activities, Brander et al. (2007) reviewed 166 studies estimating recreational values, and noted that the average value of coral reef recreation is US$184 per visit. However, they also found that the median value is US$17 per visit, showing that the distribution of values is skewed with a long tail of high values (Brander et al., 2007), thus highlighting substantial value variations among studies. For example estimates range from around US$1000 per km2 in the Philippines (Samonte-Tan et al., 2007) to around US$50,000 per km2 in some Caribbean islands (Burke et al., 2008).
Another crucial ecosystem service provided by coral reefs is the protection of coastal human populations, property, and economic activities from storms. Values found are usually substantially higher in comparison to other services, sometimes estimated as one third of the total economic value of the reef (Laurans et al., 2013a): as such they have been shown to range from around 10 US$ per km2 in Indonesia (Riopelle, 1995) or Vanuatu (Laurans et al., 2013a) to more than US$ 10,000 per km2 in the Caribbean (Burke et al., 2008). Unfortunately, the reliability of many economic estimates of storm protection has been questioned because they tend to use benefit transfer and replacement cost methods in an ad hoc way (Chong, 2005).
Finally, regarding non-use values, although some work has been conducted (e.g. Ahmed et al., 2004; Curtis, 2004; van Beukering et al., 2006; O’Garra, 2009), it is clear that there is still an important lack of estimates in the literature (Spurgeon, 2004; Schuman, 2011; McCartney, 2011; Laurans et al., 2013a), which is mainly due to various challenges associated with their estimation. However, non-use values have been argued of being of the utmost importance as they can potentially outweigh use values in coral reefs regions inhabitants (Spurgeon, 2004).
10
Key challenges
2.
In parallel to this rapid development of ESV, controversies on monetization and commodification of nature's benefits have also arisen. Growing concerns – from economists as well as scholars from other disciplines (e.g. ethics and philosophy, ecology, anthropology) – about valuation methods and more broadly about the application of the neoclassical economics framework of analysis to environmental management issues have been expressed. This led to the development of Ecological Economics, which share some common ground with other economic schools and paradigms such as Post-Keynesianism or institutional economics (Vatn, 2010), as well as ecology (e.g. resilience), environmental ethics (e.g. the precautionary principle) and philosophy (e.g. incommensurability) (O’Neil et al., 2007). Founders of this new school of thought argued the crucial need for a more trans-disciplinary academic research agenda regarding ES management issues, and for greater interdisciplinary cooperation between economists and natural scientists. A brief summary of the main limits and debates that arose during the development of Ecological Economics is given in Appendix C. Those include discussions about: sustainability and Natural capital, limits to the underlying model of economic behaviour and systemic approaches to social-ecological interactions. Environmental and ecological economics have strongly interacted all along, with criticism or concerns from one domain feeding new theoretical or methodological developments in the other. In relation to this, the past decades saw the development of new valuation techniques (e.g. Discrete Choice Experiment) and continuous refinement of previous existing ESV methods as well as decision-making tools (e.g. Cost-Benefits Analysis and Multi-Criteria Decision Analysis). However, strong debates and criticism about the validity and robustness of valuation exercises persist, especially regarding non-market valuation. These debates mainly focus on the capacity for economic valuation methods to provide relevant information, in view of the extreme complexity of: (1) the functioning of ecosystems (e.g. non-linearity, irreversibility, adaptability, uncertainty and interconnectivity); and (2) Human interactions with ecosystems. The second point also relates to the multi-dimensionality of the value concept. While in some cases there is an obvious monetary dimension in an ES value (e.g. provision of food through commercial fisheries), it is less obvious in others (e.g. cultural importance of landscape features, and benefits associated with the preservation of species or ecosystem never to be encountered or used), and it is certainly harder to estimate. This is typically the case for non-use value: on one hand this constitutes one of the most compelling
11
reason for ecosystem preservation, on the other hand its characterisation and estimation are complex and controversial.
More broadly, such concerns about the reliability or even the relevance of ESV raise the issue of its use and usefulness in support of decision-making. Indeed, these concerns may hinder the economic valuation exercise as well as the uptake of estimated values by decision-makers. The aim of this PhD is to progress understanding in these two key areas of ESV applied to CME management and preservation: the estimation of non-use values, alongside non-market use values; and the use and influence of ESV in decision and policy-making.
x Estimating non-use values
Non-use values and their estimation through stated preference methods crystallize an important part of the debates and criticism concerning the validity and robustness of ESV valuation methodologies and theory.
The concept of non-use values (as originally introduced by economists) has been widely discussed by researchers from multiple disciplines (economists, biologists, philosophers and social scientists), and was described as involving several dimensions, some of which may be incommensurable. Although present in all major typologies, confusions and conflations amongst non-use values’ dimensions are frequently encountered (Chan et al., 2012), and issues about the economic definition of non-use values and subsequent quantification have been debated intensively in the academic literature (e.g. Loomis, 1988; Kahneman and Knetsch, 1992; Castle et al., 1994; Lazo et al., 1997; Chan et al., 2012).
The question of quantitatively estimating non-use values (NUV) arose because of the need to justify conservation in a cost benefit analysis framework. NUV became a crucial component of ESV, and were increasingly estimated in non-market valuation, especially when assessing the socio-economic impacts of natural resource damages (Carlson et al., 1992) or of conservation actions (Hoagland et al. 1995). Indeed, even if in some cases, terrestrial and marine based conservation could be shown to produce substantial use values that justify the cost of their establishment; in many others, use values generated by ecosystems are much more limited and the cost of preservation might well be justified mainly from non-use benefits. In marine ecosystems, for example, offshore marine conservation provides almost totally non-use benefits, especially if fishing activity is removed from the area as part of the conservation plan (e.g. McVittie and Moran, 2010).
12
In practice, since no real market behaviours are observable, non-use values are estimated through stated preference methods. Their estimation is especially complex when the valuation exercise focuses on individuals who interact directly or indirectly with the ecosystem services being considered (i.e. users); and the standard approach for estimating non-use values of users has substantial shortcomings, which undermine the robustness of its results (Cummings and Harrison, 1995). Their estimation is also complex when focusing on marine ecosystems, where in some cases the issue is further complicated by the fact that many individuals will never observe the key ecological features protected, nor know what functions they have. Therefore, several issues related to non-use values entail a need for further research:
- There are still some debates regarding non-use values and their associated economic quantification alongside non-market use values;
- Non-use value estimations should be able to account for the preferences of both non-users and non-users, without obfuscation by use values for the latter;
- The theory and method behind the estimation of non-use values should be able to account for possible concerns regarding standard behavioural model assumptions, notably incommensurability and non-compensatory preferences;
- There is a need for robust and reliable non-use value estimates regarding marine and coastal ecosystems, especially coral reef and associated ecosystems. There is also a lack of estimates for coastal indigenous communities, which may hold extremely important non-use values for marine ecosystems.
x Use and influence of ESV
The substantial amount of valuation work that has been done, as well as the different challenges faced by ESV, raise the crucial issue of the use and actual role which economic valuation can play in ES management and policy-making, since the main raison d’être of ESV is to support decision-making.
After decades of continuous practice and progress, growing concern has developed among academics and practitioners regarding the actual impact of valuation on decision-making and its implementation into the “Real World” (e.g. Lopes and Videira, 2013; Rogers et al., 2013; Laurans et al., 2013b; Billé, 2012; Goldstein et al., 2012; Balmford et al., 2011; de Groot et
13
al., 2010; Liu et al., 2010; Daily et al., 2009). Consequently, several decision-making tools based on ESV or including ESV were developed and implemented (e.g. InVEST software8). Despite the growing interests and efforts in bridging ESV and decision-making, it is clear that there is still a significant paucity of work looking at the actual utilization of economic valuation by decision-makers in the academic literature (Laurans et al., 2013b), by which we mean: what values are actually utilized, how are they used (for what precise purpose, in which decision context and by whom) and to what extent? This is a crucial unexplored research direction in the economic valuation literature. In most valuation work, it is in fact uncommon to encounter a detailed examination of the actual or potential use of the values that were estimated. Usually methods are discussed, values are estimated, and presented as potentially useful, with no specification regarding actual decision-making contexts where these will/could be used in specific ways, or without mentioning if these are answering a need for a precise management objective. In short, their ultimate influence on decision-making remains largely unexplored.
Even if there is obviously a demand for economic valuation from decision makers or stakeholders, it is also possible that there is a far bigger supply from academics and practitioners, or that this supply is not completely adapted to decision-makers needs. Very few studies conducted an in-depth analysis of the perceptions of different stakeholders regarding the usefulness and contextualized utilization of ESV, and about the factors that could promote or limit the extent to which economic valuation results are actually considered or referred to (e.g. Rogers et al., 2013).
Furthermore, since ESV is certainly not exhaustive and sufficient to fully support decision-making, there is also a need to compare the role of economic valuation in comparison to other kinds of descriptors of values, such as social acceptability or opinion polls, or ecological indicators. Indeed, decision-making relies on many different kinds of information processing associated with different – and often competing – objectives. As Liu et al. (2010, p.69) noted: “The key issue here comes down to trade-offs. If one does not have to make trade-offs between ecosystem services and other things, then valuation is not an issue. If however, one does have to make such trade-offs, then valuation will occur, whether it is explicitly recognized or not. Given this, it seems better that the trade-offs be made explicit.” In establishing the actual and potential role of ESV in decision-making, it is thus necessary to
14
identify the relative importance which may be granted to this information, alongside alternative types of information To our knowledge, no previous study has examined the weight placed on ESV among other indicators in a specific decision-context.
All these observations are also true for CME, where even less work concerning the interface between ESV and decision has been realized. The question still remains: what impact did it have on marine management? In other words, what do we know about the use and influence of economic valuation on decision making regarding CME? Is ESV perceived as having answered or having the capacity to answer decision-makers and associated stakeholders needs?
Research objectives
3.
This PhD research aims to progress understanding of ESV, based on two complementary perspectives: first, address one of the most challenging ESV quantification problems; and second, assess the actual and potential use of ESV in decision-making. In short: is economic valuation able to estimate all the non market values it claims it does, and to what extent is it actually making a difference in decision-making regarding ES management? More precisely our first aim is to explore the potential and limitations of economic valuation in addressing the contested issue of non-use values and the way to measure them alongside non-market use values through stated preference methods. Our second aim is to explore the actual and potential influence of ESV on decision-making, alongside other types of economic and ecological information.
These two objectives are tackled with a focus on CME, and a focus on two case studies, namely New Caledonian and Australian marine and coastal areas. The two case studies were selected taking advantage of the joint status of this PhD, between the Université de Bretagne Occidentale (France) and Queensland University of Technology (Queensland, Australia). The proposed approach to cope with our first objective is to focus on the capacity for non-market valuation to estimate both use and non-use values, with an application to New Caledonian coral reef ecosystems. Three major challenges addressed relate to (i) the quantitative estimation of use values alongside use values, (ii) the issue of non-compensatory preferences and limits of the standard rational behaviour model underlying economic valuation, especially as regards the hypothetical payment involved, and (iii) the impacts of socio-economic, cultural and environmental contexts on values and underlying preferences.
15
These challenges are addressed through two different pieces of research. The first focuses on the measurement on non-use values by: (1) critically reviewing the literature on non-use values in ESV; (2) filling an important gap in the literature by offering a pragmatic economic interpretation of non-use values which allows estimating these values for users in addition to and separately from use values; (3) offering a methodological framework using Discrete Choice Experiment to put this interpretation into practice; (4) conducting an empirical application in two coastal areas of New Caledonia, for heterogeneous population mostly composed of users of the coastal ecosystems; and (5) critically discussing the approach used, including the econometric specification of the models retained to analyse the results of the experiments, and the potential role for non-use values in support of decision making, given the results obtained.
The second piece of research focuses on an important issue that can arise when studying non-use values or more broadly when using stated preference methods: dealing with possible lexicographic or non-compensatory preferences through the issue of payment non-attendance in Discrete Choice Experiment, which precludes the estimation of welfare estimates. Based on several techniques available in choice modelling, it offers a methodological strategy to cope with payment non-attendance and apply it using the data from the New Caledonian case study.
With respect to the second research objective, we examine how and to what extent the Australian general public as well as different Australian stakeholders involved in conservation decision-making processes actually apprehend and use ESV in specific management contexts regarding CME in Australia. After having conducted a literature review on the use of ESV, both at the international and Australian levels, we develop a methodology to investigate this question. A quantitative and qualitative survey is designed to collect data on the perceived usefulness and use of ESV for decision-making. This survey aims at: (1) Documenting the knowledge and perceived usefulness of different types of ES values; (2) Studying the demand and preferences of stakeholders regarding information available through economic valuation; (3) Studying the preferences of stakeholders regarding ESV information, relative to other kinds of information such as ecological indicators/predictions and social acceptability or opinion polls; and (4) Comparing the knowledge, use and perceived usefulness of ESV information by the general public and decision-makers.
16
Structure of the thesis
4.
This PhD is structured as follows. The first part, which is about the quantification of ecosystem services economic values, contains two chapters. Chapter 1 examines the issue of measuring non-use values, alongside non-market use values, and presents an empirical application conducted in New Caledonia based on Discrete Choice Experiments. Chapter 2 examines, both methodologically and empirically, the issue of non-compensatory preferences in Discrete Choice Experiments, more precisely the payment non-attendance issue. It presents results from the New Caledonian case study.
The second part, which is about assessing the use of ecosystem services values, contains two chapters. Chapter 4 presents a study about the perceived usefulness of ESV in decision-making, based on the design and results of two surveys: one focusing on the decision-makers, the other one focusing on the general public, in Australia. Chapter 5 presents the methodology developed as part of these surveys to assess the weight attached to the relative importance of ESV among other ecological and socio-economic indicators in decision-making by the decision-makers and the general public, and its results.
Finally, the last part presents an overall discussion and conclusion, in relation to our objectives, based on the various methods developed in this research work and the results from our different case studies.
17
Part 1: Quantifying ecosystem services
values
18
Introduction
This part presents the motivations and results of a survey work carried out in New Caledonia from December 2010 to February 2012. This survey was funded and conducted under the French National Initiative For Coral Reefs (IFRECOR) program (see Appendix D), and the results were expected in 2012 by French and New Caledonian public institutions (French Ministry for Ecology and Sustainable Development, French Ministry for Overseas Territories, French Republic High Commission of New Caledonia). It is therefore important to note that this work was subject to two distinct contexts: the supervision, coordination and implementation of a study for a non strictly academic program with pre-defined objectives, timing, and expected outputs, and an academic PhD research work that aimed at exploring the issue of estimating both non-market use and non-use values for users in a theoretically and methodologically sound way.
The first chapter focuses on the issue of measuring non-use values (i.e. economic values assigned by individuals to ecosystem goods and services independently from his current or future uses) alongside non-market use values using a stated preference method. Indeed, the standard approach for estimating non-use values of users has substantial shortcomings, which undermine the robustness of their results. After conducting a literature review on non-use values, it presents: (1) a new methodological framework developed to assess both non-market use and non-use values based on a pragmatic interpretation of non-use: any value/willingness to pay for preserving an ecosystem beyond a person’s expected life can be assumed to be a minima but exclusive means of non-use values; (2) the practical steps followed to apply this method using the discrete choice experiment (DCE) technique, which is widely and increasingly used in ecosystem services valuation; (3) the empirical application in two coastal areas in New Caledonia with different institutional, environmental and socio-economic contexts; and (4) the econometric analysis conducted to derive welfare estimates and isolate a non-use values component for users, through different choice models, with subsequent conclusions and discussions.
The second chapter looks at the issue of payment non-attendance in Discrete Choice Experiment (DCE), which is of paramount importance since it pertains to the mere existence of welfare estimates and thus can have some significant consequences on the main conclusions given by the valuation study. We propose a methodology that allows an in-depth analysis of this issue by comparing multiple modelling approaches in terms of: (1) inferred