Cellular biophysical markers of
hydroxyurea treatment in sickle cell disease
The MIT Faculty has made this article openly available.
Please share
how this access benefits you. Your story matters.
Citation
So, Peter T. C., et al. "Cellular Biophysical Markers of Hydroxyurea
Treatment in Sickle Cell Disease." Proceedings Volume 10251,
Biomedical Imaging and Sensing Conference, 19-21 April, 2017,
Yokohama, Japan, edited by Toyohiko Yatagai et al., SPIE, 2017, p.
1025103. © 2017 SPIE.
As Published
http://dx.doi.org/10.1117/12.2273139
Publisher
SPIE
Version
Final published version
Citable link
http://hdl.handle.net/1721.1/115510
Terms of Use
Article is made available in accordance with the publisher's
policy and may be subject to US copyright law. Please refer to the
publisher's site for terms of use.
PROCEEDINGS OF SPIE
SPIEDigitalLibrary.org/conference-proceedings-of-spie
Cellular biophysical markers of
hydroxyurea treatment in sickle cell
disease
Peter T. C. So, Poorya Hosseini, Sabia Z. Abidi, E. Du,
Dimitrios P. Papageorgiou, et al.
Peter T. C. So, Poorya Hosseini, Sabia Z. Abidi, E. Du, Dimitrios P.
Papageorgiou, YongKeun Park, John Higgins, Gregory J. Kato, Subra
Suresh, Ming Dao, Zahid Yaqoob, "Cellular biophysical markers of
hydroxyurea treatment in sickle cell disease," Proc. SPIE 10251, Biomedical
Imaging and Sensing Conference, 1025103 (18 April 2017); doi:
10.1117/12.2273139
Event: SPIE Technologies and Applications of Structured Light, 2017,
Yokohama, Japan
Weasel CO :a:et'Grt cpt :cal phase ce ay - Morphology Eccentricity Surface Area Volume - Biomechanics Bending Modulus Shear Modulus Viscosity rqumenm Shepo Wm) Oaspóscomimt Map (nm)
r-,
-..
I
.a
. _.-`
Cellular Biophysical Markers of Hydroxyurea Treatment
in Sickle Cell Disease
Peter T. C. So1,2,3, Poorya Hosseini,1,2,3 Sabia Z. Abidi,4 E. Du,5 Dimitrios P. Papageorgiou,4 YongKeun Park6, John Higgins,7 Gregory J. Kato,8 Subra Suresh,9 Ming Dao,4* Zahid Yaqoob1*
1Laser Biomedical Research Center, Massachusetts Institute of Technology, Cambridge, MA 02139
2 Department of Mechanical Engineering, Massachusetts Institute of Technology, Cambridge, MA 02139
3 Department of Biological Engineering, Massachusetts Institute of Technology, Cambridge, MA 02139
4 Department of Materials Science and Engineering, Massachusetts Institute of Technology, Cambridge, MA 02139
5Department of Ocean and Mechanical Engineering, Florida Atlantic University, Boca Raton, FL 33431
6Department of Physics, Korea Advanced Institute of Science and Technology, Daejeon 34141, Republic of Korea
7Department of Systems Biology, Harvard Medical School, Boston, MA 02115
8 Department of Medicine, Division of Hematology-Oncology, University of Pittsburgh, Pittsburgh, PA 15261
9Department of Materials Science and Engineering, Carnegie Mellon University, Pittsburgh, PA 15213
Summary: Hydroxyurea (HU) has been used clinically to reduce the frequency of painful crisis and the
need for blood transfusion in sickle cell disease (SCD) patients. However, the mechanisms underlying such beneficial effects of HU treatment are still not fully understood. Studies have indicated a weak correlation between clinical outcome and molecular markers, and the scientific quest to develop companion biophysical markers have mostly targeted studies of blood properties under hypoxia. Using a common-path interferometric technique, we measure biomechanical and morphological properties of individual red blood cells in SCD patients as a function of cell density, and investigate the correlation of these biophysical properties with drug intake as well as other clinically measured parameters. Our results show that patient-specific HU effects on the cellular biophysical properties are detectable at normoxia, and that these
properties are strongly correlated with the clinically measured mean cellular volume rather than fetal hemoglobin level.
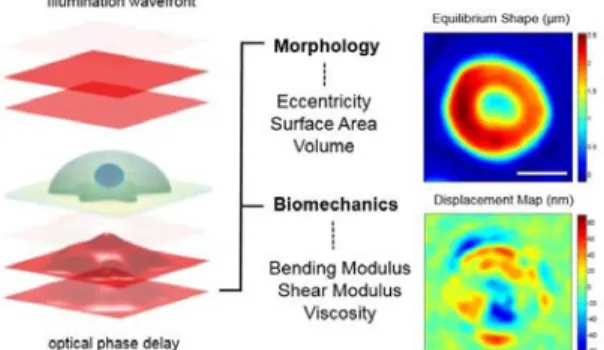
Sickle cell disease, including the most common form, sickle cell anemia, is an inherited blood disorder caused by a single point mutation in the β-globin gene (1). Sickle hemoglobin (HbS) has the unique property of polymerizing when deoxygenated, triggering red blood cell (RBC) sickling and rigidification, leading to vaso-occlusion and impaired blood flow in capillaries and small vessels (2). Therefore, the pathophysiology of SCD is critically influenced by the oxygen partial pressure affecting the biomechanical properties of RBCs and their corresponding hemodynamic properties in microvasculature. In this work, we investigate the irreversible changes red cells undergo in the blood circulation in SCD patients at normal oxygen conditions. Figure 1 shows how morphological and biomechanical properties of the red cells are characterized through quantifying the defomations of the wavefront after passing through the cell. Measurements of the cellular biophysical properties of
Fig. 1. Optical measurement of morphological properties of RBCs. Morphological information about the
sample (eccentricity, surface area and volume) are obtained from deformations of the optical wavefront after its traversal through RBCs. The phase delay of the optical wave front after passing through the sample is related to optical properties and morphology of the sample and can be accurately measured through advanced interferometry. Accurate measurements of the morphology over time reveal thermal fluctuations that cause out-of-plane displacements of the cell membrane (bottom right image), which provide insights into the biomechanics of the whole cell (bending and shear modulus as well the cytosol viscosity). Scale bar i 4
Invited Paper
Biomedical Imaging and Sensing Conference, edited by T. Yatagai, Y. Aizu, O. Matoba, and Y. Awatsuji, Proc. of SPIE Vol. 10251, 1025103 · © 2017 SPIE · CCC code: 0277-786X/17/$18 · doi: 10.1117/12.2273139
Proc. of SPIE Vol. 10251 1025103-1
nuca.uop.n) b m. c.a.;
ii
b. 20 w 10 20 uclwdaM OM) 40 30 20 euce..xonc (nm) Lye, . ,,,, fIS asti
b " 60 40 tv 20 0 fluctuations (nm) o r 00*
oOs
OoLO o oIt
o e 0#
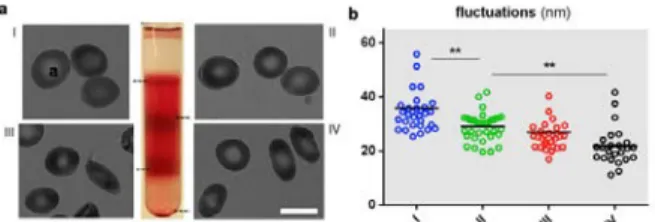
pred cells using transmission-type quantitative phase instruments is affected by the refractive index differences of individual cells; and normally an average value is assumed for the whole population under study. Here, we have improved the accuracy of such measurements by breaking down blood samples of SCD patients into four density categories that allows for more acurate charaterization of cellular biophysical properties, see Figure 2(a). We show how these biophysical properties
change as a function of the cell density that is related to hemoglobin content in the cytosol, e.g. Figure 2(b). We additionally investigated various biophysical properties of all the density-sorted groups for patients who are on and off HU treatement and managed to identify beneficial effects of HU treatment even under normoxic conditions, e.g. Figure 3(a). All measurements from on- and off-drug populations were grouped together for each density category to study the overall effect of the drug treatment. For almost all properties and all density categories, a statistically significant difference was observed as a result of HU treatment. These results show that RBCs under HU treatment are softer on average regardless of their density. RBCs of patients under HU treatment exhibit a higher volume and a lower surface area to volume on average. There was no clear difference between average eccentricity value for lighter sickle cells, however, denser cells did exhibit a higher eccentricity ratio for patients off HU treatment.
There is a range of clinically measured parameters that provide insights on the status of SCD patients. These laboratory parameters are broadly derived from either cellular evaluation tests such as hematocrit and mean corpuscular volume (MCV), or from the molecular profile tests such as blood composition using gel-electrophoresis. Two well-known responses of HU treatment are the induction of HbF and increase in MCV due to the ability of the drug to induce stress erythropoiesis (3,4). To assess whether MCV and/or HbF can drive differences in biophysical properties at normoxia, we categorized the patient data into low and high MCV and low and high HbF
populations. We observed a statistically significant difference for all properties except eccentricity ratio when the patient data are categorized into low and high MCV populations based on the median MCV value for all patients, suggesting MCV may be the variable driving the observed RBC biomechanical differences. Surprisingly, separation of low and high HbF populations based on the median HbF value for all patients did not reveal any statistically significant differences in the biophysical properties.
1. Ingram VM. Gene mutations in human haemoglobin: the chemical difference between normal and sickle cell haemoglobin. Nature. 1957;180(4581):326–328.
2. Eaton WA, Hofrichter J. Sickle cell hemoglobin polymerization. Adv Protein Chem. 1990;40:263–279. 3. Letvin NL, Linch DC, Beardsley GP, McIntyre KW, Nathan DG. Augmentation of fetal-hemoglobin
production in anemic monkeys by hydroxyurea. N Engl J Med. 1984 Apr 5;310(14):869–73. 4. Platt OS. Hydroxyurea for the Treatment of Sickle Cell Anemia. N Engl J Med. 2008;358(13):1362–9.
Figure 3. (a) amplitude of the cell membrane fluctuations for “on” and “off” the drug patients, higher amplitude generally indicates softer membrane. (b) Cell membrane fluctuations of the erythrocytes of cell patients in our study as a function of density of the hemoglobin inside the cytosol. Left graph shows the patient data categorized based on low and high clinically measured mean cellular volume. Right graph shows the patient data categorized based on low and high levels of fetal hemoglobin in the patient blood. Density I, II, III and IV are 26, 30, 34 and 38 g.dL-1, respectively.
Figure 2. Density fractionation of RBCs from sickle patients and healthy donors. (a) Representative images of RBCs in each density
fraction from blood sample of a sickle patient. I, II, III and IV
represent density fractions that are 26.6, 30.2, 34.1, and 37.8 g.dL-1,
respectively. b) Cell membrane fluctuations of a sickle cell patient as a
function of density of the hemoglobin inside the cytosol.
Proc. of SPIE Vol. 10251 1025103-2