HAL Id: hal-03090627
https://hal.archives-ouvertes.fr/hal-03090627
Submitted on 29 Dec 2020HAL is a multi-disciplinary open access
archive for the deposit and dissemination of sci-entific research documents, whether they are pub-lished or not. The documents may come from teaching and research institutions in France or abroad, or from public or private research centers.
L’archive ouverte pluridisciplinaire HAL, est destinée au dépôt et à la diffusion de documents scientifiques de niveau recherche, publiés ou non, émanant des établissements d’enseignement et de recherche français ou étrangers, des laboratoires publics ou privés.
C57BL/6 congenic mouse NRAS Q61K melanoma cell
lines are highly sensitive to the combination of MEK
and AKT inhibitors in vitro and in vivo
Valérie Petit, Veronique Delmas, Lionel Larue, Jeremy Raymond
To cite this version:
Valérie Petit, Veronique Delmas, Lionel Larue, Jeremy Raymond. C57BL/6 congenic mouse NRAS Q61K melanoma cell lines are highly sensitive to the combination of MEK and AKT inhibitors in vitro and in vivo. Pigment Cell & Melanoma research, Wiley, 2019. �hal-03090627�
C57BL/6 congenic mouse NRASQ61K melanoma cell lines are highly sensitive to the combination of MEK and AKT inhibitors in vitro and in vivo
Valérie Petit1-3, Jeremy Raymond1-3, Christophe Alberti1-3, Marie Pouteaux1-3, Stuart J. Gallagher1-3, Mai Q Nguyen4, Andrew E. Aplin4,5, Véronique Delmas1-3, and Lionel Larue1-3 $ (1) Institut Curie, PSL Research University, INSERM U1021, Normal and Pathological Development of Melanocytes, Orsay, France,
(2) Univ Paris-Sud, Univ Paris-Saclay, CNRS UMR 3347, Orsay, France, (3) Equipe Labellisée Ligue Contre le Cancer
(4) Department of Cancer Biology, Thomas Jefferson University, Philadelphia, PA 19107, USA.
(5) Sidney Kimmel Cancer Center, Philadelphia, PA 19107, USA.
$ Corresponding author: lionel.larue@curie.fr ; Tel: +33 169867107; Fax: +33 169867109
Running title: Mouse NRAS melanoma cell line
Summary
RAS is frequently mutated in various tumors and known to be difficult to target. NRASQ61K/R are the second most frequent mutations found in human skin melanoma after BRAFV600E. Aside from surgery, various approaches, including targeted therapies, immunotherapies, and combination therapies, are used to treat patients carrying NRAS mutations, but they are inefficient. Here, we established mouse NRASQ61K melanoma cell lines and genetically derived isografts (GDIs) from Tyr::NRASQ61K mouse melanoma that can be used in vitro and in vivo in an immune-competent environment (C57BL/6) to test and discover novel therapies. We characterized these cell lines at the cellular, molecular, and oncogenic levels and show that NRASQ61K melanoma is highly sensitive to the combination of MEK and AKT inhibitors. This preclinical model shows much potential for the screening of novel therapeutic strategies for patients harboring NRAS mutations that have limited therapeutic options and resulted in poor prognoses.
Significance
The establishment of novel congenic mouse melanoma cell lines and GDIs mutated for NRAS is a key step towards evaluating various therapies, as RAS tumors are still difficult to target. Proper use of these models will limit the number of therapies that enter clinical phase 1 trials to increase the success rate and thereby reduce the astronomical financial costs of phase 3.
Introduction
Skin melanoma is a malignant tumor that develops from melanocytes, the cells that produce melanin, which are responsible for skin pigmentation. Skin melanoma is a multifactorial disease; risk factors are related to the environment, lifestyle and conditions (chronic or intermittent sun exposure), and individual risk factors (ethnicity, genetic factors, skin pigmentation, abundant nevi). Cutaneous melanoma ranks 9th among all cancers of men and women combined, accounting for 15,404 and 287,723 new cases in France in 2017 (68 million inhabitants) and worldwide in 2018, respectively (Bray et al., 2018; Jéhannin-Ligier et al., 2017). Its incidence has been steadily increasing in most Caucasian populations over the last 50 years. Various classifications of melanoma have been implemented based on clinical, anatomical, histopathological, and, more recently, molecular genetic criteria. Cutaneous melanoma is currently molecularly classified into four major classes: (i) “BRAF mutated” (50% of patients), (ii) “NRAS mutated” (25% of patients), (iii) “NF1 mutated” (10% of patients), and (iv) “others” for approximately 15% (Cancer Genome Atlas Network. Electronic address and Cancer Genome Atlas, 2015).
Surgery is still the primary treatment for most skin cancers but is ineffective in advanced melanoma cases, in which tumors have spread beyond the skin to the lymphatic system, blood circulation, or other parts of the body. Chemotherapy and radiation have been routinely used without objective responses.
In recent years, two parallel approaches have been successful. The first is immunotherapy with ipilimumab or nivolumab/pembrolizumab (monoclonal antibodies directed against CTLA4 or PD1 proteins, respectively) or the two in combination. This approach can be very effective, but a maximum of 60% of patients respond to this type of treatment for reasons that are unknown. The second approach consists of targeted therapy for molecular abnormalities involved in cancer initiation/progression. This therapeutic approach emerged directly from major advances in our understanding of the biology of melanoma, knowledge of signaling pathways, and dissection of the molecular genetics of the disease. In particular, mutated BRAF inhibitors, such as Vemurafenib®, have demonstrated their ability to inhibit the very high activity of the BRAFV600X form. These inhibitors are effective in patients whose melanoma is mutated for this kinase, but not when the melanoma is mutated for NRAS or NF1.
Melanomas carrying mutations for NRAS are aggressive tumors, with thick lesions, a high mitotic index, and a high rate of metastases in lymph nodes. To date, there is no targeted therapy for NRAS, mainly due to the nature of this protein. Here, we established and characterized mouse NRASQ61K melanoma cell lines and genetically derived isografts (GDIs) from Tyr::NRASQ61K mouse melanoma. We then evaluated their sensitivity to a combination of MEK and AKT inhibitors.
MATERIALS AND METHODS Establishment of cell lines
RAS90 [McNRAS1] and RAS91A [McNRAS2] melanocyte cell lines were obtained from Tyr::NRASQ61K transgenic mice that were backcrossed to C57BL/6 and established as previously described (Ackermann et al., 2005; Delmas et al., 2007; Longvert et al., 2011). The Melan-a, 9v [McWT1], and 14d [McWT2] C57BL/6 melanocyte cell lines have been previously described (Bennett et al., 1987; Delmas et al., 2007). The 1007 [MaNRAS1] and 1014 [MaNRAS2] melanoma cell lines were established from melanoma arising from a male and female Tyr::NRASQ61K transgenic mouse, respectively. Small pieces (≈10mm3) of Tyr::NRASQ61K primary tumors were cleaned, washed in PBS, and subcutaneously implanted into the neck-pad of C57BL/6 mice. Once the implanted tumor reached a volume of ≈1 cm3, it was removed from the mouse, tumors were dissociated as single cells prior to establishing them in culture as previously described (Gallagher et al., 2011).
Cell culture
Melanoma cell lines were maintained at 37°C in complete medium, consisting of Ham’s F12 medium supplemented with 10% fetal calf serum, 5 mM L-glutamine, and antibiotics (100 U/mL penicillin and 100 µg/mL streptomycin), in a humidified atmosphere containing 5% CO2. Melanocyte cell lines were maintained under the same conditions in the presence of 200 nM TPA (tetradecanoyl phorbol acetate, Sigma). The Melan-a and Melan-c mouse melanocyte cell lines melanoma cell line were kindly provided by Dr. D. Bennett (Bennett et al., 1989; Bennett et al., 1987).
DNA genotyping
Genomic DNA was extracted from melanocyte and melanoma cell lines and column-purified with the QIAamp Kit (QIAGEN). The presence of the Tyr::NRASQ61K transgene was determined after amplifying and genotyping the appropriate DNA. Fragments containing the NRAS Q61K human sequence were amplified by PCR with primers LL1086 (5’-GAT CCC ACC ATA GAG GAT T-3’) and LL1087 (5’-CTG GCG TAT TTC TCT TAC C-3’). This PCR consisted of 35 cycles at 94°C for 45 s, 56°C for 30 s, and 72°C for 30 s, and generated a product of 399 bp. The gender of the cells (XX or XY) was determined using a combined Smcy and Smcx PCR with primers: LL362 (5’-TGA AGC TTT TGG CTT TGA G-3’) and LL363 (5’-CCG CTG CCA AAT TCT TTG G-3’). This PCR consisted of 35 cycles at 94°C for 1 min, 55°C for 30 s, and 72°C for 30 s, and generated products of 280 and 310 bp for males (XY) but only 310 bp for females (XX) (Pla et al., 2004).
Growth curves and clonogenic assays
Growth curves were established by seeding six-well tissue culture plates with 105 cells in complete medium with or without 200 nM TPA. Three images were taken per well at 24, 48, and 72 h after seeding. Images were also taken just after cell attachment to determine the exact number of seeded cells per well. Cells were manually counted from images (cell counter plugin - ImageJ). For the growth curves established in the presence of the inhibitors, Binimetinib, PD-0325901 or MK-2206 2HCl, the inhibitors were added 24 h after seeding. The doubling time (Dt) was determined using the formula Dt = (t2-t1) x (log(2)/log(q2/q1), with q1 = to the quantity of cells at time t1 and q2 = to the quantity of cells at time t2.
For clonogenic assays, six-well tissue culture plates were seeded with 500 cells in complete medium. The medium was changed 24 h after cell seeding and replaced with complete medium containing the indicated concentrations of Binimetinib, PD-0325901 or MK-2206 2HCl. This medium was left on the cells for either 1 h and replaced with new complete medium or left unchanged. After 15 days of incubation, colonies were fixed with 4% PFA (paraformaldehyde), stained with Crystal violet in 10% ethanol, and counted on images. Experiments were performed in triplicate.
Melanin determination
To determine the amount of melanin per cell line, cells were counted, pelleted, and solubilized by incubation in 1 mL 1 M NaOH for 2 h at 80°C. Samples were then centrifuged at 12,000 rpm for 10 min at room temperature and the absorbance of the supernatants measured at 470 nm. Melanin content was determined by comparison with a standard curve generated for synthetic melanin (Sigma, France).
Western blot analysis
Whole-cell lysates were prepared from melanocytes and melanoma cell lines in ice-cold RIPA buffer supplemented with complete protease inhibitor cocktail and PhoStop phosphatase inhibitor cocktail (Roche, France). For western blotting, 20 µg total protein was separated on a 15% denaturing acrylamide SDS-PAGE gel and the proteins transferred to a nitrocellulose membrane. Membranes were blocked in 5% non-fat milk in Tris-buffered saline supplemented with 0.01% Tween-20 (TBST) and probed with primary antibodies overnight. The signal was detected using peroxidase-conjugated anti-mouse or anti-rabbit secondary antibodies and enhanced chemiluminescence (ECL; ThermoFisher). The primary antibodies used were against ERK (Cell Signaling, 9102), pERK (Thr202/Thr204, Cell Signaling, 9106), AKT (Cell Signaling, 2938), pAKT (Ser473, Cell Signaling 3787), S6 (Cell Signaling, 2317),
pS6 (Ser235/236, Cell Signaling, 4857), and β-actin (Sigma, A5441). All antibodies were used at a dilution of 1/1,000, except β-actin (1/10,000). For NRAS siRNA knockdown experiments, proteins were extracted with Laemmli sample buffer, resolved by SDS-PAGE, and transferred to PVDF membranes. Immunoreactivity was detected using HRP-conjugated secondary antibodies (CalBioTech, Spring Valley, CA) and chemiluminescence HRP-recognizing substrates (ThermoScientific, Waltham, MA) on a VersaDoc Multi-Imager. The primary antibodies used were against NRAS (Santa Cruz, sc-519, dilution 1/1,000), and actin (Sigma Aldrich, A2066, dilution 1/5,000).
Mice and iso-/xenografts
C57BL/6 and Swiss nude mice were purchased from Charles River Laboratories (France). All animals were housed under specific pathogen-free conditions in the animal facility. Animal care, use, and experimental procedures were conducted in accordance with recommendations of the European Community (86/609/EEC) and Union (2010/63/UE) and the French National Committee (87/848). The ethics committee of the Curie Institute in compliance with the institutional guidelines approved animal care and use. Xenograft experiments were performed as previously described (Grille et al., 2003). The 1014 melanoma cells were injected subcutaneously either in the flank of female Swiss nude mice, at a concentration of 8 x 10⁵ cells per flank, or in the flank of female C57BL/6 mice at a concentration of 105 cells per flank. The 1007-melanoma cells were injected subcutaneously in the flank of male C57BL/6 mice at a concentration of 105 cells per flank. Tumor size was measured by caliper every two to three days and the volume (v) estimated as (length x width x height)/2.
Gene expression RT-PCR
RNA was extracted from mouse melanocyte (9v, 14d, R90, & R91a) and mouse melanoma (1007 & 1014) cell lines using the miRNeasy kit (Qiagen, #217004). M-MLV reverse transcriptase (Invitrogen) was used according to the manufacturer's protocol to synthesize cDNA from 1 µg total RNA in combination with random hexamers. The cDNA was used as template for PCR with the NRAS primers LL1086 (5’-GAT CCC ACC ATA GAG GAT T-3’) and LL1087 (5’-CTG GCG TAT TTC TCT TAC C-3’), amplified, and revealed with ethidium bromide.
Transcriptomic analysis
RNA was extracted from mouse melanocyte (9v, 14d, R90 & R91a) and mouse melanoma (1007 & 1014) cell lines using the miRNeasy kit (Qiagen, #217004). RNA integrity (RIN) was measured using an Agilent Bioanalyser 2100 (Agilent Technologies). The minimum threshold
for RNA integrity was fixed at RIN ≥ 9. RNA concentration was measured using a NanoDrop (ND-2000, ThermoFischer). Complementary RNA (cRNA) was synthesized using the GeneChip 3′IVT Plus reagent Kit (ThermoFisher, #902415), according to the manufacturer’s protocol. In brief, total RNA was first reverse transcribed using a T7-Oligo(dT) promoter primer for first-strand cDNA synthesis. After RNaseH treatment and second-strand cDNA synthesis, the double-stranded cDNA was purified and served as template for subsequent in vitro transcription (IVT). The IVT reaction was carried out in the presence of T7 RNA polymerase and a biotinylated nucleotide analog/ribonucleotide mix for cRNA amplification and biotin labelling. The biotinylated cRNA targets were then cleaned up, fragmented, and 11 µg cRNA hybridized to a single GeneChip® Mouse Genome 430 2.0 Array (Affymetrix, #900495). After washing and staining, using the Affymetrix fluidics station 450 (Affymetrix, # 00-0079), the probe arrays were scanned using an Affymetrix GeneChip Scanner 3000 (Affymetrix, # 00-0210). Microarray analysis was conducted using R and package available on Bioconductor (http://www.bioconductor.org). Data were normalized using the Robust Multichip Average algorithm (RMA) from package oligo (Carvalho and Irizarry, 2010) and annotated using a4Preproc (Talloen and Verbeke, 2018) and mouse4302.db. The principal component analysis was performed using the packages FactoMineR (Le et al., 2008) and factoextra (Kassambara and Mundt, 2017). The differential analysis (D.A.) to compare NRAS melanocytes and NRAS melanomas was performed using the Limma package (Ritchie et al., 2015). A heatmap to display the results of the D.A was generated using the pheatmap (Kolde, 2018) and gplots packages. Genes with an adjusted p value under 0.01 and absolute log2 fold-change over 3 were chosen for drawing the heatmap. The Volcanoplot depicting the D.A. results was generated using the ggplot2 (Wickham, 2016) and ggrepel packages. Gene-ontology and enriched pathway analysis were performed using the ClusterProfiler package (Yu et al., 2012).
Reverse-phase protein array (RPPA) analysis
Cell lysates were prepared and analyzed by RPPA, as previously described (Tibes et al., 2006), with 304 antibodies. Triplicate normalized RPPA data were transformed for use with Gene Set Enrichment Analysis (GSEA, Cambridge, MA) software using gene ontology gene sets available from MSigDB (Cambridge, MA), as previously described. A storey value < 0.05 and log2 fold-change > 0.32193 were used as cutoffs for determining significance. Unsupervised and supervised hierarchical clustering heatmaps were produced using log2-transformed sample expression data for antibody lists constructed from either significance cutoffs or a priori pathway information. Calculations were performed using Matlab® (v2017b).
Cells (200,000) were plated in six-well plates and transfected for 4 h with chemically synthesized siRNA at a final concentration of 25 nmol/L using LipofectamineTM RNAiMax (Invitrogen). The medium was then replaced with TPA-free medium and replenished at day 3 if the experiments lasted for more than three days. Cell growth was monitored using the Incucyte® system for an additional five days post-transfection. NRAS siRNA #1 (5’-CAC CAU AGA GGA UUC UUA CUU-3’) and NRAS siRNA #2 (5’-GCA AGU GUG AUU UGC CAA CA-3’) were purchased from Dharmacon Inc. (Lafayette, CO).
Inhibitor treatment in vitro and in vivo
PD-0325901, binimetinib, and MK-2206 2HCl were purchased from Selleckchem. For the in vitro studies, the drugs were dissolved in DMSO as 10 mM stock solutions, stored at −20°C, and adjusted to the final concentration with culture medium. DMSO was used as the vehicle control for the in vitro studies. For the in vivo studies, the drugs were resuspended in 1% CMC (carboxymethyl cellulose) plus 0.5% Tween-80 and administrated by oral gavage. Binimetinib was used at a dose of 10 mg/kg per day and MK-2206 2HCl at a dose of 15 mg/kg per day. The resuspension solution (1% CMC plus 0.5% Tween-80) was used as the vehicle control (mock). Injected mice were treated daily from day 21-post injection for 21 consecutive days. Mice were sacrificed when the tumor volume reached more than 2 cm3.
Results
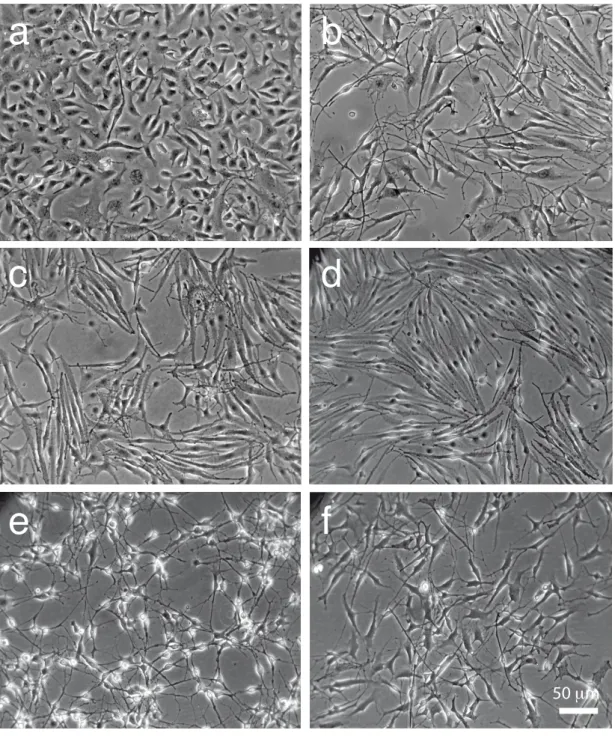
We established melanocyte cell lines in culture from one-day-old C57BL/6 wild type and Tyr::NRASQ61K pups. Tyr::NRASQ61K transgenic mice express the human NRAS protein mutated on amino acid 61, driven by the mouse tyrosinase promoter (Ackermann et al., 2005). The rate of success in establishing these cell lines was similar (approximately 30%), indicating that the presence of the NRAS mutation does not influence immortalization of these cells in culture. The morphology of the two novel NRASQ61K melanocyte cell lines McNRAS1 [90] (or R90) and McNRAS2 [91a] (or R91a) is similar to that of wild type Melan-a, McWT1 [9v] (or 9v) and McWT2 [14d] (or 14d) melanocyte cell lines; dendritic and pigmented (Figure 1a-d, Figure S1a, Table 1). These results suggest that these cells retained their principal melanocytic characteristics. The R90 and R91a melanocyte cell lines contain and express the human NRASQ61K oncogene (Figure S1b,c). Tumors arising from one-year-old Tyr::NRASQ61K mice were engrafted into two-month-old C57BL/6 mice and collected after growth. They were divided into 10-mm3 cubes prior to either freezing in liquid nitrogen in the presence of FCS/DMSO to generate GDIs or establishing them in culture in the presence of medium containing TPA. The morphology of the melanoma cell lines (MaNRAS1 [1007] (or 1007) and MaNRAS2 [1014] (or 1014) is similar to melanocyte cell lines and they are pigmented (Figure 1e,f, Figure S1a). The 1007 and 1014 melanoma cell lines contain and express the human NRASQ61K oncogene (Figure S1b,c). The 9v, R90, R91a, and 1007 melanocyte/melanoma cell lines were established from male mice and the 14d and 1014 melanocyte/melanoma cell lines from female mice; the sex of these cell lines was confirmed by PCR (Table 1).
It is well established that the growth of mouse melanocytes requires mitogenic factors in addition to the standard medium conditions (Bennett et al., 1987; Larue and Mintz, 1990). TPA, a phorbol ester that activates PKC signaling, is used to promote melanocyte growth in vitro. As PKC activates MAPK signaling, we evaluated the requirement of TPA for the growth of 9v wild type melanocytes, R90 and R91a NRASQ61K melanocytes, and 1007 and 1014 NRASQ61K melanoma cells (Figure 2). As expected, wild type 9v melanocytes did not grow without TPA and their doubling time in the presence of TPA was approximately 40 h. The R90 and R91a NRASQ61K melanocytes were unable to grow without TPA, suggesting that NRASQ61K did not sufficiently activate the MAP kinase pathway to promote cell growth. The doubling times of R90 and R91a NRASQ61K melanocytes were similar to that of wildtype 9v melanocytes, both in the presence or absence of TPA. Based on this criterion, R90 and R91a melanocytes are not transformed. The 1007 and 1014 melanoma cell lines were able to grow both in the presence and absence of TPA. However, the doubling time of 1007 cells appeared to be higher in the absence of TPA (40 h vs. 50 h), which was not true of 1014 cells.
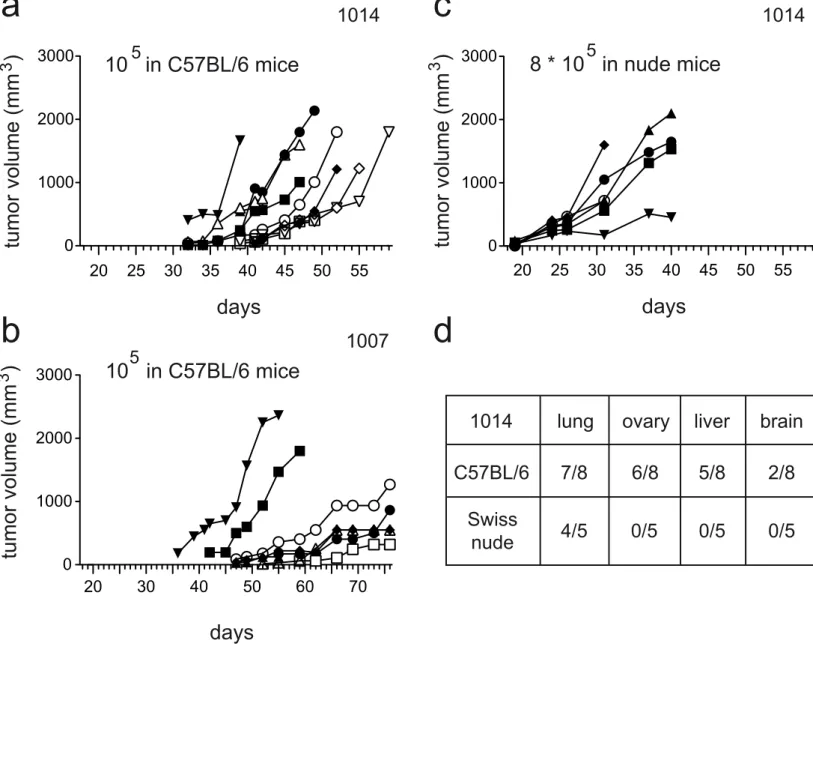
We injected 1014 melanoma cells into female C57BL/6 and nude mice to evaluate their potential to grow in vivo. The injection of 105 1014 cells in two-month-old female C57BL/6 mice was sufficient to reproducibly generate melanomas (Figure 3a). However, injection of the same number of 1014 cells (105) into nude mice resulted in very few mice presenting tumors. The optimal number of cells to obtain reproducible growth in nude mice was 8 x 10⁵ (Figure 3b). We did not evaluate the cause of this difference between C57BL/6 and nude mice, but it may be due to the action of NK cells, as they are more robust and potent in nude mice than C57BL/6 mice. We performed similar experiments with 1007 melanoma cells. They were able to grow in C57BL/6 mice, but took longer to appear, ≈45 days for 1007 vs. ≈30 days for 1014 (Figure 3c). Finally, 1014 melanoma cells could form lung, ovary, liver, and brain metastases when 5 x 10⁵ cells were injected in the tail veins of C57BL/6 mice (Figure 3d). 1007 melanoma cells were unable to colonize the lungs when injected in the tail vein of nude mice (five-month follow up). Four million R90 or R91a cells were injected into six C57BL/6 mice; none presented tumors after five months.
Overall, these results show that the NRAS melanocyte cell lines (R90 and R91a) are not transformed, which is not true of the two NRAS melanoma cell lines (1007 and 1014). However, 1007 melanoma cells appear to be less aggressive than 1014 melanoma cells, based on these criteria (dependence on TPA, growth, and metastasis formation in mice).
We next performed transcriptomic analysis of the wild type (9v and 14d) and NRAS (R90 and R91a) melanocyte cell lines and NRAS melanoma (1007 and 1014) cell lines (Table S1). We first evaluated the levels of the seven key transcription factors for human melanocyte/melanoma (Rambow et al., 2015). The levels of the common melanocytic mRNAs (Mitf, Pax3, Sox10, and Tfap2a) were similar in these cell lines and validated the melanocytic origin of all the cell lines, whereas the levels of Lef1 and Dlx2 were barely detectable. However, the level of Gas7 was significantly higher (adjusted p-value = 4.75 10-3 with a log2 fold-change of 3.00) in the melanoma than melanocyte cell lines (Figure S2a-g). We validated the induction of Gas7 mRNA synthesis in the melanoma cell lines relative to that in melanocyte cell lines by RT-qPCR (Figure S2h). PCA analysis showed the melanocyte cell lines (9v, 14d, R90, and R91a) to cluster together, distant from the 1007 and 1014 melanoma cell lines (Figure S3a). The most differentially expressed genes (log2 fold-change > 3), with an adjusted p-value < 0.01 between melanocytes and melanoma, are given as a heatmap (Figure S3b). As expected, Gas7, Chd4, Fscn1, Tubb5, Igfbp4, and Pik3cd emerged were induced and Mecom, Atrx, Nrcam, and Nfix repressed in the melanoma cells. We generated a volcano plot after comparing the NRAS melanocyte (R90 and R91a) and melanoma (1007 and 1014) cell lines (Figure S3b). GO, KEGG, and MSigDB analysis was performed on 889 differentially expressed genes defined from the differences between NRASQ61K melanocyte and NRASQ61K melanoma cell lines (FC > 1 and adjusted
p-value < 0.05). These analyses revealed the main differences between the NRASQ61K melanocyte and NRASQ61K melanoma cell lines to be associated with chromatin organization, the mRNA machinery, and cytoskeleton modifications (Figure S4).
The second dimension of the PCA showed the 1007 and 1014 melanoma cells to be different (Table S2). These results were not surprising, as Tyr::NRASQ61K melanoma could be divided in two classes by transcriptomic analysis (data not shown). GO analysis showed that the 1007 melanoma cells express higher levels of genes associated with sugar metabolism, including that of glucose, carbohydrates, hexose, and monosaccharide, than 1014 melanoma cells.
NRAS controls the MAPK and PI3K signaling pathways. We thus evaluated the level of proteins of these two pathways (Erk, p-Erk, Akt, p-Akt, S6, and p-S6) in the melanocyte and melanoma cell lines in the presence or absence of TPA (Figure 4a). The levels of Erk and Akt, were similar in the cell lines in the presence or absence of TPA. An increase in the levels of p-Akt and p-Erk was not induced by TPA treatment of the melanoma cells. However, the level of S6 was higher in the melanocyte cell lines in the presence of TPA, but this induction was modest or not observed in the melanoma cell lines. The mechanism by which the level of S6 protein in melanocytes is induced in the presence of TPA is still unknown. The level of p-S6 was higher in the presence of TPA in all cell lines as expected
(Trevillyan et al., 1984). p-S6 and p-Akt were barely detectable in the 9v, R90, and R91a melanocyte cell lines in the absence of TPA.
Next, we evaluated the requirement for NRAS on cell growth in the NRAS melanoma cell lines. We knocked down NRAS in both the 1007 and 1014 cells at 48 h using two independent siRNAs (Figure 4b). Knockdown was associated with a reduction in cell confluency relative to control knockdowns (Figure 4c,d). siRNA #2 led to a larger reduction in cell growth than siRNA #1. We then used RPPA to examine the signaling changes with > 300 phospho- and total protein antibodies. The levels of nine epitopes were affected after reducing the level of NRAS in both the 1007 and 1014 melanoma cells (Figure 4e, Figure S5). Upon knockdown of NRAS, there was a significant reduction in the NRAS effectors p-S6 (S235-236), p-p90 RSK (T573), and insulin receptor in both cell lines. The reduction of NRAS levels can also induced a reduction in the level of phosphorylation of AKT (T308 and S473), CDC2-pY15, CYCLIN E1, and S6-pS240/S244 and an increase in the level of LRP6-pS1490. Thus, the Mapk and Akt signaling pathways are dependent on the presence of the activated form of human NRASQ61K in these melanoma cell lines.
We evaluated the action of binimetinib (a Mek inhibitor) and MK-2206 2HCl (an Akt inhibitor) on 1014 melanoma cells in vitro and in vivo. As expected, binimetinib had a dose-dependent effect on the phosphorylation of Erk and no effect on the phosphorylation of Akt (Figure 5a). We evaluated the growth of 1014 melanoma cells in the presence or absence of
TPA and in the presence of various doses of binimetinib (Figure 5b,c). A minimum of 10-3 µM binimetinib was required to affect the growth of 1014 melanoma cells in the presence or absence of TPA. We evaluated the cytotoxicity of binimetinib against 1014 melanoma cells using a colony-forming assay. Binimetinib was added to the cells 1 h before allowing them to form colonies for 15 days (Figure 5d). Under these conditions, 1 µM binimetinib was sufficient to reduce the number of colonies by approximately 90%. Moreover, 0.01 µM binimetinib had a similar effect when the drug was present for the entire period of growth. We obtained similar results with another MEK inhibitor, PD-0325901 (Figure S6). Similarly, MK-2206 2HCl had a dose-dependent effect on the phosphorylation of Akt and no effect on the phosphorylation of Erk (Figure 6a). We evaluated the growth of 1014 melanoma cells in the presence or absence of TPA and in the presence of various doses of MK-2206 (Figure 6b,c). In the absence of TPA, the action of MK-2206 on the growth of the cells was observable at a very low dose (10-3 nM). However, 10 nM MK-2206 was required to block the growth of these cells. In the presence of TPA, the effect of MK-2206 on 1014 melanoma cells was slightly less than in its absence. We evaluated the cytotoxicity of MK-2206 against 1014 melanoma cells using a colony-forming assay. MK-2206 was added to the cells for 1 h before allowing them to form colonies for 15 days (Figure 6d). Under these conditions, 10 nM MK-2206 was sufficient to reduce the number of colonies by approximately 90%.
We then evaluated the action of MK-2206 and binimetinib on the growth of 1014 melanoma cells in vitro and in vivo in C57BL/6 mice (Figure 7, Figure S7). In vitro, the action of the two compounds on 1014 cell growth after three days of treatment was additive (Figure 7a). In vivo, MK-2206 did not affect the growth of melanoma cells at a dose of 15 mg/kg, whereas binimetinib efficiently inhibited tumor growth at a dose of 10 mg/kg. Importantly, the combination of MK-2206 and binimetinib was remarkably efficient in stopping the growth of NRAS melanoma in vivo (Figure 7b).
Discussion
The establishment of genetically coherent mouse, tumor, and cell-line (transformed and non-transformed) models is of great importance for better understanding the physiology, physiopathology, and cell and molecular biology associated with genetic and/or micro-environmental and/or micro-environmental modifications in an immune-competent environment. Moreover, such coherent models are of importance for the testing of novel therapies (Figure 8).
In the case of melanoma, various mouse cell lines have been established for years, including Cloudman S-91 and B16 cells (Cloudman, 1941; Harding and Passey, 1930). Today, B16 is still the most popular mouse melanoma cell line and is used throughout the world. Indeed, B16 melanoma cells have been cited approximately 7,000 times, according to the Web of Science (January 2019), and in 2018, B16 melanoma cells appeared in at least 320 publications. Several B16 melanoma sub-clones have been derived from the original one, including B16.F1, B16.F10, and B16.C3. B16 melanoma cell lines have the advantage of being syngeneic to C57BL/6, growing subcutaneously in C57BL/6 or nude mice, forming metastasis in the lung, being amenable to genetic manipulation, and remaining pigmented. However, this model was generated after multiple aggressive treatments (B. Mintz, personal communication). Thus, the B16 melanoma cell model is not relevant to human skin melanoma, as the mutations do not reflect the human mutations and the key signaling pathways involved in melanomagenesis are profoundly different between this cell line and human melanoma. However, despite its shortcomings, it should not be forgotten that the B16 melanoma cell line has allowed researchers to shed light on numerous crucial processes.
The generation of transgenic mice has allowed the establishment of mouse melanoma models (for review see (Aktary et al., 2018; Larue and Beermann, 2007)). Melanoma cell lines have already been established from some of them. For example, the groups of Constance Brinckerhoff and Marcus Bosenberg established a series of BrafV600E melanoma cell lines, known as D4M and YUMM (Jenkins et al., 2014; Meeth et al., 2016), and that of Thomas Tüting established melanoma cell lines expressing the oncogenic form of CDK4R24C (Bald et al., 2014).
We decided to focus on the NRAS mutation, as this mutation is frequently found in human melanoma and involved in melanoma initiation. Furthermore, no targeted therapy for NRAS mutations is yet available nor C57BL/6 congenic mouse NRAS melanoma cells. Recently, it was shown that the compound ZT-12-037-01 can inhibit the serine threonine kinase STK19, which phosphorylates NRAS on serine S89, leading to its activation (Yin et al., 2019). This new target and compound are promising and may constitute a way to inhibit NRAS activation in melanoma. The Tyr::NRASQ61K mouse melanoma line was previously generated by the group of Friedrich Beermann (Ackermann et al., 2005). We backcrossed
the initial Tyr::NRASQ61K mice to male and female C57BL/6J mice more than 12 times to achieve a minimum of 99.95% C57BL/6J, allowing the establishment of a C57BL/6J congenic Tyr::NRASQ61K mouse line (Longvert et al., 2011). Here, we established and characterized a coherent C57BL/6 mouse NRAS melanoma model, including melanocyte cell lines, melanoma cell lines, GDIs, and the transgenic mouse melanoma model that was already available. We characterized this model at the cellular, molecular, and oncogenic levels.
In vitro, we evaluated the action of MEK and AKT inhibitors in the presence and absence of TPA, as this phorbol ester is known to modify various cellular activities, including proliferation, differentiation, migration, and invasion (Denning, 2012). At the molecular level, TPA activates diacylglycerol (DAG), which in turn activates multiple PKC isoforms, triggering MAPK/MEK/ERK signaling, as well as GSK3-beta and IKK-beta signaling. Aside from the activation of proliferation, PKC enzymes profoundly influence actin cytoskeleton organization and several PKC isoforms have been shown to colocalize with various specific components of the actin, vimentin, and/or tubulin cytoskeleton (Szalay et al., 2001). The activation of these PKC isoforms and subsequent cytoskeletal reorganization may strongly influence the efficacy/availability of MEK inhibitors. However, our results did not show the mixture of TPA and MEK/AKT inhibitors to have much of an effect on the growth of these cells.
The action of the combination of MEK and AKT inhibitors on this mouse NRAS melanoma model was very efficient. Nonetheless, it is highly probable that the combination of MEK and AKT inhibitors on NRAS melanoma patients is not sufficient. Indeed, trametinib and GSK2141795 were used in combination on NRAS and "WT" human melanoma patients to inhibit MEK and AKT, respectively (Algazi et al., 2018). However, no clinical benefit in NRAS-metastatic patient was observed. These results may reveal different issues: (i) these drugs were not sufficiently specific, (ii) the protocol of administration was suboptimal, and/or (iii) the strategy was not ideal. Indeed, human melanoma is highly genetically and epigenetically unstable (Goodall et al., 2008; Hoek and Goding, 2010; Lawrence et al., 2013). Targeting these two signaling pathways may not be sufficient in this context, as these tumors may carry other abnormalities (genetic or not) that induce natural neo-resistance to these inhibitors. Complementary (combinatory) therapies, including immune therapy, NRAS targeted therapy, or even radiotherapy, could be beneficial for patients. Better molecular knowledge of the patients and their tumors would also be beneficial to optimally adapt treatment
(Najem et al., 2017). For example, the immune checkpoint inhibitors, anti CTLA-4 and anti-PD1/PDL1 can be used in combination with MEK inhibitors with a certain level of success on NRAS-mutated melanoma in vivo. Moreover, the combination of MEK inhibitor, trametinib, and radiotherapy on NRAS-mutated melanoma prolonged G1 arrest and premature senescence in vitro, is well tolerated, and reduces tumor growth in vivo.
Furthermore, the combination of a MEK inhibitor and the reactivation of p53 NRAS-mutated melanoma cells show a strong synergistic effect. Overall, we provide the proof of concept that this NRAS melanoma model can be used to test novel therapies.
In conclusion, we have no doubt that the proper use of the mouse NRASQ61K melanoma mouse model (cell lines and GDI) will allow the scientific community to better evaluate melanoma progression and efficiently test novel therapies.
Acknowledgements
This work was supported by the Ligue Contre le Cancer, Fondation ARC, Institut Carnot, INCa, and ITMO Cancer and is under the program «Investissements d’Avenir» launched by the French Government and implemented by ANR Labex CelTisPhyBio (ANR-11-LABX-0038 and ANR-10-IDEX-0001-02 PSL). JR is supported by a fellowship from MENRT. Work in the Aplin lab was supported by grants from Department of Defense (W81XWH-18-1-0224) and the Dr. Miriam and Sheldon G. Adelson Medical Research Foundation. The RPPA studies were performed at the Functional Proteomics Core Facility at The University of Texas MD Anderson Cancer Center, which is supported by a NCI Cancer Center Support Grant (CA16672).
We thank the members of the laboratory “Normal and Pathological Development of Melanocytes”. We also thank the staff in charge of the animal facilities of the Institut Curie, especially Pauline Dubreuil.
A.E. Aplin reports receiving a commercial research grant from Pfizer Inc. (2013-2017) and has ownership interest in patent number 9880150. The authors declare that they have no conflict of interest.
Figure legends
Figure 1. General morphology of the melanocyte and melanoma cell lines
Phase contrast images of melanocyte and melanoma cell lines. a. Melan-a cells, b. 9v cells,
c. R90 cells, d. R91a cells, e. 1007 melanoma cells, f. 1014 melanoma cells. Scale bar =
50µm.
Figure 2. Growth-dependence of the melanocyte and melanoma cell lines on TPA in
vitro
a-e. In vitro growth curves of the various cell lines over three days in the presence (red) or
absence (black) of 200 nM TPA. a, 9v cells; b, R90 cells; c, R91a cells; d, 1007 cells; e, 1014 cells. Results are expressed as the ratio of the number of cells at each timepoint over the number of cells plated at the beginning of the experiment (time 0) and represent the average ± SD of three to five independent experiments.
f. Doubling time (in hours) of each cell population during exponential growth in the presence
(red) or absence (black) of 200 nM TPA. Each bar represents the mean +/- SD of at least three independent measurements.
Figure 3. Growth of the 1007- and 1014-melanoma cell lines in vivo
Established 1014 (a) and 1007 (b) melanoma cells were injected subcutaneously in the flanks of female and male C57BL/6 mice (105 cells per side) and allowed to form tumors. Tumor size was measured by caliper and calculated as (length x width x height)/2. Each curve represents the growth of a tumor in a specific mouse.
c. Established 1014 melanoma cells were injected subcutaneously in the flanks of Swiss
nude female mice (8.105 cells per side) and allowed to form tumors. Tumor size was measured by caliper and calculated as (length x width x height)/2. Each curve represents the growth of a tumor in a specific mouse.
d. Established 1014 melanoma cells were injected in the tail vein of female C57BL/6 or
Swiss nude mice (5.105 cells per mouse) and allowed to form metastases. Results represent the number of mice bearing lung, ovary, liver, and/or brain metastases per mouse injected.
Figure 4. Analysis of signaling pathways by western blotting
a. Cells were grown in the presence or absence of 200 nM TPA and lysed 48 h after seeding.
Total cell extracts were subjected to western-blot analysis using the mentioned antibodies. Actin was used as a loading control.
b. 1007 and 1014 cells (200,000) were transfected with non-targeting or NRAS-targeting
siRNAs and grown in TPA-free media for 48 h. Lysates were collected and analyzed by western blotting.
1007 (c) and 1014 (d) cells (200,000) were transfected with nontargeting (siCtl) or NRAS-targeting siRNAs and grown in TPA-free media for 144 h. A non-transfected control was also included. Growth was monitored using the IncuCyte® system (n = 4; error bars indicate the standard error; * P < 0.05, ** P < 0.01; P values were determined by comparing the area under the curve)
e. Reverse-phase protein array (RPPA) analysis of the indicated cell lines transfected with
non-targeting or NRAS-targeting siRNAs and grown in TPA-free media for 48 h. Expression levels are presented as the NormLog2 median-centered z-score.
Figure 5. The MEK inhibitor binimetinib inhibits the growth of the 1014 melanoma cell line in vitro.
a. Western blot analysis of 1014 cells exposed to binimetinib at the indicated concentrations
for 1 h before lysis, using the antibodies mentioned at the right of the panel.
b, c. Growth curves of 1014 melanoma cells cultivated in the absence (b) or presence (c) of
200 nM TPA, with or without the MEK inhibitor binimetinib at the indicated concentrations. The inhibitor was added 24 h after plating. Results are expressed as the ratio of the number of cells for each timepoint over the number of cells plated at the beginning of the experiment (time 0).
d. Clonogenic growth of 1014 cells in the presence or absence of the MEK inhibitor
binimetinib. Cells were seeded at cloning density (500 cells per six-well dish) at day 0. Binimetinib was added 24 h after plating, at the indicated concentrations, in complete medium and the medium left either for 14 days or 1 h and then replaced by complete medium. Crystal violet-stained colonies were counted on images. Representative images of the colonies of three experiments are shown. Results are expressed as the relative amount compared to the vehicle control-treated samples and represent the average ± SD of three independent experiments.
Figure 6. The AKT inhibitor MK-2206 2HCl inhibits the growth of the 1014 melanoma cell line in vitro.
a. Western blot analysis of 1014 cells exposed to MK-2206 2HCl at the indicated
concentrations for 1 h before lysis, using the antibodies mentioned at the right of the panel.
b, c. Growth curves of 1014 melanoma cells cultivated in the absence (b) or presence (c) of
200 nM TPA, with or without the AKT inhibitor MK-2206 2HCl at the indicated concentrations. The inhibitor was added 24 h after plating. Results are expressed as the ratio of the number
of cells at each timepoint over the number of cells plated at the beginning of the experiment (time 0).
d. Clonogenic growth of 1014 cells in the presence or absence of the AKT inhibitor MK-2206
2HCl. Cells were seeded at cloning density (500 cells per six-well dish) at day 0. MK-2206 2HCl was added 24 h after plating, at the indicated concentrations in complete medium, and the medium left either for 14 days or 1 h and replaced by complete medium. Crystal violet-stained colonies were counted on images. Representative images of the colonies of three experiments are shown. Results are expressed as the relative amount compared to the vehicle control-treated samples and represent the average ± SD of three independent experiments.
Figure 7. In vivo tumor growth in the presence of MEK and/or AKT inhibitors
a. Growth curves of 1014 melanoma cells cultivated with the AKT inhibitor MK-2206 2HCl,
MEK inhibitor binimetinib, or both at the indicated concentrations or no inhibitor. Inhibitors were added 24 h after plating. Results are expressed as the ratio of the number of cells at each time-point over the number of cells plated at the beginning of the experiment (time 0). These experiments were performed in the absence of TPA.
b. Established 1014 melanoma cells were injected subcutaneously in the flanks of female
C57BL/6 mice (105 cells per side). At day 21, the mice were assigned to four treatment groups (12 mice per group): vehicle only (mock), binimetinib only, MK-2206 2HCl only, and binimetinib and MK-2206 2HCl. Mice were treated by oral gavage for 21 consecutive days with binimetinib at 10 mg/kg per day and/or MK-2206 2HCl at 15 mg/kg per day. Tumor size was measured by caliper every two to three days and calculated as (length x width x height)/2. Arrows indicate the beginning and end of treatment. Results are expressed as mean tumor volumes +/- SEM for each treatment group. Growth curves for each individual tumor are shown in Figure S6.
Figure 8. Establishment of the mouse NRAS melanoma model and functional tests a. Mouse melanocyte (Mc) and melanoma (Ma) cell lines were established in culture from P1
newborn transgenic (tg) pups and primary melanomas, respectively. Mouse melanocyte and melanoma cell lines were subcutaneously injected into C57BL/6 mice to evaluate their ability to grow in vivo. Melanoma tumors were frozen in liquid nitrogen (LN2) in the presence of fetal calf serum/DMSO (90/10, v/v) prior to thawing, washing, and implantation in C57BL/6 mice to generate genetically derived isografts (GDIs). One hundred thousand established 1007 and 1014 melanoma cells were injected subcutaneously in the flanks of C57BL/6 mice to generate tumors in approximately one month.
b. Tg animals, Mc, Ma, and GDIs can be subjected to physical, chemical, and biological
References
Ackermann, J., Frutschi, M., Kaloulis, K., Mckee, T., Trumpp, A., and Beermann, F. (2005). Metastasizing melanoma formation caused by expression of activated N-RasQ61K on an INK4a-deficient background. Cancer Res 65, 4005-11.
Aktary, Z., Mcmahon, M., and Larue, L. (2018). Animal Models of Melanoma. In Melanoma. Fisher, D. E. & Bastian, B. C., eds.: Springer Science+Business Media LLC 2018), pp.
Algazi, A. P., Esteve-Puig, R., Nosrati, A., Hinds, B., Hobbs-Muthukumar, A., Nandoskar, P., Ortiz-Urda, S., Chapman, P. B., and Daud, A. (2018). Dual MEK/AKT inhibition with trametinib and GSK2141795 does not yield clinical benefit in metastatic NRAS-mutant and wild-type melanoma. Pigment cell & melanoma research 31, 110-114. Bald, T., Quast, T., Landsberg, J., Rogava, M., Glodde, N., Lopez-Ramos, D., Kohlmeyer, J.,
Riesenberg, S., Van Den Boorn-Konijnenberg, D., Homig-Holzel, C., et al. (2014). Ultraviolet-radiation-induced inflammation promotes angiotropism and metastasis in melanoma. Nature 507, 109-13.
Bennett, D. C., Cooper, P. J., Dexter, T. J., Devlin, L. M., Heasman, J., and Nester, B. (1989). Cloned mouse melanocyte lines carrying the germline mutations albino and brown: complementation in culture. Development 105, 379-85.
Bennett, D. C., Cooper, P. J., and Hart, I. R. (1987). A line of non-tumorigenic mouse melanocytes, syngeneic with the B16 melanoma and requiring a tumour promoter for growth. International journal of cancer 39, 414-8.
Bray, F., Ferlay, J., Soerjomataram, I., Siegel, R. L., Torre, L. A., and Jemal, A. (2018). Global cancer statistics 2018: GLOBOCAN estimates of incidence and mortality worldwide for 36 cancers in 185 countries. CA Cancer J Clin 68, 394-424.
Cancer Genome Atlas Network. Electronic Address, I. M. O., and Cancer Genome Atlas, N. (2015). Genomic Classification of Cutaneous Melanoma. Cell 161, 1681-96.
Carvalho, B. S., and Irizarry, R. A. (2010). A framework for oligonucleotide microarray preprocessing. Bioinformatics 26, 2363-7.
Cloudman, A. M. (1941). The effect of an extra-chromosomal influence upon transplanted spontaneous tumors in mice. Science 93, 380-1.
Delmas, V., Beermann, F., Martinozzi, S., Carreira, S., Ackermann, J., Kumasaka, M., Denat, L., Goodall, J., Luciani, F., Viros, A., et al. (2007). Beta-catenin induces immortalization of melanocytes by suppressing p16INK4a expression and cooperates with N-Ras in melanoma development. Genes & Development 21, 2923-35.
Denning, M. F. (2012). Specifying protein kinase C functions in melanoma. Pigment cell & melanoma research 25, 466-76.
Gallagher, S. J., Luciani, F., Berlin, I., Rambow, F., Gros, G., Champeval, D., Delmas, V., and Larue, L. (2011). General strategy to analyse melanoma in mice. Pigment cell & melanoma research 24, 987-8.
Goodall, J., Carreira, S., Denat, L., Kobi, D., Davidson, I., Nuciforo, P., Sturm, R. A., Larue, L., and Goding, C. R. (2008). Brn-2 represses microphthalmia-associated transcription factor expression and marks a distinct subpopulation of microphthalmia-associated transcription factor-negative melanoma cells. Cancer Res 68, 7788-94. Grille, S. J., Bellacosa, A., Upson, J., Klein-Szanto, A. J., Van Roy, F., Lee-Kwon, W.,
Donowitz, M., Tsichlis, P. N., and Larue, L. (2003). The protein kinase Akt induces epithelial mesenchymal transition and promotes enhanced motility and invasiveness of squamous cell carcinoma lines. Cancer Res 63, 2172-8.
Harding, H. E., and Passey, R. D. (1930). A transplantable Melanoma of the Mouse. The Journal of Pathology and Bacteriology 33, 417-27.
Hoek, K. S., and Goding, C. R. (2010). Cancer stem cells versus phenotype-switching in melanoma. Pigment cell & melanoma research 23, 746-59.
Jéhannin-Ligier, K., Dantony, E., Bossard, N., Molinié, F., Defossez, G., Daubisse-Marliac, L., Delafosse, P., Remontet, L., and Uhry, Z. (2017). Projection de l’incidence et de la mortalité par cancer en France métropolitaine en 2017. (Santé Publique France / Institut national du cancer).
Jenkins, M. H., Steinberg, S. M., Alexander, M. P., Fisher, J. L., Ernstoff, M. S., Turk, M. J., Mullins, D. W., and Brinckerhoff, C. E. (2014). Multiple murine BRaf(V600E) melanoma cell lines with sensitivity to PLX4032. Pigment cell & melanoma research 27, 495-501.
Kassambara, A., and Mundt, F. (2017). factoextra: Extract and Visualize the Results of Multivariate Data Analyses. R package version 1.0.5.
Kolde, R. (2018). pheatmap: Pretty Heatmaps. R package version 1.0.12.
Larue, L., and Beermann, F. (2007). Cutaneous melanoma in genetically modified animals Pigment Cell Res 20, 485-497.
Larue, L., and Mintz, B. (1990). Pigmented cell lines of mouse albino melanocytes containing a tyrosinase cDNA with an inducible promoter. Somat Cell Mol Genet 16, 361-8. Lawrence, M. S., Stojanov, P., Polak, P., Kryukov, G. V., Cibulskis, K., Sivachenko, A.,
Carter, S. L., Stewart, C., Mermel, C. H., Roberts, S. A., et al. (2013). Mutational heterogeneity in cancer and the search for new cancer-associated genes. Nature 499, 214-218.
Le, S., Josse, J., and Husson, F. (2008). FactoMineR: An R Package for Multivariate Analysis. Journal of Statistical Software 25, 1-18.
Longvert, C., Gros, G., Beermann, F., Marais, R., Delmas, V., and Larue, L. (2011). [Murine cutaneous melanoma models. Importance of the genetic background]. Annales de pathologie 31, S70-3.
Meeth, K., Wang, J. X., Micevic, G., Damsky, W., and Bosenberg, M. W. (2016). The YUMM lines: a series of congenic mouse melanoma cell lines with defined genetic alterations. Pigment cell & melanoma research 29, 590-7.
Najem, A., Krayem, M., Perdrix, A., Kerger, J., Awada, A., Journe, F., and Ghanem, G. (2017). New Drug Combination Strategies in Melanoma: Current Status and Future Directions. Anticancer Res 37, 5941-5953.
Pla, P., Solov'eva, O., Moore, R., Alberti, C., Kunisada, T., and Larue, L. (2004). Dct::lacZ ES cells: a novel cellular model to study melanocyte determination and differentiation. Pigment Cell Res 17, 142-9.
Rambow, F., Job, B., Petit, V., Gesbert, F., Delmas, V., Seberg, H., Meurice, G., Van Otterloo, E., Dessen, P., Robert, C., et al. (2015). New Functional Signatures for Understanding Melanoma Biology from Tumor Cell Lineage-Specific Analysis. Cell Rep 13, 840-53.
Ritchie, M. E., Phipson, B., Wu, D., Hu, Y., Law, C. W., Shi, W., and Smyth, G. K. (2015). limma powers differential expression analyses for RNA-sequencing and microarray studies. Nucleic Acids Res 43, e47.
Szalay, J., Bruno, P., Bhati, R., Adjodha, J., Schueler, D., Summerville, V., and Vazeos, R. (2001). Associations of PKC isoforms with the cytoskeleton of B16F10 melanoma cells. J Histochem Cytochem 49, 49-66.
Talloen, W., and Verbeke, T. (2018). a4Preproc: Automated Affymetrix Array Analysis Preprocessing Package. R package version 1.30.0.
Tibes, R., Qiu, Y., Lu, Y., Hennessy, B., Andreeff, M., Mills, G. B., and Kornblau, S. M. (2006). Reverse phase protein array: validation of a novel proteomic technology and utility for analysis of primary leukemia specimens and hematopoietic stem cells. Mol Cancer Ther 5, 2512-21.
Trevillyan, J. M., Kulkarni, R. K., and Byus, C. V. (1984). Tumor-promoting phorbol esters stimulate the phosphorylation of ribosomal protein S6 in quiescent Reuber H35 hepatoma cells. J Biol Chem 259, 897-902.
Wickham, H. (2016). ggplot2: Elegant Graphics for Data Analysis, (Springer-Verlag New York).
Yin, C., Zhu, B., Zhang, T., Liu, T., Chen, S., Liu, Y., Li, X., Miao, X., Li, S., Mi, X., et al. (2019). Pharmacological Targeting of STK19 Inhibits Oncogenic NRAS-Driven Melanomagenesis. Cell 176, 1113-1127 e16.
Yu, G., Wang, L. G., Han, Y., and He, Q. Y. (2012). clusterProfiler: an R package for comparing biological themes among gene clusters. OMICS 16, 284-7.
Table 1. Characteristics of C57BL/6 cell lines of the melanocyte lineage
Name of the cell line Abbreviation Genotype Gender Reference
McWT1 [9v] 9v WT male (Delmas et al., 2007)
McWT2 [14d] 14d WT female (Delmas et al., 2007)
McNRAS1 [90] R90 Tyr::NRASQ61K/° male this article McNRAS2 [91A] R91a Tyr::NRASQ61K/° male this article MaNRAS1 [1007] 1007 Tyr::NRASQ61K/° male this article MaNRAS2 [1014] 1014 Tyr::NRASQ61K/° female this article
Melan-a Melan-a WT female (Bennett et al., 1987)
50 μm
Figure 1
Petit et al
a
b
c
d
0
20
40
60
1
2
3
3
0
2
4
6
0
2
4
6
0
1
2
3
0
2
4
6
0
0
0
1
2
2
4
6
0
2
4
6
doubling time (hours)
cell number (ru)
cell number (ru)
days
days
1
2
3
9v9v
R90
1007
1014
R91a
R91a 1014 1007 1007 R90 10140
1
2
3
0
days
days
days
a
b
c
f
e
d
Figure 2
Petit et al
+TPA -TPAdays
days
10 in C57BL/6 mice
8 * 10 in nude mice
Figure 3
Petit et al.
1014
1014
a
b
c
tumor volume (mm )
3tumor volume (mm )
3 20 25 30 35 40 45 50 55 20 25 30 35 40 45 50 55 0 1000 2000 3000 0 1000 2000 30005
5
d
Swiss
nude
C57BL/6
4/5
0/5
0/5
0/5
7/8
ovary
6/8
lung
5/8
liver
brain
2/8
days
tumor volume (mm )
3 20 30 40 50 60 70 0 1000 2000 300010 in C57BL/6 mice
1007
5
1014
melan-a R90 1007 9v R91A 1014 TPA - + - + - + - + - + - +
Figure 4
Petit et al
55 35 55 35 70 55 70 55 35 55 40 40 48h siCtl siNRAS #1 #2 siCtl 1007 siNRAS 1014 #1 #2 NRAS actin 100 80 60 40 20 0 20 40 60 80 100 120 140 1007* *
% confluence time elapsed/h 100 80 60 40 20 0 20 40 60 80 100 120 140 1014**
*
% confluence time elapsed/h 1007siCtl siNRAS#1 1007 siNRAS#2 1007 1014 siCtl siNRAS#1 1014 siNRAS#2 1014
S6_pS240_S244 S6_pS235_S236 p90RSK_pT573 Akt_pT308 Akt_pS473 IR-b Cdc2_pY15 Cyclin-E1 LRP6_pS1490 median-centered log2 z-score 0 0 0.0 -0.5 +0.5
a
b
c
d
e
no siRNA si Ctl siNRAS #1 siNRAS #2 p-ERK ERK p-AKT p-S6 AKT actin S60
Binimetinib (μM)
P-AKT
ERK
P-ERK
a
b
c
d
1 hr treatment 15 days treatment -1 -210
-310 10
10
010
1colony number (ru)
colony number (ru)
cell number (ru)
cell number (ru)
0
1
2
3
0
2
4
6
days
0
1
days
2
3
0
2
4
6
70
40
40
+TPA
-TPA
10-3 0 10-2 10-1 100 101 10-3 0 10-2 10-1 100 10155
70
40
AKT
actin
Binimetinib (μM)
Binimetinib (μM)
10-3 0 10-2 10-1 100 101 10-3 0 10-2 10-1 100 101 0 10-3 10-2 100 10-1 101 100 10-1 10-2 10-3 0 101 100 10-1 10-2 10-3 0 101 1.0 0.5 0.0 1.0 0.5 0.0 0 10-3 10-2 100 10-1 1010
1
2
3
0
2
4
6
0
1
2
3
0
2
4
6
10-3 0 10-2 10-1 100 101 10-3 0 10-2 10-1 100 101 15 days treatment 1 hr treatment MK-2206 (μM) 100 10-1 10-2 10-3 0 101 100 10-1 10-2 10-3 0 101colony number (ru)
MK-2206 (μM)
d
b
c
0 10-3 10-2 100 10-1 101 0 10-3 10-2 100 10-1 101-TPA
+TPA
10-3 0 10-2 10-1 10 0 10 1 10-3 0 10-2 10-1 10 0 10 1 MK-2206 (μM) MK-2206 (μM)cell number (ru)
cell number (ru)
days
days
MK-2206 (
μM)
0
P-AKT
P-ERK
a
-1 -210 10 10
-310 10
0 170
40
70
AKT
colony number (ru)
1.0 0.5 0.0 1.0 0.5 0.0
20
25
30
35
40
0
500
1000
1500
Bini (10mg/kg)
Bini + MK2206
MK-2206 (15mg/kg)
mock
tumor volume (mm )
3
days
0
1
2
3
days
b
a
in vitro
in vivo
2
4
6
cell number (ru)
Bini (10 μM)
Bini + MK2206
MK-2206 (10 μM)
mock
-2 -2Figure 8
Petit et ala
b
Physical (UV, Gamma Ray, ...)Chemical (chimiotherapy, targeted therapy, heavy metals, ...) Biological (DNA, RNA, Protein (ligand, antibody), metabolites, bacteria...)
Treatment
Tg mouse melanoma Mc cell lines Ma cell lines GDI
Read out Physiopathological level
Histological level
Cell level (proliferation, death, migration, invasion...)
Molecule level (DNA modifications, RNA/protein level/activity, metabolites...)
No Tumor Follow up 5 months with 4X10⁶ cells GDI natural evolution 1 year LN2/DMSO Mc Ma
Tyr::NRASQ61K(C57BL/6J) R90 and R91A
1007 and 1014
Tumor
1007 & 1014 : 25 days
1014 : 20 days with 105 cells 1007 : 35 days with 105 cells
Melan-a 9v R90 R91a 1007 1014 Melan-c 0 10 20 30 40
a
b
c
melanin (
μg) / 10 cells
6 14d M 9v R90 R91a 1007 1014 14d - + - + - + - + - + - + M 9v R90 R91a 1007 1014399 bp
399 bp
*
*
DNA
RNA
14d 9v 1007 1014 14d 9v R91a R90 1007 1014 14d 9v 1007 1014 14d 9v 1007 1014 14d 9v 1007 1014 0 5000 10000 15000 Mitf 0 2000 4000 6000 8000 10000 Sox10 0 1000 2000 3000 4000 Pax3 0 500 1000 1500 2000 Tfap2a 0 100 200 300 400 500 Gas7 mRNA (r .u.) 14d 9v 1007 1014 0 50 100 150 200 250 Lef1 mRNA (r .u.) 14d 9v 1007 1014 0 50 100 150 200 Dlx2 mRNA (r .u.) mRNA (r .u.) mRNA (r .u.) mRNA (r .u.) mRNA (r .u.)
Figure S2
Petit et al
a
b
c
d
e
f
g
h
*R91a R90 R91a R90 R91a R90
R91a R90 R91a R90 R91a R90 14d 9v R91a R90 1007 1014
mRNA (r .u.) Gas7 0.00 0.01 0.02 0.03 q-RT-PCR **
90 91A 1007 1014 6230424C14Rik Mecom Top2b Zfp820 Atrx Nudt21 Tmem33 Tmem204 Nrcam Nfix Gabrb3 Tmem98 Zfhx3 Fscn1 Msi1 Coro2b Tubb5 Pkp2 Dlc1 Gem Lrmda Gas7 Kcnn4 Igfbp4 Maff Nrn1 Chd4 Dmrta1 Dennd2a Hnrnpl Cpq Crip1 Dab2ip Golt1b Nol4l Pik3cd −1 −0.5 0 0.5 1
Enriched in NRAS Melanocytes Enriched in NRAS Melanoma
Log10 (Adjusted p value)
Log2 (Fold Change)
FC = -1
FC = +1
p = 0.05
Dim 1 (38.5%)
Dim 2 (24%)
NRAS melanocytes NRAS melanoma WT melanocytesa
b
c
0 +5 -5 0 1 2 3**
Figure S4
Petit et al
c
b
a
GO analysis
KEGG analysis
MSigDB
nb of genes nb of genes nb of genes BILD_CTNNB1_ONCOGENIC_SIGNATURE RUTELLA_RESPONSE_TO_HGF_VS_CSF2RB_AND_IL4_DN STEARMAN_LUNG_CANCER_EARLY_VS_LATE_UP UDAYAKUMAR_MED1_TARGETS_UP BERENJENO_ROCK_SIGNALING_NOT_VIA_RHOA_DN YAGI_AML_WITH_11Q23_REARRANGED GOTZMANN_EPITHELIAL_TO_MESENCHYMAL_TRANSITION_DN GABRIELY_MIR21_TARGETS BURTON_ADIPOGENESIS_11 KIM_WT1_TARGETS_8HR_UP MILI_PSEUDOPODIA_CHEMOTAXIS_UP MILI_PSEUDOPODIA_CHEMOTAXIS_DN MITSIADES_RESPONSE_TO_APLIDIN_DN DURCHDEWALD_SKIN_CARCINOGENESIS_DN MONNIER_POSTRADIATION_TUMOR_ESCAPE_UP BLALOCK_ALZHEIMERS_DISEASE_INCIPIENT_UP IKEDA_MIR30_TARGETS_UP SENGUPTA_NASOPHARYNGEAL_CARCINOMA_WITH_LMP1_UP CREIGHTON_ENDOCRINE_THERAPY_RESISTANCE_5 JOHNSTONE_PARVB_TARGETS_2_DN MCBRYAN_PUBERTAL_BREAST_5_6WK_DN FULCHER_INFLAMMATORY_RESPONSE_LECTIN_VS_LPS_DN BAELDE_DIABETIC_NEPHROPATHY_DN OSMAN_BLADDER_CANCER_UP MCBRYAN_PUBERTAL_BREAST_6_7WK_UP ZHANG_TLX_TARGETS_36HR_DN STARK_PREFRONTAL_CORTEX_22Q11_DELETION_UP ENK_UV_RESPONSE_KERATINOCYTE_DN SHEN_SMARCA2_TARGETS_UP DACOSTA_UV_RESPONSE_VIA_ERCC3_COMMON_DN 0 20 40 60 6e−05 4e−05 2e−05 p.adjust
Thyroid hormone signaling pathway Fc gamma R−mediated phagocytosis Adherens junction Renal cell carcinoma Hepatitis B Regulation of actin cytoskeleton Hippo signaling pathway RNA transport Hippo signaling pathway − multiple species mRNA surveillance pathway
0 5 10 15 20 0.005 0.004 0.003 0.002 0.001 p.adjust
nucleobase−containing compound transport establishment of RNA localization regulation of mRNA splicing, via spliceosome covalent chromatin modification RNA transport nucleic acid transport regulation of mRNA processing regulation of mRNA metabolic process RNA splicing mRNA processing 0 10 20 30 40 50 0.0020 0.0015 0.0010 0.0005 p.adjust
siCtrl siNRAS1 siNRAS2
0.0 0.5 1.0 1.5
siCtrl siNRAS1 siNRAS2
0.0 0.5 1.0 1.5
siCtrl siNRAS1 siNRAS2
0.0 0.5 1.0 1.5
*** ****
siCtrl siNRAS1 siNRAS2
0.0 0.5 1.0 1.5
siCtrl siNRAS1 siNRAS2
0.0 0.5 1.0 1.5
siCtrl siNRAS1 siNRAS2
0.0 0.5 1.0 1.5
siCtrl siNRAS1 siNRAS2
0.0 0.5 1.0 1.5
siCtrl siNRAS1 siNRAS2
0.0 0.5 1.0 1.5
siCtrl siNRAS1 siNRAS2
0.0 0.5 1.0 1.5 2.0
siCtrl siNRAS1 siNRAS2
0.0 0.5 1.0 1.5
siCtrl siNRAS1 siNRAS2
0.0 0.5 1.0 1.5
siCtrl siNRAS1 siNRAS2
0.0 0.5 1.0 1.5 2.0
siCtrl siNRAS1 siNRAS2
0.0 0.5 1.0 1.5 2.0 2.5
siCtrl siNRAS1 siNRAS2
0.0 1.0 2.0 3.0 4.0
siCtrl siNRAS1 siNRAS2
0.0 1.0 2.0
siCtrl siNRAS1 siNRAS2
0.0 0.5 1.0 1.5
siCtrl siNRAS1 siNRAS2
0.0 0.5 1.0 1.5
siCtrl siNRAS1 siNRAS2
0.0 0.5 1.0 1.5 2.0
1014
1007
1014
1007
1014
1007
level (r
.u.)
level (r
.u.)
level (r
.u.)
S6-pS235/S236 AKT-pT308 AKT-pS473 LRP6-pS1490 CDC2-pY15 CYCLIN E1 S6-pS240/S244 p90 RSK-pT573 IR ******** ******* * **** ******** ******* * **** ******** * **** ******** **** ******** ** **** ** ********0
PD-0325901 (
μM)
P-AKT
ERK
P-ERK
a
b
c
d
10-1 10-2 10-3 10-4 0 100 1 hr treatment 15 days treatment 0 10-4 10-3 10-1 10-2 100 0 10-4 10-3 10-1 10-2 100 -2 -310
-410
10
10
-110
0 PD-0325901 (μM) PD-0325901 (μM) 10-4 0 10-3 10-2 10-1 100 10-4 0 10-3 10-2 10-1 100colony number (ru)
cell number (ru)
cell number (ru)
0
1
2
3
0
2
4
6
days
days
-TPA
PD-0325901 (μM)0
1
2
3
0
2
4
6
+TPA
PD-0325901 (μM)70
40
40
10-4 0 10-3 10-2 10-1 100 10-4 0 10-3 10-2 10-1 10 0 10-1 10-2 10-3 10-4 0 100colony number (ru)
1.0 0.5 0.0 1.0 0.5 0.0