HAL Id: hal-00697622
https://hal.archives-ouvertes.fr/hal-00697622
Submitted on 3 Nov 2015
HAL is a multi-disciplinary open access
archive for the deposit and dissemination of
sci-entific research documents, whether they are
pub-lished or not. The documents may come from
teaching and research institutions in France or
abroad, or from public or private research centers.
L’archive ouverte pluridisciplinaire HAL, est
destinée au dépôt et à la diffusion de documents
scientifiques de niveau recherche, publiés ou non,
émanant des établissements d’enseignement et de
recherche français ou étrangers, des laboratoires
publics ou privés.
Ecology of aerobic anoxygenic phototrophic bacteria
along an oligotrophic gradient in the Mediterranean Sea
D. Lamy, Christian Jeanthon, M. T. Cottrell, D. L. Kirchman, France van
Wambeke, J. Ras, Océane Dahan, Mireille Pujo-Pay, L. Oriol, L. Bariat, et al.
To cite this version:
D. Lamy, Christian Jeanthon, M. T. Cottrell, D. L. Kirchman, France van Wambeke, et al.. Ecology
of aerobic anoxygenic phototrophic bacteria along an oligotrophic gradient in the Mediterranean Sea.
Biogeosciences, European Geosciences Union, 2011, 8, pp.973-985. �10.5194/bg-8-973-2011�.
�hal-00697622�
www.biogeosciences.net/8/973/2011/ doi:10.5194/bg-8-973-2011
© Author(s) 2011. CC Attribution 3.0 License.
Biogeosciences
Ecology of aerobic anoxygenic phototrophic bacteria along an
oligotrophic gradient in the Mediterranean Sea
D. Lamy1,2,*, C. Jeanthon3,4, M. T. Cottrell5, D. L. Kirchman5, F. Van Wambeke6, J. Ras7, O. Dahan3,4, M. Pujo-Pay1,2, L. Oriol1,2, L. Bariat2,8, P. Catala1,2, V. Cornet-Barthaux9, and P. Lebaron1,2
1INSU-CNRS, UMR 7621, Laboratoire d’Oc´eanographie Microbienne, LOMIC, Observatoire Oc´eanologique de Banyuls,
66651 Banyuls-sur-mer, France
2UPMC Univ Paris 06, Observatoire Oc´eanologique de Banyuls, 66651 Banyuls-sur-mer, France
3UPMC Univ Paris 06, UMR 7144, Adaptation et Diversit´e en Milieu Marin, Station Biologique de Roscoff,
29680 Roscoff, France
4INSU-CNRS, Observatoire Oc´eanologique, UMR 7144, Groupe Plancton Oc´eanique, Station Biologique,
29680 Roscoff, France
5School of Marine Science and Policy, University of Delaware, Lewes, Delaware 19958, USA
6INSU-CNRS, Universit´e de la M´editerran´ee, UMR 6117, LMGEM, Laboratoire de Microbiologie, G´eochimie et Ecologie
Marines, Centre d’Oc´eanologie de Marseille, Campus de Luminy, Case 901, 13288 Marseille cedex 9, France
7Laboratoire d’Oc´eanographie de Villefranche-sur-mer, UMR 7093, CNRS, Universit´e Pierre et Marie Curie,
Villefranche-sur-mer Cedex, France
8CNRS, UMS 2348, Observatoire Oc´eanologique de Banyuls, 66651 Banyuls-sur-mer, France
9Laboratoire d’Oc´eanographie Physique et Biog´eochimique (LOPB), UMR 6535, CNRS-IRD-Universit´e de la M´editerran´ee,
Centre d’Oc´eanologie de Marseille, Campus de Luminy, Case 901, 13288 Cedex 09 Marseille, France
*present address: University of Vienna, Department of Marine Biology, Althanstrasse 14, 1090 Vienna, Austria
Received: 16 December 2010 – Published in Biogeosciences Discuss.: 12 January 2011 Revised: 12 April 2011 – Accepted: 13 April 2011 – Published: 20 April 2011
Abstract. Aerobic anoxygenic phototrophic (AAP) bacteria
are photoheterotrophic prokaryotes able to use both light and organic substrates for energy production. They are widely distributed in coastal and oceanic environments and may con-tribute significantly to the carbon cycle in the upper ocean. To better understand questions regarding links between the ecology of these photoheterotrophic bacteria and the trophic status of water masses, we examined their horizontal and ver-tical distribution and the effects of nutrient additions on their growth along an oligotrophic gradient in the Mediterranean Sea. Concentrations of bacteriochlorophyll-a (BChl-a) and AAP bacterial abundance decreased from the western to the eastern basin of the Mediterranean Sea and were linked with concentrations of chlorophyll-a, nutrient and dissolved or-ganic carbon. Inoror-ganic nutrient and glucose additions to surface seawater samples along the oligotrophic gradient re-vealed that AAP bacteria were nitrogen- and carbon-limited in the ultraoligotrophic eastern basin. The intensity of the
Correspondence to: D. Lamy (lamyd2@univie.ac.at)
AAP bacterial growth response generally differed from that of the total bacterial growth response. BChl-a quota of AAP bacterial communities was significantly higher in the eastern basin than in the western basin, suggesting that reliance on phototrophy varied along the oligotrophic gradient and that nutrient and/or carbon limitation favors BChl-a synthesis.
1 Introduction
Aerobic anoxygenic phototrophic (AAP) bacteria are pho-toheterotrophic prokaryotes able to combine light and dis-solved organic matter as energy sources (Beatty, 2002; Suzuki and B´ej`a, 2007; Yurkov and Beatty, 1998). Their primary light harvesting pigment is bacteriochlorophyll-a (BChl-a) (Kobl´ıˇzek et al., 2005; Kolber et al., 2001) and they depend on oxygen and organic carbon for energy. These bacteria are widely distributed in marine environments and their abundances vary greatly, accounting for up to 25% of the bacterial abundance (Cottrell and Kirchman, 2009; Lami et al., 2007; Salka et al., 2008; Schwalbach and Fuhrman,
974 D. Lamy et al.: Aerobic anoxygenic phototrophs in the Mediterranean Sea 2005). The metabolic flexibility, fast growth, high
abun-dance and widespread occurrence of these organisms in both marine and freshwater environments challenge our view of carbon and energy budgets (Eiler, 2006; Lamy et al., 2011; Maˇs´ın et al., 2008; Moran and Miller, 2007) and suggest that AAP bacteria play a significant role in aquatic food webs and biogeochemical cycles (Kobl´ıˇzek et al., 2007; Kolber et al., 2001).
An initial hypothesis regarding AAP bacteria distribution was that photoheterotrophy would be beneficial in nutrient-poor environments, such as oligotrophic zones (Karl, 2002; Kolber et al., 2000). In contrast, various reports showed that these organisms are abundant in eutrophic as well as in oligotrophic environments (Jiao et al., 2007; Kobl´ıˇzek et al., 2006; Yutin et al., 2007). Other authors suggested that nu-trient concentrations (Maˇs´ın et al., 2008), attachment to par-ticles (Cottrell et al., 2010; Waidner and Kirchman, 2007) or light intensity (Kobl´ıˇzek et al., 2003; Shiba, 1991) may influence AAP bacterial abundance.
Increasing attention has been paid to AAP bacteria in ma-rine environments exhibiting various trophic regimes. How-ever, oligotrophic waters, which represent 60% of the sur-face of the oceans, have not been extensively studied. The Mediterranean Sea has a wide range of oligotrophic condi-tions including extreme oligotrophy in summer when the wa-ter column is stratified (Berman et al., 1985). The Mediwa-ter- Mediter-ranean Sea is known to have low nutrient concentrations, es-pecially phosphate (Moutin and Raimbault, 2002), making it one of the largest nutrient-depleted areas in the world (Ig-natiades, 2005). Overall, the Mediterranean Sea could serve as a particularly relevant system to follow the spatial distri-bution of AAP bacteria and to examine the environmental factors that are hypothesized to influence their distribution. A few studies examined the large diversity of AAP bacte-ria in the Mediterranean Sea (Lehours et al., 2010; Oz et al., 2005; Yutin and B´ej`a, 2005; Yutin et al., 2008). How-ever, their quantitative variation with longitude and depth has never been explored in this area.
The objectives of this study were to determine the vertical and longitudinal distribution of AAP bacteria in the Mediter-ranean Sea and to identify the factors limiting their growth across a wide longitudinal gradient of oligotrophy. We ex-amined these variables along a 3000 km transect from the west to the east during the BOUM cruise carried out in June– July 2008. The abundance and distribution of AAP bacteria were monitored using infra-red (IR) kinetic fluorometry, high performance liquid chromatography (HPLC) and IR epiflu-orescence microscopy. The effects of inorganic nitrogen, phosphate and glucose additions on AAP and total bacterial growth were studied in surface seawater samples incubated under natural solar irradiance. In a companion paper, Jean-thon et al. (2011) reported the isolation of AAP bacteria and unveiled the diversity of the active AAP populations retrieved during the BOUM cruise. Our study showed that AAP bac-teria decreased in abundance from the oligotrophic western
Fig. 1
Fig. 1. Transect of the BOUM cruise (16 June–20 July 2008) superimposed on a SeaWiFS composite image of the sea surface chlorophyll-a concentrations (June 2008, courtesy to E. Bosc) and location of the 30 sampled stations. The bacteriochlorophyll-a (BChl-a) concentration was assessed at all the stations. The AAP bacterial abundance and the BChl-a fluorescence were measured on 8 stations (green dots, stations 27, 25, 21, 17, 13, 1, 5 and 9). The experiments conducted on the effect of nutrient amendments on AAP bacterial growth were done on 4 stations (yellow dots, sta-tions A, 17, 9 and C).
to the ultra-oligotrophic eastern basins of the Mediterranean Sea. The higher concentrations of BChl-a per-cell in the eastern part of the Mediterranean Sea suggest that photosyn-thetic pigment synthesis by AAP bacteria may be favored in nutrient-depleted conditions.
2 Material and methods 2.1 Study area and sampling
Sampling was carried out during the “Biogeochemistry from the Oligotrophic to the Ultra-oligotrophic Mediterranean Sea” (BOUM) cruise on the R/V L’Atalante during June– July 2008. The cruise was planned as a 3000 km transect of stations encompassing a large longitudinal gradient in the Mediterranean Sea (Fig. 1, see also Moutin et al., 2011). Hydrological, biological and chemical parameters were stud-ied at 27 short-term stations and three long-term stations de-signed by letters (A, B, and C), located at the centre of an-ticyclonic gyres, where lateral advection was expected to be minimum (Fig. 1). The east-to-west transect crossed the 3 main areas of the Mediterranean Sea, the western (stations 18 to 27), the Ionian (station 2 to 17) and the eastern or Lev-antine basins (stations 3 to C).
2.2 Environmental parameters
Profiles of temperature, salinity and photosynthetically ac-tive radiation (PAR) were measured with a SBE 911 PLUS Conductivity-Temperature-Depth (CTD) system. Nutrients concentrations were determined with a Skalar Autoanalyzer
(Skalar Analytical B. V., The Netherlands) according to Wood et al. (1967) and Bendschneider and Robinson (1952) for nitrate (NO3) and nitrite (NO2)concentrations and
ac-cording to Murphy and Riley (1962) for phosphate (PO4)
concentrations. Protocols were adapted to the Skalar Auto-analyser from Tr´eguer and Le Corre (1975). Soluble reac-tive phosphorus was also quantified (Rimmelin and Moutin, 2005) based on the MAGIC method (Karl and Tien, 1992). Ammonium (NH4)concentrations were determined onboard
by fluorometry according to Holmes et al. (1999) on a Jasco FP-2020 fluorometer.
Concentration of dissolved organic carbon (DOC) was measured on a model TOC-V analyzer (Shimadzu, Japan)
(Benner and Strom, 1993). Dissolved organic nitrogen
(DON) and phosphate (DOP) were analyzed by persulfate wet-oxidation according to Pujo-Pay et al. (1997). Partic-ulate organic carbon (POC) was quantified using a model CHN 2400 analyzer (Perkin Elmer 2400, Waltham, MA) fol-lowing Pregl (1937) and Sharp (1974). Particulate organic nitrogen (PON) and phosphate (POP) were analyzed simul-taneously on board according to the wet oxidation procedure of Pujo-Pay and Raimbault (1994). The methods conducted for the determination of the nutrients and dissolved and par-ticulate matter concentrations are described in Pujo-Pay et al. (2011).
2.3 AAP bacterial abundance
Water samples for the determination of AAP bacterial abun-dance were taken at 5–6 depths from 8 stations (27, 25, 21, 17, 13, 1, 5 and 9) equally distributed in the 3 differ-ent basins. Samples were preserved with 2% paraformalde-hyde for 1–4 h at 4◦C in the dark and filtered onto
0.2-µm-pore-size black polycarbonate filters. The filters were quickly frozen in liquid nitrogen and stored at −80◦C un-til processing. Samples were processed as described previ-ously (Cottrell et al., 2006). Briefly, each filter was stained with 40,6-diamidino-2-phenylindole (DAPI, 1 µg ml−1 final concentration) in 1× phosphate-buffered saline for 10 min. Stained samples were counted immediately. AAP cells were counted using an Olympus Provis AX 70 microscope and im-age analysis software (Imim-agePro Plus, Media Cybernetics) to identify cells having DAPI and IR fluorescence but not chlorophyll-a (Chl-a) or phycoerythrin (PE) fluorescence. Twenty images per sample were captured using a charge-coupled-device camera (Intensified Retiga Extended Blue; QImaging, Surrey, BC) with the following exposure times: DAPI, 160 ms; IR, 400 ms; Chl-a, 1500 ms; PE, 50 ms. The biovolumes of total bacteria and AAP bacteria were com-pared using cell sizes obtained by image analysis (Cottrell et al., 2006).
2.4 Fluorometry
BChl-a fluorescence was measured at the same stations and depths as those sampled for AAP bacterial abundance. BChl-a fluorescence was determined using an IR kinetic fluo-rometer using the method previously described (Kobl´ıˇzek et al., 2005). Briefly, the instrument consisted of a stan-dard PSI fluorometer control unit (FL200/PS, Photon Sys-tems Instruments, Brno, Czechia) and custom-made optics (Kobl´ıˇzek et al., 2005). The absolute detection limit was 0.2 ng BChl-a l−1 (Kobl´ıˇzek et al., 2007). To discriminate between the Chl-a and BChl-a contribution in the IR flu-orescence (>850 nm), phytoplankton fluflu-orescence was se-lectively inhibited by adding 10−5M (final concentration)
of 3-(3,4-dichlorophenyl)-1,1-dimethylurea (Diuron, PES-TANAL, Fluka), which specifically inhibits Photosystem II of oxygenic phototrophs but does not affect the reaction centers of AAP bacteria. The variable part of the kinetic IR signal originating from AAP bacterial reaction centers was then determined (Kobl´ıˇzek et al., 2005). This approach avoids potential interferences from other fluorescing com-pounds not exhibiting variable fluorescence or from electrical drifts within the detection system that occur on different time scales. Size fractionation (Lami et al., 2009), was conducted at the same stations and at the depths of maximum BChl-a fluorescence. Briefly, for each sample, <0.8 µm and <3 µm BChl-a fluorescence signals were recorded along with the original whole water sample and the percentage of BChl-a fluorescence in individual fractions was calculated. Gravity filtration was used to minimize potential particle dislodging by filtration (Waidner and Kirchman, 2007).
2.5 Bacterioplankton abundance and heterotrophic prokaryotic production
The abundances of total heterotrophic prokaryotes (including AAP bacteria) and autotrophic prokaryotes (Synechococcus and Prochlorococcus) were measured by flow cytometry us-ing a FACSCalibur flow cytometer (Becton Dickinson, San Jose, CA) according to Marie et al. (2002). The bacterial pro-duction was determined by [3H]-leucine incorporation apply-ing the centrifugation method (Smith and Azam, 1992) and is detailed in Van Wambeke et al. (2010). Production by Ar-chaea would be included in this measurement, but their abun-dance is low in Mediterranean surface waters (De Corte et al., 2009), particularly during the stratification period (Winter et al., 2009).
2.6 Pigment concentrations
Samples for the determination of the pigment concentra-tions were collected at the 30 staconcentra-tions at 7–12 depths. Sea-water sample (1 to 2.5 l) was filtered onto a stack of two GF/F Whatman filters which were frozen immediately in liquid nitrogen and then stored at −80◦C until analysis as
976 D. Lamy et al.: Aerobic anoxygenic phototrophs in the Mediterranean Sea previously described (Ras et al., 2008). Briefly, the
sam-ples were extracted in 3 ml of methanol for at least one hour and the clarified extracts were injected into a 1100 se-ries high-performance liquid chromatography system (Agi-lent Technologies) according to a modified version of the method described by Van Heukelem and Thomas (2001). Separation was achieved during a gradient elution between a tetrabutylammonium acetate-methanol mixture (30:70) and 100% methanol. Chl-a and divinyl-Chl-a (Div-Chl-a) were detected at 667 nm and BChl-a at 770 nm using a diode array detector. The detection limit was 0.1 ng l−1and the injection precision was 0.4%. The different pigments were identified both by their retention times and by absorption spectra.
2.7 Effects of nutrient and glucose amendments on bacterial production and growth of AAP and total prokaryotes
To identify the factors limiting heterotrophic bacterial pro-duction and cell growth of AAP bacteria and total prokary-otes, on board enrichments were conducted. Selected sur-face seawater samples (3–5 m depth) were collected and dis-pensed into acid-washed transparent polycarbonate flasks (250 ml, Nalgene). Nutrients were added to unfiltered sea-water samples in order to obtain a final concentration of 1 µM NH4Cl + 1 µM NaNO3(N), 0.25 µM Na2HPO4(P), and
10 µM C-glucose (C). For these experiments, a series of five flasks (control, +P, +N, +C, +NPC) were incubated for 48 h under simulated in situ conditions, in on-deck incubators with running surface seawater and neutral density screens to mimic in situ 55% light conditions. After incubation, sam-ples for determining the abundance and growth of AAP bac-teria and total prokaryotes and for measuring bacbac-terial pro-duction were processed as described above.
2.8 Statistical analyses
A redundancy analysis (RDA) was used to determine which environmental variables were the most significant to explain variation in the abundance of autotrophic (Synechococcus and Prochlorococcus), photoheterotrophic (AAP) and total prokaryotes. We assumed a linear response of cyanobac-teria, AAP bacteria and total prokaryotes to environmental variations since the gradient length, expressed as standard deviation units of species turnover (SD) along the first or-dination axis and determined through a detrended canonical correspondence analysis along the first ordination axis, was <1 SD. The gradient length is a measure of how unimodal or linear the species responses are along an ordination axis and a gradient length under 1 SD would indicate a clear linear response of the species along this gradient (Ramette, 2007; ter Braak and Smilauer, 2002). The null hypothesis that the cyanobacterial and bacterial abundances were independent of the environmental parameters was tested using constrained ordination with a Monte Carlo permutation test (499
permu-0 50 100 150 27 24 A 21 19 17 15 13 B 2 4 6 8 10 C 3.0 2.5 2.0 1.5 1.0 0.5 0.0 0 500 1000 1500 2000 2500 3000 Dept h ( m) BChl -a (ng l -1 ) Section distance (km) DCM Fig. 2
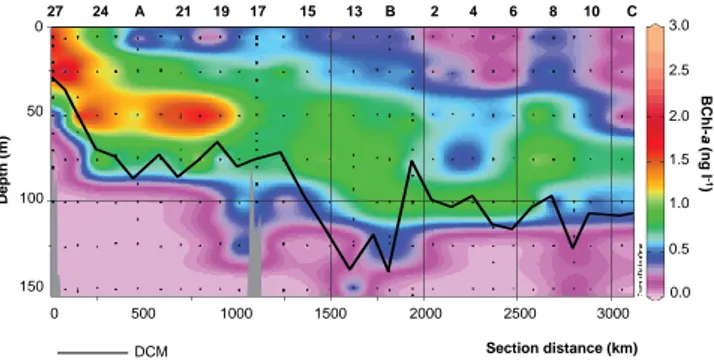
Fig. 2. Longitudinal cross section of BChl-a concentration along
the BOUM transect, from the most north-western station (left) to the most eastern station (right) and for the 0–150 m layer. Depth of the deep chlorophyll maximum (DCM) is also indicated (black line).
tations). Temperature, salinity, depth, concentrations of Chl-a, nutrients and organic matter concentrations (DOC, DOP, DON and POC) and PAR were used as explanatory variables. The RDA analysis was performed using the CANOCO ver-sion 4.5 software (ter Braak, 1989).
Spearman correlations were performed to identify the sig-nificant links within the BChl-a-related parameters. Multiple regression analysis was performed to determine which pro-portion of the variation in AAP bacterial abundance could be explained by the variation in environmental parameters, used as explanatory variables. A multiple stepwise regression with forward selection was performed to identify major environ-mental or extrinsic factors controlling the variation of AAP cell abundances. Since the variables were not normally dis-tributed (Shapiro-Wilk test, p > 0.05), dependent and inde-pendent variables were log-transformed to meet the assump-tion of normality. The explanatory variables were the same as those used in the RDA analysis. An ANOVA analysis fol-lowed by a LSD pairwise-comparison test was performed to compare BChl-a quotas along the transect. The correlation, regression and ANOVA analyses were performed using the XLSTAT 7.5.3 package.
3 Results
3.1 Environmental setting
The physical and hydrologic characteristics of the water masses in the Mediterranean Sea have been previously de-scribed and full details for the BOUM cruise can be found in Moutin et al. (2011). During the summer BOUM cruise, sur-face seawater temperatures ranged from 24◦C in the west-ern basin (station A) to 27.5◦C in the central-eastern part (station B). Depth distributions of Chl-a concentrations in-cluded a well defined deep chlorophyll maximum (DCM), more pronounced in the western basin, and deepening from west (∼40 to 80 m) to east (from 80 to >100 m) (Fig. 2; see
also Crombet et al., 2011). Surface Mediterranean waters were depleted in nutrients and the thickness of this depleted layer increased towards the east from about 10 m in the Gulf of Lion to more than 100 m in the Levantine basin (for details see Pujo-Pay et al., 2011).
3.2 Abundance and size fractionation of AAP bacteria along the BOUM transect
Concentrations of BChl-a ranged between undetectable lev-els and 3.1 ng l−1, averaging 0.4 ± 0.5 ng l−1between 0 and 150 m (Fig. 2). The concentrations decreased from west to east, with maximum values (from 1.1 to 3.1 ng l−1)measured in the Rhˆone River plume toward the western basin (until station 19) at depths comprised between 5 and 60 m. The maximum values of BChl-a concentrations deepened toward the east, following the deepening of the DCM. The BChl-a concentrations were low (<0.5 ng l−1)below the DCM. In the Ionian and eastern basins, highest BChl-a values (0.7– 1.0 ng l−1)occurred at depths between 25 and 100 m, and concentrations were low (<0.5 ng l−1)in subsurface waters.
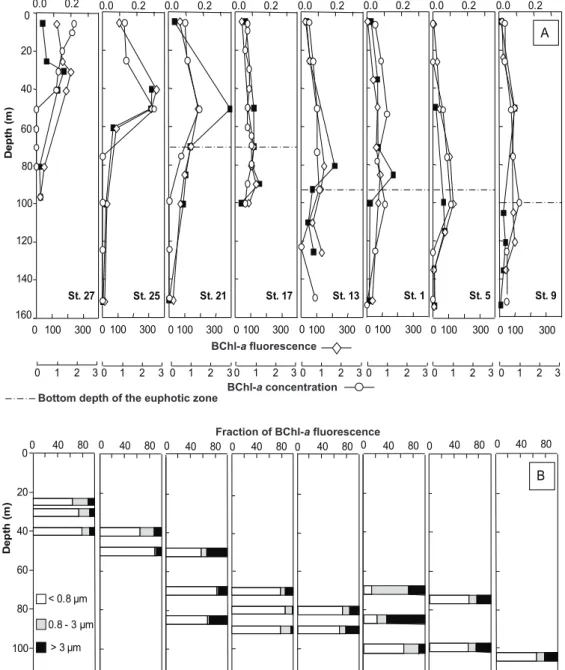
At eight stations equally distributed along the transect, AAP bacteria were investigated by measuring BChl-a con-centrations, BChl-a fluorescence and AAP bacterial abun-dance (Fig. 3a). The three AAP bacterial parameters clearly showed similar longitudinal and vertical patterns, demon-strating that AAP bacteria were mostly found in the euphotic zone along the whole transect. The BChl-a concentrations were significantly and positively correlated with the AAP bacterial abundance (Spearman correlation, r = 0.61, n = 60, p <0.001) and the BChl-a fluorescence (Spearman correla-tion, r = 0.73, n = 60, p < 0.0001). AAP bacterial abun-dance and BChl-a fluorescence were also positively corre-lated (Spearman correlation, r = 0.81, n = 46, p < 0.0001).
AAP bacterial abundance ranged from 3.0 × 10²to 3.5 × 10⁴cells ml−1, accounting for 0.1 to 4% of total prokary-otic abundance. Although AAP bacteria were present at all stations within the first 150 m depth, their abundance varied along the longitudinal transect and with depth (Fig. 3a). AAP bacteria reached up to 3.5 × 10⁴cells ml−1 in the western part (station 21 at 50 m depth) whereas they did not exceed 9.0 × 10²cells ml−1 in the eastern part (station 9 at 50 m). Abundances in the Ionian Basin (stations 1 and 13) were in-termediate up to 1.9 × 10⁴cells ml−1. Relative abundance of AAP bacteria in subsurface waters did not vary substantially along the longitudinal transect, ranging from 0.4 to 0.9% of total prokaryote abundance. The relative abundance maxima were at or just above the DCM at all the stations, reaching up to 4% in the western part (station 21 at 50 m) and less than 1% in the eastern part.
The depth of AAP bacterial abundance maxima deepened from west to east, as previously noticed for the maximum values of BChl-a concentrations and the DCM. At stations 27 and 25 in the western basin, the DCM corresponded to the depth of highest AAP bacterial abundance, reaching 1.6 and
2.8 × 10⁴AAP cells ml−1 at 30 m and 50 m depth,
respec-tively. At station 21, the highest numbers of AAP bacteria were found just above the DCM at 50 m, while at stations 13 and 9 AAP bacteria peaked at 60–70 m above the DCM (at 80 m and 50 m depth, respectively). The highest numbers of AAP bacteria were measured below the DCM at stations 1, 5 and 17 at 85 m, 110 m and 90 m, respectively.
BChl-a fluorescence in selected size fractions was exam-ined at the same eight stations (Fig. 3b). The contribution of each size fraction was measured only at depths with the highest BChl-a fluorescence. The <0.8 µm fraction contain-ing free-livcontain-ing AAP bacteria accounted for generally most (64 to 93%) of the total BChl-a fluorescence. The only ex-ception was station 1 where the particle-associated BChl-a fluorescence in the 0.8–3 µm and >3 µm fractions accounted for 87% and 77% of the total signal at 70 m and 85 m, re-spectively.
3.3 AAP bacteria, cyanobacteria and total prokaryotes
The abundance of AAP bacteria was compared to that of the two main genera of photoautotrophic bacteria, including the cyanobacteria Prochlorococcus and Synechococcus and of total prokaryotes, including AAP bacteria (Fig. 4a).
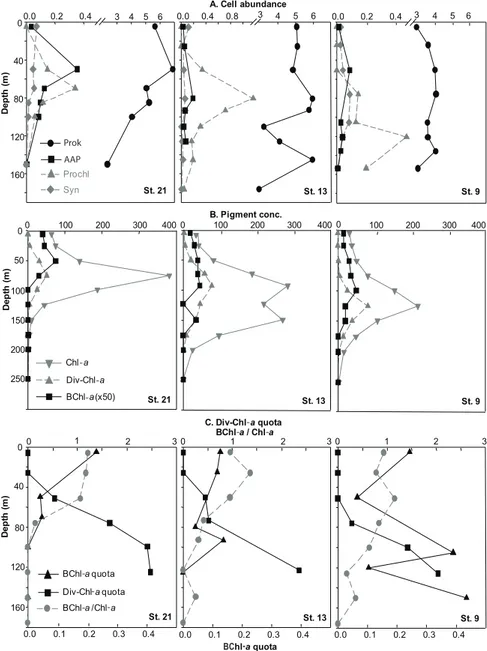
At the three stations selected in the western basin (station 21), the Ionian basin (station 13) and the Levantine basin (station 9), total prokaryotes outnumbered cyanobacteria and AAP bacteria, with abundances ranging between 2.3 and 6.90 × 10⁵cells ml−1 (Fig. 4a). They were more abundant in the western than in the eastern part of the Mediterranean Sea, and in the subsurface than in deep waters. AAP cells were about 1.2-fold larger on average (±0.6) and up to 4-fold larger than cells in the total prokaryotes community (data not shown).
In surface waters (5 m) Synechococcus outnumbered AAP bacteria by 2- to 4-fold. In contrast, from 25 to 150 m, AAP bacterial abundance was equal to or 9-fold higher than that of Synechococcus. Prochlorococcus cells were not detected by flow cytometry in surface waters at the three stations. How-ever, Prochlorococcus was 2- to 22-fold more abundant than AAP bacteria at deeper depths at stations 13 and 9. In con-trast, AAP bacteria abundances were in the same order of magnitude than that of Prochlorococcus at station 21, with values up to 4.0 × 10⁴cells ml−1.
3.4 Photosynthetic pigment concentrations and cell quotas
Photosynthetic pigments were compared at the same three stations (Fig. 4b). Total Chl-a and Div-Chl-a were up to 300-fold and 50-fold higher than BChl-a, respectively. Div-Chl-a peaked at the DCM (51 to 82 ng l−1), while BChl-a concentration was generally at its highest level just above the DCM and then decreased with depth. BChl-a/Chl-a ratio de-creased with depth, from 1 to 1.5% to undetectable values
978 D. Lamy et al.: Aerobic anoxygenic phototrophs in the Mediterranean Sea
BChl-a fluorescence
Bottom depth of the euphotic zone BChl-a concentration AAP bacterial abundance
Fraction of BChl-a fluorescence
Fig. 3. Vertical profiles at 8 stations along the BOUM transect of (A) AAP bacterial abundance (105cells ml−1), BChl-a concentration (ng l−1)and BChl-a fluorescence (arbitrary units) and (B) size fractionation (<0.8 µm, 0.8–3 µm and >3 µm) of BChl-a fluorescence (in %). The bottom of the euphotic zone is the depth to which 1% of photosynthetically active radiation (PAR) reached. No PAR data were available at stations 25 and 27.
(Fig. 4c). The Div-Chl-a content per Prochlorococcus cell increased with depth at all stations from undetectable val-ues to 2.50 fg cell−1. The BChl-a quota varied substantially along the transect (Fig. 4c). It decreased with depth and peaked at the bottom depth of the euphotic zone. This peak is more pronounced at stations 13 and 9 at 90 and 100 m, respectively, than at station 21 at 70 m. The BChl-a quota
reaching up to 0.44 fg cell−1was highest at station 9 where a second peak occurred at 150 m. The BChl-a quota was sig-nificantly higher in the eastern basin (stations 1, 5 and 9) than in the central (stations 13 and 17, ANOVA, p = 0.007, LSD pair-wised test, p = 0.005) and the western (stations 21, 25 and 27, LSD pair-wised test, p = 0.009) basins.
AAP -- -- BC -Prok
Fig. 4. Vertical profiles at stations 21, 13 and 9 of (A) total prokaryotes, AAP bacteria, Prochlorococcus and Synechococcus abundances
(105cells ml−1), (B) Chl-a, Div-Chl-a and BChl-a concentrations (ng l−1)and (C) Div-Chl-a and BChl-a content per cell (fg cell−1)and BChl-a/Chl-a ratios (%).
3.5 Relationship between AAP bacterial abundance and environmental factors
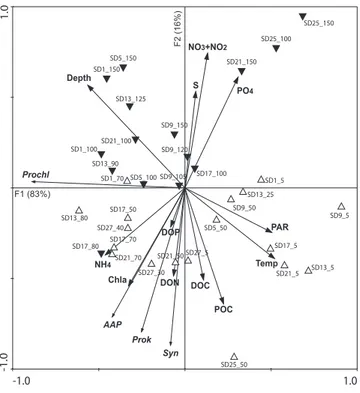
The first two RDA axes explained 78% of the variability in the abundances of bacteria and cyanobacteria and 99% of the relationship between these abundances and the envi-ronmental variables (Fig. 5). The two first canonical axes were significant (p = 0.002). AAP bacteria appeared to be closely linked to the total prokaryotes and the autotrophic Synechococcus. There was a clear separation between the samples collected below the euphotic zone (black down-triangles, on the top-side) and those obtained in the euphotic zone (open up-triangles, on the bottom-side, Fig. 5),
indicat-ing that depth and light availability were significant explana-tory variables. Concentrations of Chl-a, nutrient and organic pools and the temperature and salinity appeared to be main factors accounting for the variation in AAP bacterial and to-tal prokaryotic abundances with depth and longitude.
A multiple regression analysis indicated that concentra-tions of Chl-a, NO3+ NO2and DOC were the main
parame-ters controlling AAP bacterial abundance. The combination of these three parameters explained 54% (p < 0.0001) of the variability in AAP bacterial abundance.
980 D. Lamy et al.: Aerobic anoxygenic phototrophs in the Mediterranean Sea
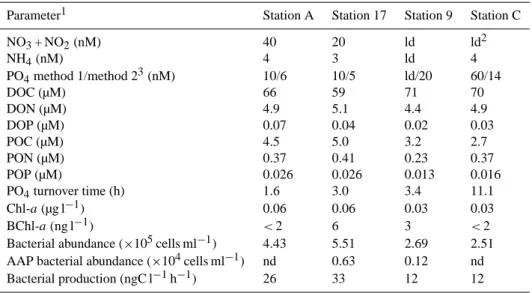
Table 1. Initial chemical conditions and biological parameters prevailing in surface (5 m depth) seawater samples before nutrient
amend-ments.
Parameter1 Station A Station 17 Station 9 Station C NO3+ NO2(nM) 40 20 ld ld2 NH4(nM) 4 3 ld 4 PO4method 1/method 23(nM) 10/6 10/5 ld/20 60/14 DOC (µM) 66 59 71 70 DON (µM) 4.9 5.1 4.4 4.9 DOP (µM) 0.07 0.04 0.02 0.03 POC (µM) 4.5 5.0 3.2 2.7 PON (µM) 0.37 0.41 0.23 0.37 POP (µM) 0.026 0.026 0.013 0.016 PO4turnover time (h) 1.6 3.0 3.4 11.1 Chl-a (µg l−1) 0.06 0.06 0.03 0.03 BChl-a (ng l−1) <2 6 3 <2 Bacterial abundance (×105cells ml−1) 4.43 5.51 2.69 2.51 AAP bacterial abundance (×104cells ml−1) nd 0.63 0.12 nd Bacterial production (ngC l−1h−1) 26 33 12 12
1See in the text for the meaning of the abbreviations. 2ld = below the detection limit (see Material and methods).
3In method 1 (ld = 10 nM), phosphate was analysed on board using the automated colorimetric technique (Tr´eguer and Le Corre, 1975; Wood et al., 1967).
In method 2 (ld = 2 nM), phosphate was analysed on board using the MAGIC method (Rimmelin and Moutin, 2005).
3.6 Effects of nutrient and glucose amendments on bacterial production and growth of AAP bacteria and total prokaryotes
In surface waters, nutrient (NO3+ NO2, NH4and PO4)
con-centrations were initially close or below the detection limit (Table 1). PO4turnover time is the most broadly-applicable
measurement of PO4availability because it has the potential
to identify variations in P availability even when PO4
con-centrations become analytically undetectable (Moutin et al., 2002, 2008). Turnover times of phosphate in surface wa-ters were very short at the four stations. This rapid turnover, along with very low concentrations, indicated that microbial communities experienced conditions where phosphate was scarce. Concentrations of Chl-a, POP and POC, abundance of prokaryotes and bacterial production were significantly lower in stations 9 and C than in stations 17 and A, reflecting the west-east gradient in oligotrophy.
After amendments, bacterial production significantly in-creased in all P, N and NPC enrichments, the latter always stimulating production the most by 6 to 75-fold relative to the control (Table 2). A strong positive effect of glucose on bac-terial production (15-fold relative to the control) was only ob-served at station C. As previously noticed by Van Wambeke et al. (2008), bacterial abundance always increased less than bacterial production. Significant increases in prokaryotic abundance were observed in N amended bottles at station C (2-fold) and in NPC enrichments at both analyzed stations (2- and 6-fold at stations 9 and C, respectively).
The intensity of the AAP bacterial growth response gen-erally differed from that of the total prokaryote growth
re-sponse at the stations they could be compared (stations C and 9). The main differences were the stronger increase after N and C additions for AAP bacteria compared with the total community. In contrast to the positive effect on bacterial pro-duction at all stations, the P addition only weakly stimulated net AAP bacterial and prokaryote growths at station 9.
4 Discussion
Our study is the first to investigate the biogeographical pat-terns of AAP bacteria in the Mediterranean Sea by IR flu-orometry, epifluorescence microscopy and HPLC pigment analysis. Few studies have used all these methods together (Kolber et al., 2001; Lami et al., 2009). In this study, we found significant correlations between AAP bacterial abun-dance, BChl-a fluorescence and concentrations revealing new insights in the distribution and controls of AAP bacteria. The fine spatial scale resolution obtained with measure-ment of BChl-a concentrations, hitherto never shown in other studies, provides a comprehensive picture of biogeographical trends of AAP bacteria along different trophic regimes. The values (up to 3.1 ng l−1)are consistent with other studies of
oligotrophic environments (Cottrell et al., 2006; Kolber et al., 2001; Schwalbach and Fuhrman, 2005; Sieracki et al., 2006). Both AAP bacterial abundance and BChl-a concen-trations significantly decreased with increasing longitude and oligotrophy from west to east, though both varied less with location than with depth. Kolber et al. (2000) suggested that phototrophy would give AAP bacteria a competitive advan-tage over non-phototrophic bacteria when nutrient sources
Table 2. Bacterial production, abundances of total prokaryotes and AAP bacteria after nutrient (P for phosphate, N for nitrogen, C for
glucose and NPC for N + P + C) amendments of surface (5 m depth) seawater samples at 4 stations (St.) of the BOUM transect. Results are expressed relative to the unamended controls.
Bacterial Production Total prokaryotes AAP bacteria P N C NPC P N C NPC P N C NPC St. A 1.7 2.2 1.1 32.8 nd∗ nd nd nd 1.4 1.8 1.7 3.2 St. 17 1.8 1.9 1.3 6.9 nd nd nd nd 1.3 1.6 1.2 3.1 St. 9 3.5 2.0 1.2 18.7 1.3 1.1 1.1 2.1 1.1 4.6 2.4 4.6 St. C 2.4 10.6 15.0 75.5 0.9 2.0 1.1 5.9 1.0 2.4 1.9 3.8 ∗nd: not determined. -1.0 1.0 -1.0 1.0 AAP Prok Syn Prochl Depth Temp S PAR Chla DOC POC DON DOP PO4 NO3+NO2 NH4 SD1_5 SD1_70 SD1_100 SD1_150 SD5_50 SD5_100 SD5_150 SD9_5 SD9_50 SD9_105 SD9_120 SD9_150 SD13_5 SD13_25 SD13_80 SD13_90 SD13_125 SD17_5 SD17_50 SD17_70 SD17_80 SD17_100 SD21_5 SD21_50 SD21_70 SD21_100 SD21_150 SD25_50 SD25_100 SD25_150 SD27_5 SD27_30 SD27_40 Figure 5 F1 (83%) F2 (16%)
Fig. 5. Redundancy analysis using the abundances of AAP
bacte-ria (AAP), total prokaryotes (Prok), Prochlorococcus (Prochl) and
Synechococcus (Syn) as dependent variables (thin arrows) and
tem-perature (Temp), salinity (S), depth, photosynthetically active radi-ation (PAR), concentrradi-ations of Chl-a (Chl-a), nitrite + nitrate (NO2
+ NO3), phosphate (PO4), ammonium (NH4), dissolved organic
carbon (DOC), nitrogen (DON) and phosphorous (DOP) and pticulate organic carbon (POC) as explanatory variables (thick ar-rows). The samples are identified as “below the euphotic zone” (black down-triangles) or “euphotic zone” (open up-triangles) sam-ples. In the name of the samples, the first number corresponds to the number of the sampling station and the second number to the sampling depth.
are scarce. Consistent with a global ocean study (Jiao et al., 2007), our data showed the opposite pattern as the max-imum AAP bacteria abundance was positively related with the concentration of Chl-a. Similarly, no clear link between AAP bacterial abundance and oligotrophy was established
since abundances of AAP bacteria can be high in estuarine, coastal and shelf waters (e.g. Cottrell et al., 2010; Waidner and Kirchman, 2007). AAP bacteria were found to be more abundant in the upper layers of the photic zone than below the sunlit layers of the water column of the Mediterranean Sea. Other studies also reported that AAP bacteria are major bacterial components in the photic zone, in agreement with their phototrophic abilities (Cottrell et al., 2006; Kolber et al., 2001).
Our statistical analyses indicated a strong positive corre-lation between AAP bacteria and various indices of organic matter supply, suggesting that AAP bacteria were more abun-dant when organic carbon was available. Furthermore, their abundance and BChl-a concentrations were highest in the western basin which is a bit richer in nutrients (Pujo-Pay et al., 2011) and in phytoplankton-derived organic material (L´opez-Sandoval et al., 2011) than the eastern basin. The distribution of AAP bacteria may be determined by the avail-ability of specific organic compounds provided by phyto-plankton (Jiao et al., 2007). Consistent with the net increase of their abundance after glucose additions in most stations, this supports the view that AAP bacteria represent a physio-logical group of photoheterotrophs able to use light-derived energy to rapidly grow when organic carbon sources are available. This is in agreement with their high abundances in estuarine waters (Schwalbach and Fuhrman, 2005; Waid-ner and Kirchman, 2007) and their common association with phytoplankton blooms (Gonzalez et al., 2000; Suzuki et al., 2001).
It has been shown that AAP bacteria are mainly free-living in surface offshore Mediterranean waters and that a large fraction (50%) can be attached to particles at the DCM (Lami et al., 2009). By examining the distribution of particle-attached and free-living BChl-a fluorescence on a larger dataset, we found that the majority of AAP bacteria living at the DCM of Mediterranean waters were free-living cells. This supports the view that this free-living lifestyle may re-flect cellular and physiological adaptations to oligotrophic waters (Cottrell et al., 2010), with a low and intermittent sup-ply of dissolved substrates.
982 D. Lamy et al.: Aerobic anoxygenic phototrophs in the Mediterranean Sea Our data on BChl-a and Div-Chl-a can be used to
fur-ther explore the importance of phototrophy in AAP bacteria
in this part of the Mediterranean Sea. The
concentra-tions of BChl-a per AAP cell in the eastern basin of the Mediterranean Sea was 4- to 16-fold lower than the Div-Chl-a content per Prochlorococcus cell. This may suggest that phototrophy was probably a lower part of the AAP cell metabolism when compared to Prochlorococcus, which mainly relies on phototrophy. However, the BChl-a quotas reached notably high values along the transect. These val-ues are up to 2.5-fold higher than the valval-ues observed in the oligotrophic South Pacific Ocean (Lami et al., 2007), 3-fold higher than those observed in the Sargasso Sea (Sieracki et al., 2006) and until 10-fold higher than those observed in the Mid-Atlantic Bight (Cottrell et al., 2006). Nutrients and Chl-aconcentrations measured during the BOUM cruise suggest that the oligotrophic conditions experienced by AAP bacteria during the stratification period of the Mediterranean Sea were more severe than that observed in the three latter oligotrophic regions. Moreover, the BChl-a content per cell was signifi-cantly higher in the ultra-oligotrophic eastern basin than in the two other basins. Assuming that BChl-a quotas indicate the extent of phototrophic potential (Cottrell et al., 2006), our data suggest that reliance on phototrophy varied along the oligotrophic gradient and that nutrient and/or carbon lim-itation favors BChl-a synthesis in natural communities as it has been reported for AAP cultures (Kobl´ıˇzek et al., 2003; Yurkov and Csotonyi, 2009).
In the Mediterranean Sea, which is one of the world’s most oligotrophic bodies of water, inorganic nutrients and partic-ularly phosphate (P) have been shown to limit both phyto-plankton and bacteria in certain areas during stratification (Pinhassi et al., 2006; Thingstad et al., 1998; Van Wambeke et al., 2002). Despite unusual high phosphate concentrations at station C, in situ chemical concentrations indicated more stringent oligotrophic conditions in the eastern basin than in the western basin (Pujo-Pay et al., 2011). It has been hypoth-esized that the capacity of AAP bacteria to generate energy from light could reduce the metabolic requirements for recy-cling the organic carbon resources (Cho et al., 2007). Maˇs´ın et al. (2008) suggested that light-generated energy could en-hance P acquisition in P-depleted environments. On the ba-sis of our nutrient-addition experiments, we cannot speculate about P-limitation of AAP bacteria since growth of AAP and total prokaryotes were not stimulated by P addition, although higher heterotrophic bacterial activity was observed. Consis-tent with our results, Tanaka et al. (2011) did not find any in-dication of P-alone limitation although a clear P-starved sta-tus in the Mediterranean basins was observed. Moreover, we observed that net growth of AAP bacteria was enhanced by glucose and nitrogen additions in the eastern basin whereas net growth of total prokaryotes was not stimulated by these additions. This result does not favor the hypothesis that light-derived energy could serve for supporting the nutrient acqui-sition in a nutrient-depleted environment. The problem may
be in trying to deduce the impact of the additions by mea-suring net growth, which is a function of the bacterial re-sponse and mortality factors. However, AAP bacteria and total prokaryotes responded differently in terms of net varia-tion of their abundances, which suggest different growth and mortality controls between these two populations.
5 Conclusions
Our study gives a comprehensive picture of the longitudi-nal and vertical distribution of AAP bacteria in the Mediter-ranean Sea. AAP bacteria were more abundant in the eu-photic zone than in deeper waters and in the western than in the eastern basin of the Mediterranean Sea. As a signifi-cant part of the total bacterial abundance, AAP bacteria abun-dances decreased with the increasing oligotrophic gradient from the western to the eastern basin of the Mediterranean Sea. The simultaneous measurements of BChl-a fluores-cence, pigment concentration and AAP cell abundance ex-amined along with some environmental parameters support the notion of the prominence of the heterotrophic metabolism in AAP bacteria. However, the high BChl-a quotas observed in the samples from the ultra-oligotrophic eastern basin sug-gest that their phototrophic lifestyle may be especially ad-vantageous under nutrient- and carbon-depleted environmen-tal conditions. Assessing the impact of photoheterotrophy in aquatic systems will be needed to better understand the role of this functional group into elemental cycling.
Acknowledgements. This is a contribution of the BOUM
(Bio-geochemistry from the Oligotrophic to the Ultraoligotrophic Mediterranean) experiment (http://www.com.univ-mrs.fr/BOUM/) of the french national LEFE-CYBER program, the european IP SESAME and the international IMBER project. The BOUM experiment was coordinated by the Institut des Sciences de l’Univers (INSU) and managed by the Centre National de la Recherche Scientifique (CNRS). The authors thank the crew of the R/V L’Atalante for outstanding shipboard operation and the scientists from the BOUM cruise for helpful contribution at sea. Claudie Marec and Louis Prieur are warmly thanked for their efficient help in CTD rosette management and data processing. We also thank Romain Mauriac and Agathe Talarmin for measurement of DIP turnover time and Claude Courties for his contribution to the flow cytometry analyses. We wish to thank Thierry Moutin for coordinating the BOUM cruise and inviting us onboard. We are grateful to Michal Kobl´ıˇzek for his help with detection of AAP bacterial colonies using the infra-red system available in his laboratory. Thanks are also due to two reviewers for useful comments on the manuscript. This work was financially supported by the Pierre Fabre-UPMC-CNRS join research team (EMR) at the Observatoire Oc´eanologique de Banyuls-sur-mer (OBB) and by the program LEFE-CYBER PANAME (CNRS-INSU). MTC and DLK were supported by NSF grant MCB-0453993. DL was supported by the EMR at the OBB and OD was supported by a grant from the Ministry of Higher Education and Research.
The publication of this article is financed by CNRS-INSU.
References
Beatty, J. T.: On the natural selection and evolution of the aerobic phototrophic bacteria, Photosynth. Res., 73, 109–114, 2002. Bendschneider, K. and Robinson, R. J.: A new
spectrophotomet-ric determination of nitrite in seawater, J. Mar. Res., 11, 87–96, 1952.
Benner, R. and Strom, M.: A critical-evaluation of the analytical blank associated with DOC measurements by high-temperature catalytic-oxidation, Mar. Chem., 41, 153–160, 1993.
Berman, T., Walline, P. D., Schneller, A., Rothenberg, J., and Towsend, D. W.: Secchi disk depth record: a claim for the east-ern Mediterranean, Limnol. Oceanogr., 30, 447–448, 1985. Cho, J. C., Stapels, M. D., Morris, R. M., Vergin, K. L.,
Schwal-bach, M. S., Givan, S. A., Barofsky, D. F., and Giovannoni, S. J.: Polyphyletic photosynthetic reaction centre genes in olig-otrophic marine Gammaproteobacteria, Environ. Microbiol., 9, 1456–1463, 2007.
Cottrell, M. T. and Kirchman, D. L.: Photoheterotrophic microbes in the Arctic Ocean in summer and winter, Appl. Environ. Mi-crobiol., 75, 4958–4966, 2009.
Cottrell, M. T., Mannino, A., and Kirchman, D. L.: Aerobic anoxy-genic phototrophic bacteria in the Mid-Atlantic Bight and the North Pacific Gyre, Appl. Environ. Microbiol., 72, 557–564, 2006.
Cottrell, M. T., Ras, J., and Kirchman, D. L.: Bacteriochlorophyll and community structure of aerobic anoxygenic phototrophic bacteria in a particle-rich estuary, ISME J., 4, 945–954, 2010. Crombet, Y., Leblanc, K., Qu´eguiner, B., Moutin, T., Rimmelin,
P., Ras, J., Claustre, H., Leblond, N., Oriol, L., and Pujo-Pay, M.: Deep silicon maxima in the stratified oligotrophic Mediter-ranean Sea, Biogeosciences, 8, 459–475, doi:10.5194/bg-8-459-2011, 2011.
De Corte, D., Yokokawa, T., Varela, M. M., Agogue, H., and Herndl, G. J.: Spatial distribution of bacteria and Archaea and amoA gene copy numbers throughout the water column of the eastern Mediterranean Sea, ISME J., 3, 147–158, 2009. Eiler, A.: Evidence for the ubiquity of mixotrophic bacteria in the
upper ocean: Implications and consequences, Appl. Environ. Mi-crobiol., 72, 7431–7437, 2006.
Gonzalez, J. M., Simo, R., Massana, R., Covert, J. S., Casamayor, E. O., Pedros-Alio, C., and Moran, M. A.: Bacterial community structure associated with a dimethylsulfoniopropionate produc-ing North Atlantic algal bloom, Appl. Environ. Microbiol., 66, 4237–4246, 2000.
Holmes, M. R., Aminot, A., K´erouel, R., Hooker, B. A., and Peter-son, B. J.: A simple and precise method for measuring ammo-nium in marine and freshwater ecosystems, Can. J. Fish. Aquat. Sci., 56, 1801–1808, 1999.
Ignatiades, L.: Scaling the trophic status of the Aegean Sea, eastern Mediterranean, J. Sea Res., 54, 51–57, 2005.
Jeanthon, C., Boeuf, D., Dahan, O., Le Gall, F., Garczarek, L., Bendif, E. M., and Lehours, A.-C.: Diversity of cultivated and metabolically active aerobic anoxygenic phototrophic bacteria along an oligotrophic gradient in the Mediterranean Sea, Bio-geosciences Discuss., in preparation, 2011.
Jiao, N., Zhang, Y., Zeng, Y. H., Hong, N., Liu, R., Chen, F., and Wang, P.: Distinct distribution pattern of abundance and diversity of aerobic anoxygenic phototrophic bacteria in the global ocean, Environ. Microbiol., 9, 3091–3099, 2007.
Karl, D. M.: Microbiological oceanography – Hidden in a sea of microbes, Nature, 415, 590–591, 2002.
Karl, D. M. and Tien, G.: MAGIC: a sensitive and precise method for measuring dissolved phosphorus in aquatic environment, Limnol. Oceanogr., 37, 105–116, 1992.
Kobl´ıˇzek, M., B´ej`a, O., Bidigare, R. R., Christensen, S., Benitez-Nelson, B., Vetriani, C., Kolber, M. K., Falkowski, P. G., and Kolber, Z. S.: Isolation and characterization of Erythrobacter sp strains from the upper ocean, Arch. Microbiol., 180, 327–338, 2003.
Kobl´ıˇzek, M., Sto´n-Egiert, J., Sagan, S., and Kolber, Z. S.: Diel changes in bacteriochlorophyll a concentration suggest rapid bacterioplankton cycling in the Baltic Sea, FEMS Microbiol. Ecol., 51, 353–361, 2005.
Kobl´ıˇzek, M., Falkowski, P. G., and Kolber, Z. S.: Diversity and distribution of photosynthetic bacteria in the Black Sea, Deep-Sea Res. Pt. II, 53, 1934–1944, 2006.
Kobl´ıˇzek, M., Maˇs´ın, M., Ras, J., Poulton, A. J., and Pr´aˇsil, O.: Rapid growth rates of aerobic anoxygenic phototrophs in the ocean, Environ. Microbiol., 9, 2401–2406, 2007.
Kolber, Z. S., Van Dover, C. L., Niederman, R. A., and Falkowski, P. G.: Bacterial photosynthesis in surface waters of the open ocean, Nature, 407, 177–179, 2000.
Kolber, Z. S., Plumley, F. G., Lang, A. S., Beatty, J. T., Blankenship, R. E., VanDover, C. L., Vetriani, C., Kobl´ıˇzek, M., Rathgeber, C., and Falkowski, P. G.: Contribution of aerobic photoheterotrophic bacteria to the carbon cycle in the ocean, Science, 292, 2492– 2495, 2001.
Lamy, D., De Carvalho-Maalouf, P., Cottrell, M. T., Lami, R., Catala, P., Oriol, L., Caparros, J., Ras, J., Kirchman, D. L., and Lebaron, P.: Seasonal dynamics of aerobic phototrophs in a Mediterranean coastal lagoon, Aquat. Microb. Ecol., 62, 153– 163, 2011.
Lami, R., Cottrell, M. T., Ras, J., Ulloa, O., Obernosterer, I., Claus-tre, H., Kirchman, D. L., and Lebaron, P.: High abundances of aerobic anoxygenic photosynthetic bacteria in the South Pacific Ocean, Appl. Environ. Microbiol., 73, 4198–4205, 2007. Lami, R., `Euperov´a, Z., Ras, J., Lebaron, P., and Kobl´ıˇzek, M.:
Dis-tribution of free-living and particle-attached aerobic anoxygenic phototrophic bacteria in marine environments, Aquat. Microb. Ecol., 55, 31–38, 2009.
Lehours, A.-C., Cottrell, M. T., Dahan, O., Kirchman, D. L., and Jeanthon, C.: Summer distribution and diversity of aero-bic anoxygenic phototrophic bacteria in the Mediterranean Sea in relation to environmental variables, FEMS Microbiol. Ecol., 74, 397–409, 2010.
L´opez-Sandoval, D. C., Fern´andez, A., and Mara˜n´on, E.: Dis-solved and particulate primary production along a longitudinal
984 D. Lamy et al.: Aerobic anoxygenic phototrophs in the Mediterranean Sea
gradient in the Mediterranean Sea, Biogeosciences, 8, 815–825, doi:10.5194/bg-8-815-2011, 2011.
Marie, D., Simon, N., Guillou, L., Partensky, F., and Vaulot, D.: Flow cytometric analysis of marine picoplankton, in: Protocols in flow cytometry and cell sorting, edited by: Diamond, R. A. and De Maggio, S., Springer-Verlag, Berlin, Germany, 421–454, 2002.
Maˇs´ın, M., Nedoma, J., Pechar, L., and Kobl´ıˇzek, M.: Distribution of aerobic anoxygenic phototrophs in temperate freshwater sys-tems, Environ. Microbiol., 10, 1988–1996, 2008.
Moran, M. A. and Miller, W. L.: Resourceful heterotrophs make the most of light in the coastal ocean, Nat. Rev. Microbiol., 5, 792–800, 2007.
Moutin, T. and Raimbault, P.: Primary production, carbon export and nutrients availability in western and eastern Mediterranean Sea in early summer 1996 (MINOS cruise), J. Marine Syst., 33– 34, 273–288, 2002.
Moutin, T., Thingstad, T. F., Van Wambeke, F., Marie, D., Slawyk, G., Raimbault, P., and Claustre, H.: Does competition for nanomolar phosphate supply explain the predominance of the cyanobacterium Synechococcus?, Limnol. Oceanogr., 47, 1562– 1567, 2002.
Moutin, T., Karl, D. M., Duhamel, S., Rimmelin, P., Raimbault, P., Van Mooy, B. A. S., and Claustre, H.: Phosphate availability and the ultimate control of new nitrogen input by nitrogen fix-ation in the tropical Pacific Ocean, Biogeosciences, 5, 95–109, doi:10.5194/bg-5-95-2008, 2008.
Moutin, T., Van Wambeke, F., and Prieur, L.: Introduction to the Biogeochemistry from the Oligotrophic to the Ultraoligotrophic Mediterranean (BOUM) experiment, Biogeosciences Discuss., in preparation, 2011.
Murphy, J. and Riley, J. P.: A modified single solution method for the determination of phosphate in natural waters, Anal. Chim. Acta, 27, 31–36, 1962.
Oz, A., Sabehi, G., Kobl´ıˇzek, M., Massana, R., and B´ej`a, O.:
Roseobacter-like bacteria in Red and Mediterranean Sea aerobic
anoxygenic photosynthetic populations, Appl. Environ. Micro-biol., 71, 344–353, 2005.
Pinhassi, J., Gomez-Consarnau, L., Alonso-Saez, L., Sala, M. M., Vidal, M., Pedros-Alio, C., and Gasol, J. M.: Seasonal changes in bacterioplankton nutrient limitation and their effects on bacterial community composition in the NW Mediterranean Sea, Aquat. Microb. Ecol., 44, 241–252, 2006.
Pregl, F.: Quantitative Organic Microanalysis, Churchill, London, 69 pp., 1937.
Pujo-Pay, M. and Raimbault, P.: Improvement of the wet-oxydation procedure for simultaneous determination of particulate organic nitrogen and phosphorus collected on filters, Mar. Ecol.-Prog. Ser., 105, 203–207, 1994.
Pujo-Pay, M., Conan, P., and Raimbault, P.: Excretion of dissolved organic nitrogen by phytoplankton assessed by wet oxidation and N-15 tracer procedures, Mar. Ecol.-Prog. Ser., 153, 99–111, 1997.
Pujo-Pay, M., Conan, P., Oriol, L., Cornet-Barthaux, V., Falco, C., Ghiglione, J.-F., Goyet, C., Moutin, T., and Prieur, L.: In-tegrated survey of elemental stoichiometry (C, N, P) from the western to eastern Mediterranean Sea, Biogeosciences, 8, 883– 899, doi:10.5194/bg-8-883-2011, 2011.
Ramette, A.: Multivariate analyses in microbial ecology, FEMS Mi-crobiol. Ecol., 62, 142–160, 2007.
Ras, J., Claustre, H., and Uitz, J.: Spatial variability of phytoplank-ton pigment distributions in the Subtropical South Pacific Ocean: comparison between in situ and predicted data, Biogeosciences, 5, 353–369, doi:10.5194/bg-5-353-2008, 2008.
Rimmelin, P. and Moutin, T.: Re-examination of the MGIC method to determine low orthophosphate concentration in seawater, Anal. Chim. Acta, 548, 174–182, 2005.
Salka, I., Moulisov´a, V., Kobl´ıˇzek, M., Jost, G., J¨urgens, K., and Labrenz, M.: Abundance, depth distribution, and composition of aerobic bacteriochlorophyll a-producing bacteria in four basins of the central Baltic Sea, Appl. Environ. Microbiol., 74, 4398– 4404, 2008.
Schwalbach, M. S. and Fuhrman, J. A.: Wide-ranging abundances of aerobic anoxygenic phototrophic bacteria in the world ocean revealed by epifluorescence microscopy and quantitative PCR, Limnol. Oceanogr., 50, 620–628, 2005.
Sharp, J. H.: Improved analysis for particulate organic carbon and nitrogen from seawater, Limnol. Oceanogr., 19, 984–989, 1974. Shiba, T.: Roseobacter litoralis gen. nov., sp. nov., and
Roseobac-ter denitrificans sp. nov., aerobic pink-pigmented bacRoseobac-teria which
contain bacteriochlorophyll-a, Syst. Appl. Microbiol., 14, 140– 145, 1991.
Sieracki, M. E., Gilg, I. C., Thier, E. C., Poulton, N. J., and Goericke, R.: Distribution of planktonic aerobic anoxygenic photoheterotrophic bacteria in the northwest Atlantic, Limnol. Oceanogr., 51, 38–46, 2006.
Smith, D. C. and Azam, F.: A simple and economical method for measuring bacterial protein synthesis rates in seawater using 3H-leucine, Mar. Microb. Food Webs, 6, 107–114, 1992.
Suzuki, M. T. and B´ej`a, O.: An elusive marine photosynthetic bac-terium is finally unveiled, P. Natl. Acad. Sci. USA, 104, 2561– 2562, 2007.
Suzuki, M. T., Preston, C. M., Chavez, F. P., and DeLong, E. F.: Quantitative mapping of bacterioplankton populations in sea-water: field tests across an upwelling plume in Monterey Bay, Aquat. Microb. Ecol., 24, 117–127, 2001.
Tanaka, T., Thingstad, T. F., Christaki, U., Colombet, J., Cornet-Barthaux, V., Courties, C., Grattepanche, J.-D., Lagaria, A., Ne-doma, J., Oriol, L., Psarra, S., Pujo-Pay, M., and Van Wambeke, F.: Lack of P-limitation of phytoplankton and heterotrophic prokaryotes in surface waters of three anticyclonic eddies in the stratified Mediterranean Sea, Biogeosciences, 8, 525–538, doi:10.5194/bg-8-525-2011, 2011.
ter Braak, C. J. and Smilauer, P.: CANOCO reference manual and CanoDraw for Wimdows user’s guide: software for canoni-cal community ordination (version 4.5), Microcomputer Power, Ithaca, NY, 500 pp., 2002.
ter Braak, C. J. F.: CANOCO – an extension of DECORANA to analyze species-environment relationships, Hydrobiologia, 184, 169–170, 1989.
Thingstad, T. F., Zweifel, U. L., and Rassoulzadegan, F.: P limita-tion of heterotrophic bacteria and phytoplankton in the northwest Mediterranean, Limnol. Oceanogr., 43, 88–94, 1998.
Tr´eguer, P. and Le Corre, P.: Manuel d’analyse des sels nutritifs dans l’eau de mer, in: Utilisation de l’Autoanalyzer II Technicon, 2nd edn., edited by: Laboratoire d’Oc´eanographie chimique, U. d. B. O., Brest, France, 110 pp., 1975.
Van Heukelem, L. and Thomas, C. S.: Computer-assisted high-performance liquid chromatography method development with applications to the isolation and analysis of phytoplankton pig-ments, J. Chromatogr., 910, 31–49, 2001.
Van Wambeke, F., Christaki, U., Giannokourou, A., Moutin, T., and Souvemerzoglou, K.: Longitudinal and vertical trends of bac-terial limitation by phosphorus and carbon in the Mediterranean Sea, Microb. Ecol., 43, 119–133, doi:10.1007/s00248-001-0038-4, 2002.
Van Wambeke, F., Nedoma, J., Duhamel, S., and Lebaron, P.: Alka-line phosphatase activity of marine bacteria studied with ELF 97 substrate: success and limits in the P-limited Mediterranean Sea, Aquat. Microb. Ecol., 52, 245–251, 2008.
Van Wambeke, F., Catala, P., and Lebaron, P.: Relationships between cytometric characteristics of high and low nucleic-acid bacterioplankton cells, bacterial production and environ-mental parameters along a longitudinal gradient across the Mediterranean Sea, Biogeosciences Discuss., 7, 8245–8279, doi:10.5194/bgd-7-8245-2010, 2010.
Waidner, L. A. and Kirchman, D. L.: Aerobic anoxygenic pho-totrophic bacteria attached to particles in turbid waters of the Delaware and Chesapeake estuaries, Appl. Environ. Microbiol., 73, 3936–3944, 2007.
Winter, C., Kerros, M. E., and Weinbauer, M. G.: Seasonal changes of bacterial and archaeal communities in the dark ocean: evi-dence from the Mediterranean Sea, Limnol. Oceanogr., 54, 160– 170, 2009.
Wood, E. D., Amstrong, F. A. J., and Richards, F. A.: Determination of nitrate in sea water by cadmium-copper reduction to nitrite, J. Mar. Biol. Assoc. UK, 47, 23–31, 1967.
Yurkov, V. V. and Beatty, J. T.: Aerobic anoxygenic phototrophic bacteria, Microbiol. Mol. Biol. Rev., 62, 695–724, 1998. Yurkov, V. V. and Csotonyi, J. T.: New light on aerobic anoxygenic
phototrophs, Adv. Photosynth. Respir., 28, 31–55, 2009. Yutin, N. and B´ej`a, O.: Putative novel photosynthetic reaction
cen-tre organizations in marine aerobic anoxygenic photosynthetic bacteria: insights from metagenomics and environmental ge-nomics, Environ. Microbiol., 7, 2027–2033, 2005.
Yutin, N., Suzuki, M. T., Teeling, H., Weber, M., Venter, J. C., Rusch, D. B., and B´ej`a, O.: Assessing diversity and biogeog-raphy of aerobic anoxygenic phototrophic bacteria in surface waters of the Atlantic and Pacific Oceans using the Global Ocean Sampling expedition metagenomes, Environ. Microbiol., 9, 1464–1475, 2007.
Yutin, N., B´ej`a, O., and Suzuki, M. T.: The use of denaturing gra-dient gel electrophoresis with fully degenerate pufM primers to monitor aerobic anoxygenic phototrophic assemblages, Limnol. Oceanogr.-Meth., 6, 427–440, 2008.