HAL Id: hal-01712113
https://hal.archives-ouvertes.fr/hal-01712113
Submitted on 16 Mar 2018HAL is a multi-disciplinary open access archive for the deposit and dissemination of sci-entific research documents, whether they are pub-lished or not. The documents may come from teaching and research institutions in France or abroad, or from public or private research centers.
L’archive ouverte pluridisciplinaire HAL, est destinée au dépôt et à la diffusion de documents scientifiques de niveau recherche, publiés ou non, émanant des établissements d’enseignement et de recherche français ou étrangers, des laboratoires publics ou privés.
Photochemical Mapping of the Multimodal Plasmonic
Response of 2D Gold Crystals
Alexandre Teulle, Audrey Sanchot, Eléna Ishow, Jadab Sharma, Erik Dujardin
To cite this version:
Alexandre Teulle, Audrey Sanchot, Eléna Ishow, Jadab Sharma, Erik Dujardin. Photochemical Map-ping of the Multimodal Plasmonic Response of 2D Gold Crystals. Journal of Physical Chemistry C, American Chemical Society, 2017, 121 (29), pp.15908-15914. �10.1021/acs.jpcc.7b03650�. �hal-01712113�
Photochemical Mapping of the Multimodal
Plasmonic Response of 2D Gold Crystals
Alexandre Teulle,*,†,§ Audrey Sanchot,†,¶ Eléna Ishow,‡ Jadab Sharma,†,‖ and Erik Dujardin*,† † CEMES CNRS UPR 8011, 29 rue Jeanne Marvig, 31055 Toulouse Cedex 4, France.
§ Present address: School of Physics and Astronomy, University of Exeter, Exeter EX4 4QL U.K.
¶ Present address: ICB, UMR 6303 CNRS – Université de Bourgogne Franche-Comté, Dijon,
F-21078, FRANCE
‡ CEISAM—UMR CNRS 6230, Université de Nantes, 2 rue de la Houssinière, 44322 Nantes,
France.
ABSTRACT
The properties of hybrid plasmonic structures comprising a molecular ultrathin film of photoactive azobenzene derivatives and individual mesoscopic crystalline gold platelets are studied upon monochromatic irradiation. The spatial variation of the optical near-field produced by the excitation of high-order plasmon modes induces a net modification of the film corrugation with subwavelength pattern features. Unlike previous reports exploiting azo dye-grafted polymers, the photo-migration of neat films composed of glass-forming push-pull azo compounds yields a highly resolved negative imprint of the local electric field intensity variations able to discriminate the different plasmon resonances sustained in these multimodal triangular prisms. Our experiments are in full agreement with Green Dyadic Method simulations of near-field intensity maps and constitute both an efficient imaging technique and a way to self-align patterns of an optically active molecular medium in registry with the optical hotspots, which could be a major asset for the integration of filtering or gain media near plasmon-enhanced devices.
KEYWORDS: plasmonics, molecular probes, photochemical imaging, gold nanoparticles, azo derivatives.
Plasmonics is offering an unprecedented opportunity to shape the electromagnetic fields near metallic surfaces below the diffraction limit at visible wavelength.1 Concomitantly, numerous
methods have been developed to image and characterize local variations of the optical field.2 Yet,
the experimental challenges and intrinsic low speed of near-field microscopy techniques have fostered the search for direct and indirect methods to locally probe surface plasmon resonances with improved resolution such as non-linear microscopy,3-6 electron energy loss spectroscopy,7-9
cathodoluminescence,10-13 photoelectron emission microscopy14 for the direct methods and
plasmon-induced photopolymerization15-17 or photomigration18-19 for the indirect ones. These latter
techniques exploit the light-sensitive properties of molecular films which are triggered by the field in the direct proximity of the active species. The absorption of UV or visible photons by photochromes like azo compounds generates large conformational changes. Under polarized illumination, the resulting E-to-Z isomerization induces a net mass transport along the optical field gradient, giving rise to surface structuration. In early works, this opto-mechanical phenomenon has been exploited in the far-field to design nanostructured holographic surface relief gratings using two interfering monochromatic beams.20-22 More recently, Hubert et al. have successfully
applied this process to the subwavelength mapping of the near-field generated by dipolar plasmon resonances supported by small lithographically designed nanostructures.18 In order to reach
subwavelength resolution, poly(methyl methacrylate) (PMMA) has been functionalized with Disperse Red 1 (DR1),23 a polar azo compound widely used for nonlinear optical applications, and
spin-coated as 80 nm-thick films. However, the photosensitivity of such films is limited by the reduced amount of grafted active molecules (up to 30% of dye-functionalized monomers). Moreover, their response is convoluted by the visco-elastic properties of the polymer chains.
In this paper, we perform photomigration imaging with non-doped amorphous thin films exclusively composed of the purpose-made azo derivative tBuCN. We chemically engineer this molecule which displays efficient photoisomerization in the solid state and undergoes large mass transport under polarized illumination. Thus, the photomigration imaging process is expected to be more sensitive than that with dye-functionalized polymers. With this novel molecular probe, we image the plasmon fields in the vicinity of in-house single crystalline bi-dimensional gold prisms of assorted shapes and sizes synthesized by wet colloidal chemistry (See Materials and Methods). These metallic particles behave as resonators and exhibit a whole spectral range of multiple order plasmon modes associated with complex near-field spatial distributions that require deep subwavelength imaging to be comprehensively rendered.6, 24 Using a pure tBuCN film, we
obtain, at two different wavelengths, an imprint of the local electric field intensity patterns associated to these high order resonances and evidence the modal behavior of the prisms. Our model based on the 3D Green Dyadic Method (GDM) tackles the challenging task of computing the field distribution above the Au prisms, and clearly corroborates the observations.
Materials and Methods
Molecular probe synthesis. The tBuCN molecular probe
(4-[bis(4’-tert-butylbiphenyl-4-yl)amino)]-4’-cyanoazobenzene) was synthesized following a four-step process whose details are discussed in reference 25.
Gold nanoplatelets synthesis. Gold nanoplatelets were produced by reducing HAuCl4
(0.477 mM) with polyvinylpyrrolidone (19.1 mM) in an aqueous solution containing NaNO3
(0.143 mM) and KI (0.143 mM). The pH was increased by addition of NaOH (1 M) diluted in water, and the solution was left undisturbed for 18 hours. Finally, the supernatant was discarded and the gold nanoplatelets were re-dispersed in deionized water without any additional purification step.
Sample preparation. 15 nm Indium Tin Oxide-coated glass substrates (150 µm thick) from
DiamondCoatings were labelled with arrays of aluminium cross-marks using photolithography. Marked substrates were thoroughly cleaned three times in two successive ultrasonic baths of HPCL grade acetone and isopropanol. A drop of the nanoplatelets suspension was deposited on the substrate that is gently immersed into three successive baths of warm (50 ºC) deionized water to remove residual polyvinylpyrrolidone from the substrate and nanoplatelets surfaces. At this stage, AFM imaging (Bruker Dimension 3000) of the gold prisms was performed. Then, a solution of 10 mg tBuCN powder in 1 mL chloroform was spin-coated on the substrate at 3000 rpm (5000 rpm/s acceleration) for 45 s, resulting in a thin film of 40 to 70 nm. After complete evaporation of the chloroform, AFM indentation and scan were performed to monitor the tBuCN film thickness.
Photochemical imaging. The 457 nm or 514 nm lines of a linearly-polarized Argon laser
(Spectra Physics 2065-5S) were used to illuminate the sample under normal incidence for one hour and induce the photo-isomerization and subsequent mass-motion of the tBuCN molecules. The
laser beam power per unit surface and diameter were equal to 400 mW.cm-2 and 5 mm
respectively. After irradiation, the photo-induced topological contrast of the tBuCN film was imaged using AFM in tapping mode (OTESPA-R3, Bruker). AFM images were processed with the WSxM software.26
Electric field intensity maps computation. Our numerical approach is based on the 3D Green
Dyadic method27 that allows the computation of the local electromagnetic field inside and outside
any arbitrary metallic structures placed on a substrate. First, the 3D metal particle is discretized into elementary cells of a hexagonal compact lattice.28 Then, the generalized propagator of this
discretized structure, that contains its total electromagnetic response to any illuminating field, is computed following the procedure described in 27-28. The electric field illuminating the structure is
set as a monochromatic plane wave of chosen frequency. Finally, the expressions of the generalized propagator and the illuminating field are introduced in the Lippman-Schwinger equation for the electric field, yielding the total electric field in a plane of constant height placed above the structure, and coinciding with the surface of the photosensitive film.
Our experimental approach to image the near-field distribution in the vicinity of two-dimensional crystalline Au nanoprisms by photomigration is schematized in Figure 1. First, the 20 nm thick Au prismatic particles are drop-casted on a cross-marked silica substrate. A solution of tBuCN compound in chloroform (0.6 wt%) is spin-coated to form a 50 to 70 nm-thick photosensitive amorphous film uniformly covering the plasmonic nanostructures (Fig. 1a). Next, the sample is illuminated under normal incidence by a 5 mm diameter collimated and linearly polarized laser beam (excitation wavelength λexc = 457 or 514 nm). During a 1-hour long
irradiation, the tBuCN molecules undergo E-Z isomerization cycles that result in a mass motion from high to low electric field intensity regions.18 The net effect of the photomigration is to modify
the surface topography, which is monitored by tapping mode Atomic Force Microscopy (AFM) (Fig. 1b) and compared to AFM images recorded before irradiation. AFM imaging also provides measurements of the dimensions and shape of the gold prisms and allows to relocate individual nanostructures with respect to the cross-marks at each stage. Figures 2(a-d) illustrate this protocol in the case of a discoidal prism. AFM images of the 600 nm diameter disk before (Fig. 2a) and after spin-coating of the tBuCN (Fig. 2b) show that the molecular film uniformly covers the substrate and nanoparticle. On the contrary, after irradiation at 457 nm, Figure 2c reveals nano-structuring of the film surface with patterns of typical in-plane size of ca. 200 nm. The computation of the electric field intensity above the structure indicates that these patterns are strongly related to the topographic modulations measured at the surface of the tBuCN film (Fig. 2d). Compared to earlier photomigration studies based on azo-grafted polymer, our approach exploits the high resolution imaging performances (down to 20-nm feature size) and extreme sensitivity (average peak-to-through amplitude reaching 140% of the film thickness) of molecular materials made
exclusively of push-pull azo structures, such as tBuCN, containing bulky substituents that have been carefully engineered to maximize the photomigration effect.25
This molecular probe integrates an azo bond that readily photoisomerizes leading to the displacement of the whole molecule (Figure 1c, inset). The significant steric hindrance of the tert-butylbiphenyl terminal groups prevents the film crystallization due to impeded π−π aggregation and imparts tBuCN with large free volume that facilitates significant configuration changes and promotes efficient molecular mobility under light illumination. Upon asymmetric substitution of the azobenzene moiety with terminal cyano and amino groups, the intense π−π transitions are shifted to the visible range and overlap with the symmetry-forbidden n-π state, hence effective excitation of tBuCN can be performed in the blue region. The absorption spectrum of tBuCN thin films displays two absorption bands: the higher-energy one, at 328 nm, is related to ππ* aminobiphenyl charge transfer transitions while the broad lower-energy band centered at 484 nm involves strong ππ* charge transfer from the donating amino group to the electron-withdrawing cyano group.25, 29 In the low energy part of this spectral window, the Au nanoprisms
exhibit multiple higher-order plasmon resonances giving rise to elaborate near-field distributions.24
Closer examination of the AFM image after laser irradiation at 457 nm (Fig. 2c) shows topographic variations directly above, as well as around the metallic particle. The surface of the film located on top of the disk exhibits a sub-wavelength doughnut-shaped pattern modulated by an axial symmetry with respect to the horizontal dotted line. This pattern complies with the expected symmetry of the optical response of a circular Au prism under linearly polarized
excitation. Farther away from the gold particle, the film presents an isotropic sinusoidal embossing. This film structuring is the result of the azo molecular migration away from high electric field intensity regions and the subsequent accumulation of matter where light intensity is low, the mass transport being triggered by cycled E-Z photoisomerization reactions.18 To gain a
better insight into the correlation between this pattern and the optical near-field, we compute the total electric field intensity in a plane coinciding with the tBuCN film surface, i.e. 40 nm above the Au disk. For this, we apply the Green Dyadic Method (GDM) to a 3D discretized model of the disk28 (Fig. 2e), and plot on Figure 2f the negative of the total electric field intensity (unity minus
the normalized field intensity) to facilitate the comparison with the AFM images. The experimental Figure 2c and computed Figure 2f nicely match. The intense central motif above the prism and the long-range oscillations of the molecular film are well reproduced in the near-field modulation. These oscillations of the optical contrast are created by the interference of the almost collimated incoming laser beam, which can be considered as a plane wave, and the electric field radiated by the excited plasmon modes of the particle. The intensity of the radiated field decreases rapidly with distance, therefore 500 nm away from the particle the optical contrast vanishes and the molecular film remains completely flat. Regarding the central pattern, both the inverted optical near-field and the AFM map show a central depletion surrounded by a circular ridge. The coincidence between the computed and photomigration data is illustrated in the horizontal cross-sections of Figure 2d where the central dip surrounded by the ridge as well as the interferential oscillation at the periphery occur at the same distance from the disk center. The most noticeable difference is observed in the relative amplitude of the central dip, which is much more pronounced in the experimental image. We attribute this to the finite amount of tBuCN molecules available in the central region which is entirely depleted towards the rim by the migration. Further minor
differences can be observed in the maps. Indeed, the ridge is slightly asymmetric and forms two crescents resulting from the circular symmetry broken by the incident linear excitation. However, the crescents are distributed horizontally on the computed map but vertically on the experimental imprint. This can be ascribed to two origins. First, the migration of the azo-derivative molecules is known to be significantly more sensitive along the excitation polarization directions.23, 30 This
implies a net molecular displacement along the vertical axis both above the prism and in the periphery. Second, in the presence of longitudinal fields, the photomigration is much more effective along the z-component of the electric field because the photoactive material is more easily displaced towards a free interface.31 Near planar plasmonic structures, such components are
present in the near-field, even in the case of normal plane-wave excitation.23 Moreover, it has been
reported that the longitudinal component of the electric field can play a dominant role in the surface deformation although one order of magnitude weaker than that of the transverse component.31 In
our case, the bottom-right inset of Fig 2f shows the z-component of the near-field which exhibits a contrasted top-bottom crescent dimer pattern that matches the AFM motif. This study demonstrates that the photomigration of a molecular azo thin film can easily resolve all the features of the local electric field intensity distribution at the molecular film altitude, since the smallest patterns 40 nm above the mesosized particle are not smaller than 150 nm.
Next, we proceed to the photochemical imaging of the near-field generated by Au prisms with a more complex shape. In Figure 3, we consider two equilateral triangular prisms, one with rounded apices and a side length of 550 nm (Fig. 3a) and another with snipped tips and a side length of 700 nm (Fig. 3d). The AFM images of the bare and pristine prisms show an atomically flat surface. After tBuCN film deposition and a 1-hour irradiation of the smaller prism at λexc = 457 nm,
observations, interference fringes are visible away from the particle edges. However, near the triangular particle, they follow a C3 symmetry also clearly visible in the corresponding simulated
near-field map (Fig. 3c). Directly above the particle, one can notice matter accumulation at the tips of the triangle, in close agreement with the three lobes observed on the computed map. Interestingly, the molecular displacement is more pronounced above the upper apex. This is directly linked to the incident polarization direction which strengthens the optical near-field on the lateral apices.6 When performing the same experiment with the larger triangular prism, the
peripheral fringes are also imprinted in the molecular film (Fig. 3e) but the pattern above the prism is quite different. Lobes are still present above the apices but they are better defined and do not overlap. More importantly, a pronounced depletion of 5 nm (ca. 10% of the film thickness) is observed at the center. We ascribe the difference of pattern between the prisms to their modal behavior. Indeed, due to their distinct sizes, the two gold particles support a different dominant surface plasmon mode at a given frequency9, which induces distinctive near-field imprints in the
photosensitive film. This is confirmed by the computed map corresponding to Fig 3e (see Figure S1 of the supplementary material). The resonant nature of the particles is further evidenced by Figure 3f, showing the photomigration map measured above the 700 nm large prism after tuning the wavelength of the laser beam to 514 nm and irradiating a freshly deposited tBuCN film for 1 hour. The experimental imprint exhibits a very similar pattern and therefore an identical near-field distribution to what was measured above the smaller prism at 457 nm, with diffuse lobes at the tips of the triangle and no depletion at the center. This confirms that the two structures do behave as resonant plasmon cavities and, having the same shapes, they support a self-similar collection of surface plasmon modes. As the triangle size is increased, one needs to increase the excitation wavelength to probe the similar mode distribution, as is observed when going from Figure 3b to
Figure 3f. We have shown that photomigration using molecular thin films made out of neat tBuCN is resolved enough to discriminate two different plasmonic modes (at the same wavelength) in two mesoscale 2D resonators of distinct sizes, as well as two modes sustained by the same structure when we probe it at two different wavelengths.
The minor differences observed between our model and the experiments come from the fundamental difference between the near-field spatial distribution and the photomigration process it generates. Here, we do not model the transduction phenomena between the optical near-field that triggers the photomigration and the steady-state molecular displacement observed by AFM. Such a model has been developed in the case of azo-grafted PMMA,32 and has been shown to be
mainly governed by the viscoelastic properties of the polymer. Here, there is no polymer and the viscoelastic properties of the pure molecular film are not known.
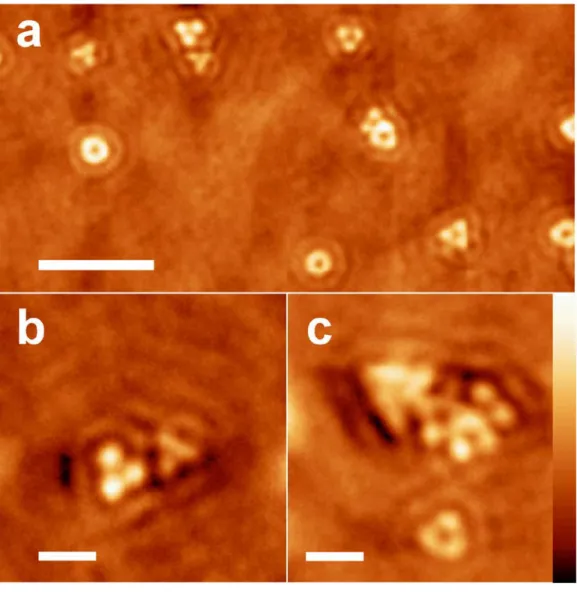
Our approach is generic and can be applied to ensembles of isolated particles (Fig 4a), dimers (Fig 4b) and complex aggregates of prisms (Fig. 4c). In particular, Figure 4a illustrates the potential of this technique to provide a large-scale imprint of the near-field distribution with a subwavelength resolution, and to easily differentiate plasmonic resonators of various sizes, shapes and orientations. In larger assemblies, the extent of the near-field plasmonic coupling between individual structures can be probed. For example, in Figure 4b, the two triangular prisms display the direct superposition of patterns examined in Figure 3, thus indicating that the two particles are too far from each other to show a coupled behavior. On the contrary, in the uppermost part of Figure 4c, a non-trivial imprinted pattern suggests that several prisms are aggregated together and generate a complex near-field intensity distribution. Although computing the near-field produced by dimeric aggregates has been demonstrated recently,33 the near-field generated by such extended
assemblies of plasmonic particles remains challenging and beyond currently available computation capabilities.
To conclude, a photoactive molecular probe based on a push-pull azo core has been engineered and used as a neat thin film to successfully image the local electric field distribution near gold platelets. This indirect mapping method evidences the modal behavior of the metallic particles and simultaneously discriminates high-order plasmon modes in prisms of assorted shapes. The acute sensitivity and spectral tunability of non-doped molecular azo thin films hold a potential for quantitative imaging of the optical near-field intensity with marked spatial distributions. To that end, the remaining challenge is to accurately model the transduction mechanisms that convert optical near-field variations into molecular visco-elastic movements. Nevertheless, the photochemical imaging approach demonstrated here would provide insights in the many current approaches aiming at engineering the spatial and spectral distributions of optical near-field such as optical data storage, functional metasurfaces or plasmonic circuitry. Moreover, the direct patterning of the optically active thin film by the plasmonic near-field results in a self-alignment of the molecular patterns with the optical hotspots, which could be a major asset for the integration of filtering or gain media near plasmon-enhanced devices like organic light-emitting diodes 34-35
Corresponding Author
*Correspondence should be addressed to A. T. ([email protected]) or E. D. ([email protected])
Present Addresses
§ School of Physics, University of Exeter, Stocker Road, Exeter, EX4 4QL, U.K.
¶ ICB, UMR 6303 CNRS – Université de Bourgogne Franche-Comté, Dijon, F-21078, FRANCE
‖ CNSNT, Panjab University, Chandigarh, India
Author Contributions
E.I. and E.D. designed the experiments. E.I. synthesized the molecular probe. J.S. produced the nanoplatelets. A.S. and A.T. prepared the samples, irradiated the samples and performed the AFM imaging. A.T. carried out the GDM calculations. All co-authors contributed to the data analysis and to the writing of the article.
Acknowledgement
E. D. acknowledges the support of the European Research Council (ERC) (contract number ERC–2007-StG Nr 203872 COMOSYEL) and of the Agence Nationale de la Recherche (ANR) (Contract ANR-13-BS10-0007-PlaCoRe). The authors thank Arnaud Arbouet for his advice in performing the samples irradiations and Christian Girard for his assistance in developing the GDM codes. A. T. thanks the CALMIP computing center for its support.
Figure 1. Photochemichal imaging process and tBuCN molecular probe. (a-b) Monochromatic
irradiation (a) and AFM imaging (b) of the sample. (c) Structure of tBuCN and UV-vis absorption spectrum of a tBuCN thin film (~200 nm) before irradiation (solid line) and at the photostationary state (PSS) right after irradiation at 488 nm (16 mW) (dotted line). Thermal back relaxation can be considered as negligible during spectrum recording since the major relaxation time constant was valued to be 260 min.25
Figure 2. Indirect mapping of plasmons supported by a nanodisk. (a-c) AFM images of the
nanostructure before (a) and after (b) deposition of the 50 nm-thin tBuCN film, and after irradiation at 457 nm with a vertical polarization (c). (d) Amplitude profiles along lines I and II in experimental AFM image (c) and computed map (f). (e-f) Representation of the discretized disc (e) (18469 discretization cells, hexagonal compact lattice) used for computing the negative total electric field intensity (f) and the intensity of the z-component of the electric field (f, inset) 40 nm above the particle. The double-headed arrows indicate the linear polarization direction of the impinging laser beam. All scale bars are 400nm.
Figure 3. Plasmon mapping using photochemical imaging of (a-c) a 550-nm and (d-f) a 700-nm
triangular nanoprisms. (a) Topographic AFM image of the smaller nanostructure. (b) AFM image of the photosensitive tBuCN film above the nanoprism after a 1-hour irradiation at 457nm. (c) Corresponding simulated map of the inverted near-field intensity using a discretized model of the prism shown in (a) (11161 discretization cells, hexagonal compact lattice). (d) Topographic AFM image of the larger nanostructure. (e-f) AFM images of the tBuCN film above the 700-nm wide nanoprism after a 1-hour irradiation at (e) 457nm and (f) 514nm. The double-headed arrows indicate the linear polarization direction of the impinging laser beam. All scale bars are 400nm.
Figure 4. (a) Low magnification photochemical image of a nanoprism assembly. (b, c) Close-up
photochemical images of the complex pattern produced by clusters of closed packed nanoprisms. In (b) a dimer of nanoprisms with different sizes showing the superposition of two modal patterns. In (c) a group of ca. seven nanoprisms generates a complex pattern in which the individual contributions are resolved by the near-field imaging technique. Scale bars 3000 nm (a) and 800 nm (b-c).
Supporting Information
References.
1. Schuller, J. A.; Barnard, E. S.; Cai, W. S.; Jun, Y. C.; White, J. S.; Brongersma, M. L., Plasmonics for Extreme Light Concentration and Manipulation. Nat. Mater. 2010, 9, 193-204. 2. Rotenberg, N.; Kuipers, L., Mapping Nanoscale Light Fields. Nat. Photonics 2014, 8, 919-926.
3. Bouhelier, A.; Bachelot, R.; Lerondel, G.; Kostcheev, S.; Royer, P.; Wiederrecht, G. P., Surface Plasmon Characteristics of Tunable Photoluminescence in Single Gold Nanorods. Phys.
Rev. Lett. 2005, 95, 267405.
4. Hubert, C.; Billot, L.; Adam, P. M.; Bachelot, R.; Royer, P.; Grand, J.; Gindre, D.; Dorkenoo, K. D.; Fort, A., Role of Surface Plasmon in Second Harmonic Generation from Gold Nanorods. Appl. Phys. Lett. 2007, 90, 181105.
5. Ghenuche, P.; Cherukulappurath, S.; Taminiau, T. H.; van Hulst, N. F.; Quidant, R., Spectroscopic Mode Mapping of Resonant Plasmon Nanoantennas. Phys. Rev. Lett. 2008, 101, 116805.
6. Viarbitskaya, S.; Teulle, A.; Marty, R.; Sharma, J.; Girard, C.; Arbouet, A.; Dujardin, E., Tailoring and Imaging the Plasmonic Local Density of States in Crystalline Nanoprisms. Nat.
Mater. 2013, 12, 426-432.
7. Bosman, M.; Keast, V. J.; Watanabe, M.; Maaroof, A. I.; Cortie, M. B., Mapping Surface Plasmons at the Nanometre Scale with an Electron Beam. Nanotechnology 2007, 18, 165505. 8. Nelayah, J.; Kociak, M.; Stephan, O.; de Abajo, F. J. G.; Tence, M.; Henrard, L.; Taverna, D.; Pastoriza-Santos, I.; Liz-Marzan, L. M.; Colliex, C., Mapping Surface Plasmons on a Single Metallic Nanoparticle. Nat. Phys. 2007, 3, 348-353.
9. Gu, L.; Sigle, W.; Koch, C. T.; Oeguet, B.; van Aken, P. A.; Talebi, N.; Vogelgesang, R.; Mu, J.; Wen, X.; Mao, J., Resonant Wedge-Plasmon Modes in Single-Crystalline Gold Nanoplatelets. Physical Review B 2011, 83, 195433.
10. Yamamoto, N.; Araya, K.; de Abajo, F. J. G., Photon Emission from Silver Particles Induced by a High-Energy Electron Beam. Physical Review B 2001, 64, 205419.
11. Gomez-Medina, R.; Yamamoto, N.; Nakano, M.; Abajo, F. J. G., Mapping Plasmons in Nanoantennas Via Cathodoluminescence. New J. Phys. 2008, 10, 105009.
12. Coenen, T.; Vesseur, E. J. R.; Polman, A., Deep Subwavelength Spatial Characterization of Angular Emission from Single-Crystal Au Plasmonic Ridge Nanoantennas. ACS Nano 2012, 6, 1742-1750.
13. Das, P.; Chini, T. K.; Pond, J., Probing Higher Order Surface Plasmon Modes on Individual Truncated Tetrahedral Gold Nanoparticle Using Cathodoluminescence Imaging and Spectroscopy Combined with Fdtd Simulations. J. Phys. Chem. C 2012, 116, 15610-15619.
14. Awada, C.; Popescu, T.; Douillard, L.; Charra, F.; Perron, A.; Yockell-Lelievre, H.; Baudrion, A. L.; Adam, P. M.; Bachelot, R., Selective Excitation of Plasmon Resonances of Single Au Triangles by Polarization-Dependent Light Excitation. J. Phys. Chem. C 2012, 116, 14591-14598.
15. Murazawa, N.; Ueno, K.; Mizeikis, V.; Juodkazis, S.; Misawa, H., Spatially Selective Nonlinear Photopolymerization Induced by the near-Field of Surface Plasmons Localized on Rectangular Gold Nanorods. J. Phys. Chem. C 2009, 113, 1147-1149.
16. Volpe, G.; Noack, M.; Acimovic, S. S.; Reinhardt, C.; Quidant, R., Near-Field Mapping of Plasmonic Antennas by Multiphoton Absorption in Poly(Methyl Methacrylate). Nano Lett. 2012,
17. Deeb, C., et al., Quantitative Analysis of Localized Surface Plasmons Based on Molecular Probing. ACS Nano 2010, 4, 4579-4586.
18. Hubert, C., et al., Near-Field Photochemical Imaging of Noble Metal Nanostructures. Nano
Lett. 2005, 5, 615-619.
19. Galarreta, B. C.; Rupar, I.; Young, A.; Lagugne-Labarthet, F., Mapping Hot-Spots in Hexagonal Arrays of Metallic Nanotriangles with Azobenzene Polymer Thin Films. J. Phys.
Chem. C 2011, 115, 15318-15323.
20. Rochon, P.; Batalla, E.; Natansohn, A., Optically Induced Surface Gratings on Azoaromatic Polymer-Films. Appl. Phys. Lett. 1995, 66, 136-138.
21. Kim, D. Y.; Tripathy, S. K.; Li, L.; Kumar, J., Laser-Induced Holographic Surface-Relief Gratings on Nonlinear-Optical Polymer-Films. Appl. Phys. Lett. 1995, 66, 1166-1168.
22. Viswanathan, N. K.; Kim, D. Y.; Bian, S. P.; Williams, J.; Liu, W.; Li, L.; Samuelson, L.; Kumar, J.; Tripathy, S. K., Surface Relief Structures on Azo Polymer Films. J. Mater. Chem. 1999,
9, 1941-1955.
23. Hubert, C., et al., Near-Field Polarization Effects in Molecular-Motion-Induced Photochemical Imaging. J. Phys. Chem. C 2008, 112, 4111-4116.
24. Viarbitskaya, S.; Teulle, A.; Cuche, A.; Sharma, J.; Girard, C.; Dujardin, E.; Arbouet, A., Morphology-Induced Redistribution of Surface Plasmon Modes in Two-Dimensional Crystalline Gold Platelets. Appl. Phys. Lett. 2013, 103, 131112.
25. Ishow, E.; Camacho-Aguilera, R.; Guerin, J.; Brosseau, A.; Nakatani, K., Spontaneous Formation of Complex Periodic Superstructures under High Interferential Illumination of Small-Molecule-Based Photochromic Materials. Adv. Funct. Mater. 2009, 19, 796-804.
26. Horcas, I.; Fernandez, R.; Gomez-Rodriguez, J. M.; Colchero, J.; Gomez-Herrero, J.; Baro, A. M., Wsxm: A Software for Scanning Probe Microscopy and a Tool for Nanotechnology. Rev.
Sci. Instrum. 2007, 78, 013705.
27. Martin, O. J. F.; Girard, C.; Dereux, A., Generalized Field Propagator for Electromagnetic Scattering and Light Confinement. Phys. Rev. Lett. 1995, 74, 526-529.
28. Girard, C.; Dujardin, E.; Baffou, G.; Quidant, R., Shaping and Manipulation of Light Fields with Bottom-up Plasmonic Structures. New J. Phys. 2008, 10, 105016.
29. Ishow, E.; Lebon, B.; He, Y. N.; Wang, X. G.; Bouteiller, L.; Galmiche, L.; Nakatani, K., Structural and Photoisomerization Cross Studies of Polar Photochromic Monomeric Glasses Forming Surface Relief Gratings. Chem. Mat. 2006, 18, 1261-1267.
30. Ishitobi, H.; Tanabe, M.; Sekkat, Z.; Kawata, S., The Anisotropic Nanomovement of Azo-Polymers. Opt. Express 2007, 15, 652-659.
31. Gilbert, Y.; Bachelot, R.; Royer, P.; Bouhelier, A.; Wiederrecht, G. P.; Novotny, L., Longitudinal Anisotropy of the Photoinduced Molecular Migration in Azobenzene Polymer Films.
Opt. Lett. 2006, 31, 613-615.
32. Juan, M. L.; Plain, J.; Bachelot, R.; Royer, P.; Gray, S. K.; Wiederrecht, G. P., Self-Consistent Model of Light-Induced Molecular Motion around Metallic Nanostructures. J. Phys.
Chem. Lett. 2010, 1, 2228-2232.
33. Cuche, A.; Viarbitskaya, S.; Kumar, U.; Sharma, J.; Arbouet, A.; Girard, C.; Dujardin, E., Beyond Dipolar Regime in High-Order Plasmon Mode Bowtie Antennas. Opt. Commun. 2017,
387, 48-54.
34. Fukuura, T., Plasmons Excited in a Large Dense Silver Nanoparticle Layer Enhance the Luminescence Intensity of Organic Light Emitting Diodes. Appl. Surf. Sci. 2015, 346, 451-457.
35. Garcia, R. F.; Zeng, L.; Khadir, S.; Chakaroun, M.; Fischer, A. P. A.; Boudrioua, A., Enhanced Electroluminescence of an Organic Light-Emitting Diode by Localized Surface Plasmon Using Al Periodic Structure. J. Opt. Soc. Am. B-Opt. Phys. 2016, 33, 246-252.
36. Yang, A. K.; Hoang, T. B.; Dridi, M.; Deeb, C.; Mikkelsen, M. H.; Schatz, G. C.; Odom, T. W., Real-Time Tunable Lasing from Plasmonic Nanocavity Arrays. Nat. Commun. 2015, 6, 6939.
Table of Content synopsis.
The optical near-field produced by higher order plasmon modes in 2D gold crystals is imaged with sub-wavelength resolution by the photo-induced deformation of a neat molecular thin film.
Photochemical Mapping of the Multimodal
Plasmonic Response of 2D Gold Crystals
Alexandre Teulle*, Audrey Sanchot, Eléna Ishow, Jadab Sharma, and Erik Dujardin*
CEMES CNRS UPR 8011, 29 rue Jeanne Marvig, 31055 Toulouse Cedex 4, France and CEISAM—UMR CNRS 6230, Université de Nantes, 2 rue de la Houssinière, 44322 Nantes, France.
1. Computation of the near-field intensity distribution above a
700-nm prism
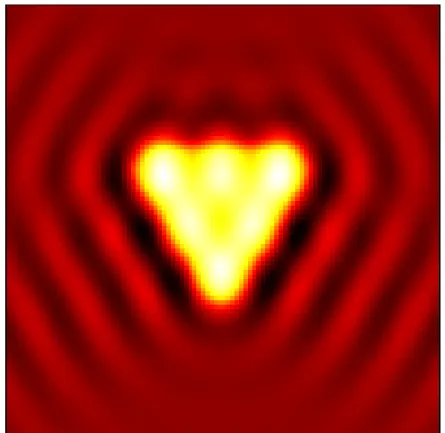
Figure S1. Simulated map of the near-field intensity using a discretized model of the prism shown in Fig 3d of the main text. The excitation wavelength is 457 nm and the polarization is vertical. The computing window is 2 µm x 2 µm.
In Figure S1, we have calculated the negative of the near-field intensity distribution (unity minus the normalized field intensity) of the 700-nm prism presented in Figure 3d of the main text, and corresponding to the photomigration map in Figure 3e. The computed near-field patterns nicely match the photomigration, with pronounced lobes at the prism extremities, smaller protuberances in the middle of each edge of the triangle, and a depletion in the centre of the particle. This computed map, along with Fig 3b, 3c and 3e demonstrates that our photomigration method can discriminate two different plasmonic modes (at the same wavelength) in two structures of distinct sizes.