Publisher’s version / Version de l'éditeur:
Canadian Journal of Earth Sciences, 1, 2, pp. 146-157, 1964-11-01
READ THESE TERMS AND CONDITIONS CAREFULLY BEFORE USING THIS WEBSITE. https://nrc-publications.canada.ca/eng/copyright
Vous avez des questions? Nous pouvons vous aider. Pour communiquer directement avec un auteur, consultez la
première page de la revue dans laquelle son article a été publié afin de trouver ses coordonnées. Si vous n’arrivez pas à les repérer, communiquez avec nous à PublicationsArchive-ArchivesPublications@nrc-cnrc.gc.ca.
Questions? Contact the NRC Publications Archive team at
PublicationsArchive-ArchivesPublications@nrc-cnrc.gc.ca. If you wish to email the authors directly, please see the first page of the publication for their contact information.
NRC Publications Archive
Archives des publications du CNRC
This publication could be one of several versions: author’s original, accepted manuscript or the publisher’s version. / La version de cette publication peut être l’une des suivantes : la version prépublication de l’auteur, la version acceptée du manuscrit ou la version de l’éditeur.
For the publisher’s version, please access the DOI link below./ Pour consulter la version de l’éditeur, utilisez le lien DOI ci-dessous.
https://doi.org/10.1139/e64-008
Access and use of this website and the material on it are subject to the Terms and Conditions set forth at
Analysis of annual variations in ground temperature at an Ottawa site
Gold, L. W.
https://publications-cnrc.canada.ca/fra/droits
L’accès à ce site Web et l’utilisation de son contenu sont assujettis aux conditions présentées dans le site LISEZ CES CONDITIONS ATTENTIVEMENT AVANT D’UTILISER CE SITE WEB.
NRC Publications Record / Notice d'Archives des publications de CNRC:
https://nrc-publications.canada.ca/eng/view/object/?id=e10881d8-037b-4553-a1ad-10741c0cd2b8 https://publications-cnrc.canada.ca/fra/voir/objet/?id=e10881d8-037b-4553-a1ad-10741c0cd2b8ANALYSIS OF ANNUAL VARIATIONS I N GROUND TEMPERATURE AT AN OTTAWA SITE
ANALYSIS OF ANNUAL VARIATIONS IN GROUND TEMPERATURE AT AN OTTAWA SITE1
L. W . GOLD
Divisiox of Building Research, Nalional Research Coz~nG2'1, OLlawa, Ca?zada
Received February 12, 1964
ABSTRACT
Observations over a 5-year period a t a site a t Ottawa showed t h a t the ground temperature had significant Fourier components with period Q a n d 2 years. The average annual ground temperature a n d amplitudes of t h e Fourier components of period 1 year and 4 year underwent non-periodic fluctuations of almost 1 C
degree a t a depth of 10 cm. 'The amplitude of this fluctuation decreased with depth, and its maximum occurred later in time. There was evidence of a gradual increase in average annual ground t e m p e r a t ~ ~ r e amounting t o about 0.2 C degree over the 5-year period a t the 610-cm depth. The significance of such small temperature changes in areas where the ground te~uperature is close to 0 OC is pointed out.
INTRODUCTION
The temperature of the ground near the surface undergoes fluctuations in response t o changes in the heat transfer processes a t the surface. T h e major fluctuation in ground tenlperature has a period of 1 year, corresponding to the annual variation in solar radiation. There is also a significant diurnal component corresponding to the daily variation in radiation. Superimposed on periodic fluctuations are non-periodic fluctuations whose duration covers the time range of seconds to years. The non-periodic changes can have a variety of causes such as sporadic cloud cover, and changes in weather and climate.
During the 5-year period, 1 Nov. 1957 t o 31 Oct. 1962, observations were made on ground tenlperature a t a site in Ottawa, Canada, t o a depth of 610 cm. These observations were analyzed to determine the average annual temperature and the Fourier components of period 1,
3,
and 2 years, and the non-periodic fluctuations that occurred in these quantities. The results of this analysis are presented in this paper. T h e significance of the non-periodic fluctuations with respect to the ground thermal regime and observations of it are discussed briefly.INSTALLATION
All measurements were made with No. 20 gauge copper-constantan thermo- couples located in a sensitive nzarine clay a t least 10 111 deep overlying lime-
stone forinations. The surface cover in summer was natural grass that was allowed to grow to a height of between 15 and 20 cm before cutting. Tempera- tures were recorded once every 20 min on a 16-point Leeds and Northrup recorder located in an instrument tunnel about 46 m (150 ft) from the ground tenlperature installation.
Temperatures were measured a t two adjacent installations. At one, installed in 1956, the ther~i~ocouples were placed in duraluminum tubes and inserted illto the vertical face of a pit a t various levels down t o 90 c111 below the surface.
'Issued a s N.R.C. No. 8107.
Canadian Journal of Earth Scieuces. Volulne 1 (1964)
GOLD: G R O U N D T E M P E R A T U R E 147 A description of this installation, together with solne results fro111 observations taken during the first year, is given by Pearce and Gold (1939). Temperatures measured a t depths of 10, 40, and 90 crn were analyzed.
For the second installation, the thermocouples were placed in a groove 1 in sq. cut into a 3- by 3-in pine pole about 20 ft long. T h e tl~er~nocouples were brought to the surface of the pole a t appropriate locations, the groove filled with a plastic and capped with a piece of 1- by 3-in pine. At each thermocouple location a groove was cut circulufereiltially about the pole and the thermo- couple wound into it and sealed in place. The pole was painted with a preser- vative and installed in a hole drilled about 6 months earlier. Temperatures measured 213 cnl (7 ft), 366 cin (12 ft), and 610 cm (20 ft) below the surface were analyzed.
ANALYSIS OF OBSERVATIONS
The technique of Fourier analyses is usually used in studies of ground tem- peratures. The dependence of temperature on depth and time is assumed t o satisfy simple diffusion theory and to be given by a series of the form
T(z, t) = To
+
C,T, exp [ - .\/(nwz2/2X)] sin [nwt+
6, - .\/(nwz2/2X)] whereT(z, t) is the temperature a t depth z and time t,
To is the average temperature a t depth z , which for this study was the
average annual temperature,
Tn
is the alnplitude a t the soil surface of the Fourier component having ncomplete cycles in a given period, w is the angular frequency,
is the thermal diffusivity of the soil, t is the time,
6, is the phase angle for the nth Fourier component.
A program was available for the Bendix G-1SD computer with which the average annual temperature and Fourier components could be calculated from average daily temperatures (Stephenson 1960). The program required that the observations be grouped into blocl<s containing 50 average daily temperatures each in chronological order. AS 15 days of observations distributed uniformly throughout the year were rejected, there were seven blocks of observations for each 1-year period. The average daily temperature 10 cm below the surface was assumed to be equal to the mean of the daily maximum and minimum. At the other depths the temperature changed so slowly that the daily average could be read directly from the recorder charts.
The computer was programmed to determine the average annual tem- perature, and amplitude and phase of the specified Fourier conlponents for consecutive periods of 1 year (2 years for the Fourier component with period of 2 years). Each 1-year period overlapped the previously analyzed period b y 6/7 year and included 1/7 year of new observations. The analysis for the 5-year period, therefore, gave 29 consecutive values of average annual tempera- ture and Fourier components with period of
4 and 1 year and 22 values for the
component of period 2 years.148 C A N A D I A N JOURNAL O F EARTH SCIENCES. VOL. 1. 19(i4
One disturbing fact arose during the plotting of profiles of average annual ground temperature: a discontinuity was present between the profiles obtained froin the shallow installation and those from the deep one. Temperatures were also measured a t the 76- and 107-cm depths a t the deep installation, and there the average annual temperatures were continuous with the deeper values. When profiles were plotted of average daily temperature it was found that for the months of July to December, inclusive, the profiles obtained from the deep installation were consistent with those obtained froin the shallow instal- lation. For the months of January t o June, inclusive, the temperatures meas- ured a t the 76- and 107-cn~ depths were usually 0.2 t o 0.8 C degrees warmer than those measured a t the same depth a t the shallow installation.
There was no obvious reason why temperatures measured a t t h e same depth in winter a t the two installations should be different. The distance between them was only about 4 m and the snow cover a t the site was quite uniform. I t is possible that the rise in the groundwater table t h a t occurs in winter could have an effect, particularly if there was poor contact between the deep hole probe and the walls of the hole. Conduction of heat u p or down the probe appears to be ruled out because the two installations gave consistent readings in summer. In this regard, a study b y Brown (1963) indicates t h a t , for depths greater than 1 rn, errors due to heat conduction along the probe should be negligible in the present circumstance.
Because the probes in the shallow installation were inserted horizontally into undisturbed soil, it was assumed t h a t temperatures measured b y them were correct. I t was also assumed t h a t the temperature measured a t the 610-cm depth a t the deep installation was correct; that the temperature measured 213 cm below the surface was in error by a n amount equal to that of the 100-cm depth, as shown by profiles of average daily temperature; and that the temperature measured 366 cm below the surface was in error by one- half this amount. T h e average annual temperatures for these depths were adjusted according t o this assumption. This adjustment was not made for t h e calculation of the Fourier components.
PRESENTATION O F RESUL'TS
Average Annual T e m p e r a t ~ i r e s
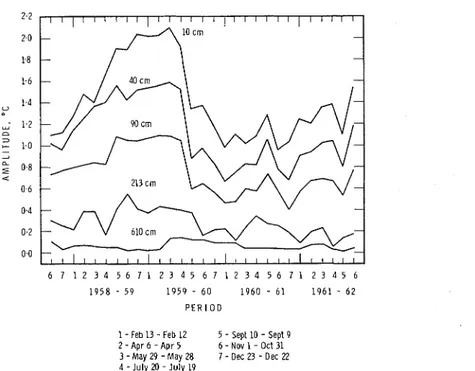
Figure 1 shows the dependence on time of the average annual temperatures for each depth. A marked fluctuation is present that has a period of about
2 years and an amplitude a t the 10-cm depth of almost 1 C degree. T h e ampli-
tude of this fluctuation decreases and the date a t which it is a maximum occurs later with increasing depth. For example, the amplitude of the fluctuation a t the 610-crn depth (20 ft) was aImost 0.2 C degree, and its maximum value occurred about 3/4 of a year later than a t the 10-cm depth.
Profiles of the modified average annual temperature for the period 1 Novem- ber t o 31 October are given for the five years in Fig. 2 as well a s the average temperature profile for the 5-year period. I t appears t h a t the modified annual averages for the 213- and 366-cm depths are still not consistent with those
GOLD: GROUND T E M P E R A T U R E
FIG.
t o Oct.
1 - Feb 13 - Feb 12 5 - Sept 10 - Sept 9 2 - Apr 6 - Apr 5 6 - Nov 1
-
0ct 31 3 - May 29 - May 28 7 - Dec 23 - Dec 224 - J u l y 20 - J u l y 19
1. Change
31/62.
with time in the average ground temperature for period N o v .
for shallower depths. Some of this apparent distortion is due to t h e phase change t h a t occurs with depth in the fluctuation in the average annual tem- perature. For example, the decrease in the average annual temperature t h a t is apparent a t the 10-cm depth a t the end of the 1961-1962 period had only propagated to about the 2-nl depth for the 1 November to 31 October calcul a t' lon.
Fourier Component of Period 1 Year
Figure 3 shows for each depth the amplitude of the Fourier component of period 1 year. A fluctuation is present t h a t corresponds to t h a t associated with the average annual temperatures. The amplitude of the fluctuation is about 1.5 C degree a t the 10-cm depth and decreases to almost zero a t the 610-cm depth. In Fig. 4 the logarithms of the amplitudes calculated from the 5-year
CANADIAN JOURNAL O F E A R T H SCIENCES. VOL. 1. 196-1 -
-
- 0 1957-
5 8 1 9 5 8-
5 9 1 9 5 9-
6 0 - A 1 9 6 0 - 6 1-
0 1 9 6 1-
6 2---
5 Year Average-
-
-
1 1 1 1 1 1 1 1 1 1 1 1 1 8.0 8.5 9 . 0 AVERAGE A N N U A L TEMPERATURE, "CFIG. 2. Average annual g r o ~ ~ n d temperature for period Nov. I to Oct. 31.
P E R I O D
1 - Feb 13 - Feb 12 5 - Sepl 10 - Sept 9 2 - Apr 6 - Apr 5 6 - Nov 1 - 0ct 31 3 -May 29 - May 28 7 - Dec 23
-
Dec 224 - J u l y M - July 19
GOLD: GROUND TEMPERATURE 151
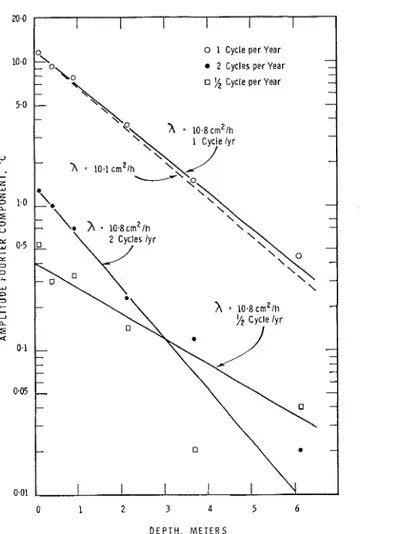
sums for the sine and cosine products are plotted against depth. According t o diffusion theory, if the soil is behaving as an ideal, semi-infinite medium for a harmonic disturbance of period 1 year, the points should lie along a straight line. This is observed to occur, except for small deviations a t the 40- and 610-cm depths. The thermal diffusivity of the soil can be calculated from the slope of the line and was found to be 10.8 cn12/h, in good agreement with t h e value observed by Pearce and Gold (1959) for the same site.
The phase angle was found to be constant a t each depth and fluctuations that did occur increased with depth. The 5-year and extreme values for t h e phase are given in Table I. In Fig. 5 the value obtained from the 5-year sums
TABLE I
Five-year average a n d extremes of phase angles for Fourier cormponents of period 1 year and
+
yearPhase angle ill degrees
-
1 year 3 year
5-year 5-year
Depth value Extremes value Extremes
for the sine and cosine products are plotted against depth. As for the logarithm of the amplitudes, the plotted points should lie along a straight line if diffusion theory is valid. In the present case, the phases a t the 40- and 366-cm depth deviate slightly from a straight line. The diffusivity obtained from the slope of the line is 10.1 cm2/h, which is about 7% lower than that obtained fro111 t h e amplitudes.
Fourier Component of Period
+
YearFigure G shows the time-dependence of the Fourier component of period
+
year. The amplitude of this conlponent a t the 10-cm depth, about 1 C degree, is roughly l/lOth the amplitude of the conlponent of period 1 year, and the fluctuations that occur in it are similar to those that occurred in the average annual temperature.In Figs. 4 and 5 are plotted the phase and logarithm of the average amplitudes calculated from the 5-year sums for the sine and cosine products. Lines corre- sponding to a diffusivity of 10.8 cm2/h for the logarithm of the amplitude and 10.1 cm2/h for the phase are drawn through the points. I t is of interest t h a t the respective lines fit the plotted points satisfactorily for the shallow installa- tion but significant deviations occur in the results fro111 the deep hole site, particularly for the phase. The deviation in the phase shift a t the 213- a n d 366-cm depths are consistent with the suggested possible influence of ground-
CANADIAN JOURNAL OF EARTH SCIENCES. VOL. 1. 1964
20.0 I I I I I I
o 0 1 Cycle per Year
-
2 Cycles per Year -
-
% Cycle per Year -
-
- --
-
r\ = 10.8crn21h --
-
-
- - - - - - 0.01 0 1 2 3 4 5 6 D E P T H . M E T E R SFIG. 4. Dependence on depth of the logarithms of theamplitudes of the Fourier components.
water during the winter period. The 5-year and extreme values for t h e phase are given in Table I.
Fourier Component w i t h Period of 2 Y e a r s
Amplitudes and phases of Fourier components with period of 2 years were determined from the observations. The change in the amplitude with time is shown in Fig. 7 for the lo-, 213-, 366-, and 610-cm depths and the amplitude and phase, calculated from the sunls of the sine and cosine products for the 4-year period, 1 November 1957 to 31 October 1961, are shown in Figs. 4 and
5, respectively. The lines obtained using the diffusivities
X
= 10.8 cm2/h for the amplitude andX
= 10.1 cn12/h for the phase are also shown. The plotted lines are consistent with the observations to about the 2-m depth, and signifi- cant deviations occur a t greater depth.GOLD: GROUND TEMPERATURE
D E P T H . METERS
FIG. 5. Dependence on depth of t h e phase of the Fourier components.
DISCUSSION
Ground temperatures are necessary information for much agricultural and engineering activity, as well a s for the definition of t h e lower boundary con- ditions of the atmosphere. Because of its harmonic character, a useful descrip- tion of ground temperature can often be obtained by simple Fourier analysis. In the present study, attention was directed t o the annual temperature wave a t a particular site and t o its Fourier components of period $, 1, and 2 years.
In Fig. 8 are plotted average monthly values of ground temperature a t t h e 10-cnl depth for the 5-year period. Although t h e Fourier component of period 1 year is a reasonable approximation of the observations, it gives temperatures that are too low in winter and too high in spring and fall. A study by Gold (1963) of factors influencing t h e temperature a t the 10-cm depth had shown that snow cover was the cause of the flattened portion of the temperature curve in winter. I t would be expected that this influence would induce a
CAWADIAN JOURNAL O F E A R T H SCIENCES. VOL. 1. 1964
6 7 1 2 3 4 5 6 7 1 2 3 4 5 6 7 1 2 3 4 5 6 7 1 2 3 4 5 6 1 9 5 8 - 5 9 1 9 5 9 - 6 0 1 9 6 0 - 6 1 1 9 6 1 - 6 2
P E R I O D
1 - Feb 13 - Feb 12 5 - Sept 10 - Sept 9 2 - Apr 6 - Apr 5 6 - Nov 1 - 0 c t 31 3 - May 29 -May 28 7 - Dec 23 - Dec 22
4 - J u l y 20 - J u l y 19
FIG. 6. Change with time in the anlplitude of Fourier co~nponent of period 3 year.
PER l OD
1 - Feh 13 - Feb 12 5 - Sept 10 - Sept 9 2
-
Apr 6 - Apr 5 6 - Nov 1 - Oct 31 3 -May 29 - May 28 7 - Dec 23 - Dec 22 4 - J u l y 20 - J u l y 19GOLD: GROUND TEMPERATURE 1.55 -6 N o v D e c J a n Feb M a r A p r M a y J u n e J u l y A u g S e p t O c l T I M E I I I I I I I I I I - - -
Period One Year Fourier Component with
- -
Fourier Component with Period One-half Year
-
5 Year Average lor Each
- Block of Observations T l o = 8.45 t 11.7 Sin (wt - 176'1 - t l . 4 Sin ( 2 w t - 69'1 - -
Approximate Period of Snow Cover
-
FIG. 8. Five-year average temperature, Fourier components with period 1 year and 4 year,
and their sum for t h e 10 cm depth.
Fourier component of period
3
year, but since it is present only in winter, t h e component calculated from the observations overcorrected the first Fourier component approxinlation in summer, as shown in Fig. 8. A better measure of the influence of snow cover would probably have been the Fourier colnponent of period+
year calculated froin observations made in the winter period only (i.e. about 1 November t o 30 April).I t would have been possible t o determine the arnplitudes and phases of t h e additional Fourier components required to yield an accurate analytical expres- sion for the an~lual ground temperature, as was done by Carson (1983) for average monthly ground temperatures a t Argonne, Illinois. I t was considered, however, that these components would have limited physical significance in the present case in comparison with the components of period
3 and 1 year,
their main contribution probably being t o adjust for the overcorrection ill sunliner caused by the calculated Fourier coinponent with period3
year.A change in average annual ground temperature or amplitudes of the Fourier components indicates a difference between the suills for the new 1/7 year of observations in ;1 calculation and those for the corresponding period 1 year earlier. For example, the increase in the amplitude of the Fourier component associated with point 4, 1958-1959 (Fig. 3), was caused by an increase in ground temperatures during the period 29 i\Iay to 19 July 1959, over those for the corresponding period in 1958. An earlier study showed that the fluctua- tions in the average annual ground temperature a t the 10-cm depth correlated
156 CANADIAN JOURNAL O F EARTH SCIENCES. VOL. 1. lS(i4
qualitatively with year-to-year fluctuations in average snow depth and average summer air teinperature (Gold 1963). This correlation, as well as the decrease in amplitude and shift in phase with depth, shows that the non-periodic fluctuations in the average annual ground teinperature and in the amplitudes of the Fourier colnponents are due to real fluctuations in the ground thermal regime, and not to the characteristics of the recording apparatus. In the present case, the fluctuations induced had a period of about 2 years during the 5 years of observations as shown by calculation of the Fourier conlponents, but this periodicity is probably fortuitous.
The observations a t the 610-cm depth indicate a gradual warming of the soil amounting t o about 0.2 C degree in 5 years, suggesting the possibility of a fluctuation with a period of several years. T h e observed small decrease with depth of about 3.0 X lop4 "C/cm in the &year average tenlperature shown i n Fig. 2 supports this possibility. I t is not considered that the unexplained behavior a t the 210- and 366-cm depths is responsible for the gradual increase, a s it should have an influence similar t o that of snow cover. T h e gradual in- crease could be due t o a systematic error in the observations, b u t this is considered ilnprobable.
I t is of interest that there is a small discrepancy between the diffusivity calculated from the change with depth of the phase a n d of the logarithln of the amplitudes. T h e discrepancy is such that the phase is retarded more than would be expected from the amplitude change. This is shown by the broken lines in Figs. 4 a n d 5 ; these correspond t o diffusivities of 10.1 and 10.8 cmyh, respectively. A difference between t h e diffusivities calculated by the two methods indicates that the observations do not coinpletely satisfy the assump- tions underlying the simple theory. This inay be because the therinal conducti- vity, specific heat, and density of the soil are not independent of depth or time, and that inathelllatical models such as t h a t given by Lettau (1954) are required for an accurate analysis. For calculations under the variable conditions encountered in the field, the inzplications of a discrepancy of 77, in the diffusivities can usually be ignored, however, and simple theory assumed valid. The non-periodic fluctuations in the annual ground temperature and amplitude of Fourier components of period
4
and 1 year are caused primarily by variations that occur fro111 year t o year in t h e heat transferred between the soil surface and the atmosphere, with a possible contribution from variations in the therinal properties of the soil. If it is assumed that the soil thermal properties determined for the site by Pearce and Gold (1959) are constant, the fluctuation of about 1 C degree a t the 10-cm depth in the average annual ground temperature and Fourier coinponent of period 1 year corresponds t o a change in total heat content of the ground of less t h a n 400 cal/cm" which is about 20y0 of the net heat flow into the ground and about 1% of the net radiation absorbed by the ground surface during the period 1 April to 30 September. T h e gradient of 3.0 Xlop4
"C/cm in the average annual ground temperature corresponds to a n annual heat flux into the ground of about 20 cal/cm2 year, of the saine order a s the heat flow associated with the geothermal gradient.GOLD: G R O U N D TEMPERATCRE 157
Such sniall changes and fluctuations in the ground thermal regime would n o t have a significant effect on soil properties in many areas. In areas where t h e average annual ground temperature is close t o 0 "C, however, they could result in the progressive freezing or thawing of soil water. I n such circun~stances, the effective thermal diffusivity would be considerably larger than that for t h e Ottawa site, and consequently fluctuations of period about 2 years would be confined t o a shallower depth. A fluctuation of period of several years, however, would propagate to an appreciable depth and could result in the degradation or formation of perinafrost. Such an occurrence would be of considerable practical significance a t many locations.
CONCLUSIONS
The ground temperatures observed a t the site in Ottawa had significant Fourier components with period of
3 and 2 years. The average annual ground
temperatures and ainplitudes of the Fourier components of period 1 year a n d3 year underwent non-periodic fluctuations of about 1
C degree a t the 10-cm level. These fluctuations decreased with depth, and had an amplitude of about 0.2 C degree 6 n~ below the surface. There was evidence of a gradual increase in average annual ground temperature of about 0.2 C degree in the 5-year period a t the 610-crn depth. I t is possible that groundwater influenced t h e observations made a t the deep installation.ACKNOWLEDGMENTS
The author gratefully acknowledges the assistance of his technical and sum- mer assistants, who contributed to this study on ground temperatures. H e is also indebted t o his colleagues Dr. D. G. Stephenson and Mr. G. P. Mitalas for their assistance in analyzing the observations with the G-15 con~puter. This paper is a contribution from the Division of Building Research of t h e National Research Council, Canada, and is published with the approval of the Director of the Division.
REFERENCES
BROWN, W. G. 1963. Thermal model tests for probe conduction errors in ground-teni-
perature measurement. Geotechnique, 13 (3), 241.
CARSON, J. E. 1963. Analysis of soil and air temperatures by Fourier techniques. J. Geophys. Res. 68(8), 2217.
GOLD, L. W. 1963. Influence of the snow cover on the average annual ground temperature
a t Ottawa, Canada. Intern. Assoc. Sci. Hydrology, Publ. No. 61, pp. 82-91.
LETTAU, H. H. 1954. Improved models of thermal diffusion in the soil. Trans. Am. Geophys.
Union, 35(1), 121.
PEARCB, D. C. and GOLD, L,. W. 1959. Observations of ground temperature and heat flow
a t Ottawa, Canada. J. Geophys. Res. 64(9), 1293.
STEPHENSON, D. G. 1960. A machine language program for harmonic analysis with Bendix
G-15D computer. Natl. Res. Council Canada, Div. Building Res. Cornputer Program No. 1.