SÉRIE ÉTUDES ET DOCUMENTS
Does fiscal adjustment affect income inequality? A new evidence of
WAEMU countries
Mohamed Traoré Zié Ballo
Études et Documents n° 16
November 2018
To cite this document:
Traoré M., Ballo Z. (2018) “Does fiscal adjustment affect income inequality? A new evidence of WAEMU countries”, Études et Documents, n° 16, CERDI.
CERDI POLE TERTIAIRE 26 AVENUE LÉON BLUM F- 63000 CLERMONT FERRAND TEL.+33473177400 FAX +33473177428 http://cerdi.uca.fr/
2
The authors
Mohamed Traoré
PhD Student in Economics.
École d’économie and Centre d’études et de recherches sur le développement international - Université Clermont Auvergne, CNRS, IRD, CERDI, F-63000 Clermont-Ferrand, France.
Email address: mohamed.traore@etu.uca.fr
Zié Ballo
Professor, University of Félix Houphouët Boigny, Abidjan, Côte d’Ivoire. Email address: zieballo@hotmail.com
Corresponding author: Mohamed Traoré.
This work was supported by the LABEX IDGM+ (ANR-10-LABX-14-01) within the program “Investissements d’Avenir” operated by the French National Research Agency (ANR).
Études et Documents are available online at: https://cerdi.uca.fr/etudes-et-documents/
Director of Publication: Grégoire Rota-Graziosi Editor: Catherine Araujo Bonjean
Publisher: Mariannick Cornec ISSN: 2114 - 7957
Disclaimer:
Études et Documents is a working papers series. Working Papers are not refereed, they constitute research in progress. Responsibility for the contents and opinions expressed in the working papers rests solely with the authors. Comments and suggestions are welcome and should be addressed to the authors.
3
Abstract
This paper examines the distributional effects of fiscal consolidation in WAEMU area, using Driscoll and Kraay fixed effects estimation method. Using a tighter fiscal stance, measured by changes in the cyclically-adjusted primary balance (CAPB), over the period 1990-2015, it shows income gap decreases after periods of fiscal adjustments in the region. These finding are contrary to the results of several works focusing on fiscal consolidation. Our results also suggest that when fiscal consolidation is achieved via revenue side, income inequality seems to be reduced further. However, reductions in primary expenditures do not seem to reduce the income gap.
Keywords
Fiscal consolidation, Income inequality, Panel data, WAEMU.
JEL Codes
4 1-Introduction
The last two decades have revealed a high level of inequality in developing countries and more precisely in West African countries. According to the AfDB (2018)1, the Gini index in the region oscillated closely between 40 and 46 over the period 1985 and 2015. At the same time, West African countries, especially the resource-intensive ones have recorded a weakening of their economies due to collapsing in commodity prices due to their dependency on natural resource. One can add the waste of the public expenditure as well as civil conflicts. In addition to these factors explaining the poor economic performance of the economies of the Union, many have seen buffers erode and countries public debt and borrowing costs are rising. In order to cover permanent revenue losses, these countries have resorted to substantial fiscal austerity measures through a combination of spending cuts and tax hikes to ensure macroeconomic stability and sustainable growth. In this context, a relevant empirical question is: What is the effect of fiscal consolidation programs on income distribution? addressing such an issue seems necessary as poor income distribution could reduce the government's political support for implementing consolidation measures, but also because high levels of inequality could hurt long-term growth (Berg and Ostry, 2017). Surprisingly, it must be noted there is little systematic analysis of the distributional effects of fiscal austerity in developing countries.
The choice of the WAEMU is motivated by the fact that the countries of the Union have the same characteristics of impoverishment, still presents a high rate of indebtedness and with some countries of West Africa offer the highest rates of inequality of the continent and the world. Moreover, to our knowledge, there is no empirical investigations that study the relationship between fiscal adjustment and income inequality in WAEMU countries. Furthermore, the study provides guidance to the political and economic decision makers the best choice in term of fiscal austerities measures that are not going to compromise income distribution in WAEMU countries.
To carry out this study, we use the Driscoll and Kraay (1998) standard errors methodology as implemented by Hoechle (2007), that deals with heteroscedasticity and cross-sectional dependence problems. In fact, cross-sectional dependence is caused by the presence of common factors, which are unobserved, but they are uncorrelated with the included regressors. In this case, the standard fixed effect is consistent, but not efficient and the standard errors that will be estimated will be biased.
5
Overall, we find that after periods of fiscal adjustments, income inequality significantly decreases. Moreover, differentiating between spending versus taxes-based adjustments, results suggest that when fiscal consolidation is achieved via tax-based, income inequality tends to be further reduced.
We organize the rest of the paper as follows. The next section presents the literature reviews. Section 3 provides the stylized facts while section 4 describes the data and presents the empirical methodology used to examine the effects of fiscal consolidation episodes on income inequality. Section 5 describes the results. Finally, section 6 concludes.
2-Growth, inequality and fiscal Consolidation: Relation to the literature
There is a relatively large number of studies on the potential impact of austerity measures on economy. Guajardo et al. (2014) analyze the effect of fiscal adjustment in short-term on economic activity in OECD countries, using the narrative approach of Ramey and Shapiro, 1998) and Ramey (2011). Their results conclude that in a fiscal consolidation periods, there is a contraction of private domestic demand and GDP. Thereby, a 1 percent of fiscal consolidation leads to real GDP declines by 0.62 percent and reduces real private consumption by 0.75 percent. Yang, et al. (2015) focus also on the short-term effects of fiscal adjustment on economic activity from 1970 to 2009 in 20 OECD countries. They compare two approaches: the traditional approach based on changes in cyclically adjusted primary balance (CAPB) and the narrative approach based on historical records. Their finding highlights that in period of fiscal adjustments, economy activity always decline in the short term. In addition, the loss of output is less important in the period of spending-based adjustments relative to that of the tax-based adjustment.
McDermott and Wescott (1996) argue that the success of debt ratio reduction depends on the fiscal austerity measure size and composition. Comparing the effect of spending-based adjustments and tax-based adjustment, authors show that it is more likely to be successful adjustments based on spending cuts. In addition, the chance of success of the adjustment progress in the same direction as its importance. So, when the adjustment is large, it follows a success. On the other hand, they show that fiscal adjustments are more likely to fail during a global recession. Alesina et al. (2015) support previous conclusions, noting that tax adjustments produce deeper and longer recessions than those based on expenditures.
Afonso et al. (2006) assess fiscal consolidations in Central and Eastern European countries and suggest that expenditure-based adjustments have been more successful. Giudice et al. (2007)
6
conclude that fiscal consolidation is more likely to foster economic growth during periods of below potential output and when fiscal adjustment is based on spending cuts. (Romei, 2015) studies the issue of the optimal speed and composition of a fiscal consolidation, evaluating the impact of different speeds of adjustment and of variations in several fiscal instruments on aggregate welfare. The main finding of this work is that a fiscal consolidation should be done quickly and by cutting public expenditure.
It should be noted that most of the existing studies on the economic effects of fiscal consolidation have focused on the effects of fiscal adjustments on economic growth; the distributive effects of austerity have benefited relatively less from research efforts. Almost of the studies on the redistributive effect of fiscal consolidation are conducted on a sample of OCDE countries or a set of advanced countries. (Mulas-Granados, 2005) studies the short-term economic impact of alternative fiscal adjustment strategies, with an especial focus on their effect on economic growth and income distribution. Using a sample of 53 adjustment episodes occurred in the fifteen EU Member States over the period 1960-2000, the result supports evidence of a trade-off between growth and equality, mediated by fiscal consolidations. More specifically, while expenditure-based adjustments are more effective in terms of subsequent economic growth than revenue-based adjustments, they do so at the expense of increasing income inequality. Therefore, according to author, during fiscal adjustment, inequality tends to increase and especially when it is a spending-based adjustment. Moreover, the level of inequality is even higher in the case of reductions in social spending. Tax-based adjustments focusing on indirect taxes tend to exacerbate inequality. However, this result is not verified when increases in indirect taxes are combined with compensatory measures, such as direct measures for poor households.
Agnello (2012), investigating the distributional effects of fiscal consolidation in OECD countries, supports an equalizing effect of austerity measures. They find that "successful" fiscal adjustments tend to be strongly beneficial at achieving a more equal income distribution. In fact, the net income Gini index falls in statistically significant manner by when the fiscal consolidation succeeded in bringing public debt back to a lower level. Rawdanowicz et al. (2013) point out that fiscal consolidations could increase income inequality through multiple channels. An important channel could be an increase in unemployment that widens disparities in market incomes; Moreover, reductions in social transfers can affect households in the lower parts of the income distribution, and a decline in public programs benefiting the poor might also increase inequality in disposable income.
7
Azevedo et al., (2014) analyze the relationship between sub-national fiscal policy and income distribution in Brazil, using household survey data. Their found that a stricter fiscal policy is not linked to a worsening in income gap. In addition, the results suggest that rising revenue in Brazilian states have not had an amplifying effect on inequality. Moreover, measures of inequality do not appear to be aggravated by reductions in primary spending. It should be noted that this conclusion is contrary to the results of several studies on the effects of fiscal consolidation on inequality using national data for OECD economies.
3- The challenge of equity in WAEMU countries: stylized facts
In this section, we give a comparison of trends in income inequality in the WAEMU countries. Thus, we refer to the Gini index which is the measure of inequality broadly used and available for many years. We use the Gini net which is Gini index for disposable income (tax, post-transfer), Figure 1 presents graph in income inequality by countries in WAEMU zone. For each country, the graph presents the mean income inequality over two sub-periods: 2000/2008 and 2009/2015. Generally, average income inequality remains high (above 30 points) for all countries over the two sub-periods. Over the period 2000-2008, that is before the 2008 economic crisis, Burkina Faso has had a relatively high Gini of over 39. Over the period 2009-2015, efforts have been made to improve income distribution in most countries. Of the eight WAEMU countries, just three saw their inequality index increase between 2009 and 2015 (Togo, Benin, and Guinea-Bissau) compared to the period 2000-2008. Niger is the country that registered a low level of income inequality in the area over the period 2009-2015. However, in terms of percentage of variations, Burkina Faso is the country that experienced the largest decline in the inequality with a -4.78 percentage, followed by Niger (-3.76 %), Mali (-2.12%) and Côte d'Ivoire (-0.39 %) during the same period.
8
Figure 1: Mean income inequality in WAEMU over the period 2000-2015.
Source: Author, using SWIID database (SWIIDv6_2)
4-Data and Methodological Approach 4.1-Data
The dependent variable used in our regressions is the Gini coefficient for disposable income taken from the Standardized World Income Inequality Database (SWIID) introduced by Solt in 2008 to provide researchers with data on income inequality that maximizes comparability for the widest possible sample of countries and years (Solt, 2009). More specifically, we use the Gini coefficient for disposable income from SWIID database (SWIIDv6_2),
The SWIID database is an attempt to address the problem of data scarcity. The data are based on extended imputations where, for countries that do not have the required data for a given year, observations from the same country in other years and other countries of the same year are used to impute both gross and net inequality indices. However, others have been very critical of the widespread use of imputations in general and the particular type of imputations used by SWIID, and caution against the use of the dataset in econometric work (see Jenkins, 2015 and Ferreira et al., 2015), All costs arising from its implementation must be considered alongside the potential benefits arising from broader coverage. The value of SWIID depends on the plausibility of the assumptions underlying the imputation model (potential bias problems) and the correct use of the multiplied-imputed data (precision problems), Even though the SWIID
0 10 20 30 40 Guinea-Bissau Benin Togo Cote d'Ivoire Senegal Burkina Faso Mali Niger
Gini net (Mean)
9
has some weaknesses, it is important to note that SWIID uses a transparent procedure to increase the comparability of available data on cross-national inequalities. Although it is not ideal for all research on economic inequality, its advantages over other transnational data sets will make it an invaluable resource for those interested in ascertaining the causes and effects of income inequality cross-nationally and over time.
Definition of fiscal adjustments
To assess the distributional effect of fiscal adjustments, we use the cyclically adjusted primary balance (CAPB) that represents an indicator government’s fiscal stance. The interest of this fiscal measure is that it isolates discretionary policy action from effects resulting from economic activity notably change in real interest rate or inflation. Especially, we use primary fiscal variables that exclude interest payments because the fluctuations in interest payments cannot be considered discretionary. The cyclical correction is making by following the method proposed by Alesina and Ardagna (2010) and Yang et al. (2015), According to authors, such fiscal variable is simpler and more transparent than more complicated official measures such as those of the OECD and the IMF that use estimates of potential output and fiscal multipliers. The underlying principle of this method, as mentioned Yang et al. (2015), is that since public expenditure is negatively dependent on GDP as a result of unemployment benefits, and because revenue responds positively to GDP as a result of tax revenues, changes in cyclically-adjusted fiscal variables can be calculated from the difference between the predicted current-year value (which would prevail if unemployment had not changed since the previous year) and the actual value of the previous year.
Although CAPB is used to measure fiscal consolidations in several studies, however, this is not a perfect measure and can lead to biased results (Romer and Romer, 2010). CAPB may consider non-policy factors that are correlated with exogenous variables affecting inequality or growth. For instance, an expansion in the stock market leads to higher incomes and therefore higher tax revenues. This translates into an improvement in CAPB, although not being in response to fiscal adjustments. In addition, this will likely affect other variables, such as higher consumption and investment. Therefore, there is likely to have positive correlation between an increase in CAPB and the error term. This can lead to an upward biased estimate (IMF, 2011), CAPB may also suffer from measurement error if it omits periods in which fiscal adjustments have been accompanied by countervailing negative shocks.
The CAPB, however, can also be affected crucially by the commodity price volatility. Tax receipts in developing countries increase with rising prices for imported or exported products
10
(Ehrhart, and Guerineau, 2013). For imported products, this increase in tax revenues is due to the fact that more tariffs being collected but, because of the numerous tax exemptions granted in times of high prices, the positive impact on tax revenues may not always occur. For large commodity-exporting economies, the increases in tax revenues due to soaring export prices come from an increase in profit tax and non-tax revenues, such as dividends or royalties levied on companies, which produce primary products. Then, commodity price instability, both for imported and exported products has an adverse effect on fiscal balance in developing countries. Therefore, contrary to Yang et al. (2015) that use a share price index as an additional variable determining the CAPB, we use the international price of cocoa. In fact, cocoa accounts for 15% of Côte d'Ivoire's GDP and more than 50% of its export earnings2. When considering cocoa price as a business cycle factor, it would be ideal to include other types of commodity prices such as oil price and coffee price. But we use only the price of cocoa as a business cycle factor due to its particular relevance to tax revenues, and we believe this index may be representative of the fluctuation in the price of others commodity.
First, to gather cyclically-adjusted expenditures as a share of GDP, we make a regression of primary spending on the unemployment rate (𝑈𝑡) and a time trend for the country:
𝐷𝑡 = 𝛾0+ 𝛾1𝑇𝑟𝑒𝑛𝑑 + 𝛾2𝑈𝑡+ 𝑒𝑡 (1)
Then, with the estimated coefficients (𝛾̂1, 𝛾̂2) and the preceding-year unemployment rate (𝑈𝑡−1), we calculate the value of primary spending adjusted for changes in unemployment: 𝐷𝑡∗(𝑈𝑡−1) = 𝛾̂0+ 𝛾̂1𝑇𝑟𝑒𝑛𝑑 + 𝛾̂2𝑈𝑡−1 (2)
The discretionary expenditure change is calculated as: 𝐷𝑡∗(𝑈𝑡−1) − 𝐷𝑡−1. We apply the same
step to calculate the cyclically adjusted revenues. However, in this step, the cocoa price index is added to the regression.
𝑅𝑡 = 𝜑0+ 𝜑1𝑇𝑟𝑒𝑛𝑑 + 𝜑2𝑈𝑡+ 𝜑3𝐶𝑜𝑐𝑜𝑎_𝑝𝑟𝑖𝑐𝑒𝑡+ 𝜖𝑡 (3) 𝑅𝑡∗(𝑈𝑡−1, 𝐶𝑜𝑐𝑜𝑎𝑝𝑟𝑖𝑐𝑒𝑡−1) = 𝜑̂0 + 𝜑̂1𝑇𝑟𝑒𝑛𝑑 + 𝜑̂2𝑈𝑡−1+ 𝜑̂3𝐶𝑜𝑐𝑜𝑎_𝑝𝑟𝑖𝑐𝑒𝑡−1 (4) Finally, the change in discretionary fiscal stance are gathered as follows:
∆𝐶𝐴𝑃𝐵 = [𝑅𝑡∗− 𝑅𝑡−1] − [𝐷𝑡∗− 𝐷𝑡−1] (5)
11
The literature identifies fiscal adjustment episodes as important and sustained changes in CAPB. The size and persistence criteria differ considerably from one study to the next. For instance, Alesina and Ardagna (2010) consider a period of fiscal consolidation when the change in CAPB is at least 1.5% of GDP in 1 year. Another example is the criteria defined by Alesina and Ardagna (2013) that deem the period of fiscal adjustment correspond at the time that the cumulative change in CABP is at least 2% p of GDP in 2 consecutive years and at least 3% of GDP in 3 or more years with the improvement of each year. Giavazzi and Pagano (1996), consider the episode of fiscal adjustment the period where the cumulative change in CAPB is at least 5, 4, 3% of GDP in respectively 4, 3, or 2 consecutive years, or 3% in 1 year.
The fiscal adjustment episodes considered in our study can be defined as follows:
A period of fiscal adjustment is a year in which the cyclically adjusted primary balance (CAPB) improves by at least 1 per cent of GDP. This allows us not to consider the different periods when the change in CAPB could be due to exogenous changes in other variables rather than change in policy.
A tax-based fiscal adjustment corresponds to a period where CAPB improves by 1% or more
and government revenues as % of GDP increase by 0.5% or more.
A spending-based fiscal adjustment corresponds a period where CAPB improves by 1% or more
and government spending as % of GDP decreases by 0.5% or more.
Other variables are included in the baseline specifications. The institutional quality data are from ICRG. Fiscal Variables for the calculation of CAPB are from BCEAO online database. All other data are obtained from World Bank database. Each variables of model have been presented briefly in Table (2), In advance we concisely explain about some variables of this model.
It has been argued that inflation generally worsens poverty and income inequality. First, inflation can reduce real income. Second, worker’s real income will decline if their nominal wages increase less than the price of goods that they consume. Inflation lowers the overall purchasing power of households and tends to raise poverty (Agénor, 2005). Romer and Romer (1998) studied the incomes of the poor and show that in the short run, higher inflation when following economic growth can sustain the incomes of the poor. However, in the long term, taking into account the economic uncertainty, it can harm both incomes and the incomes of the poor. Using large sample of household survey, Easterly and Fischer (2001) found that the poor
12
were more likely than the rich to mention inflation as a problem, and that inflation compromise the welfare of poor more than it does that of the rich. In the same line, Ferreira and Litchfield (2001) found in the case of Brazil that higher inflation leads to a lower share of income held by the poorest income group.
The population growth is expected worsen inclusive growth as faster growing societies experience faster growing demand for public services. This increases difficulty of governments to provide those services. Therefore, high population growth puts a considerable break on per capita growth prospects. It also contributes significantly to low achievement in poverty reduction and is associated with households moving into poverty.
The quality of institutions is very important. For example, the good socioeconomic conditions that is an assessment of the socioeconomic pressures at work in society that could constrain government action can contribute to better redistribution in income. By against, the weakness in institutional quality such as corruption is clearly a very serious problem that is detrimental to inclusive growth. Corruption robs the poor most of all and deprives people of access to service and of the opportunity to earn living. In some countries, it is a major obstacle to economic growth.
Others important variables that can affect the income inequality are, trade open, and social globalization.
Descriptive statistic of variables
The table 1 below provides a summary of the descriptive statistics analysis of the variables in our model.
13 Table 1: Descriptive statistic
Variables Obs Mean Std. Dev. Min Max
Net Gini 150 37.348 2.375 31.5 42.9 ΔCAPB 208 .3701 .484 0 1 GDP pc growth 200 2.348 17.360 -43.164 169.902 Inflation 208 87.453 26.879 4.687 147.543 Social globalization 176 23.495 6.887 10.492 37.483 Population growth 200 2.909 .749 1.926 9.879 Corruption 168 2.171 .720 0 4 External conflic 168 9.421 1.229 6 12 Military in politics 168 2.135 1.231 0 5
Development Aid (log) 208 19.986 .810 18.041 21.813
Remittances 208 3.612 2.987 .226 12.600
Trade open 208 30.176 8.917 14.187 62.516
Source: Author estimates
Generally, one can note that standard deviations are low meaning that the variances are minimal between the variable values.
4.2- Methodology of estimation
A standard model used to analyze the factors that affect the income inequality could be represent as follow:
𝑌 = 𝜃𝑋 + 𝜀 (6)
Where Y represents is the Gini index for income inequality, and X is a vector of macroeconomic variables including the GDP per capita growth rate at the previous year. Next, we expand our analysis by focusing on the relationship between fiscal adjustment and income inequality. To do this, we are expanding the model specification (6), including a fiscal consolidation indicator (𝐹𝐴𝑡), More specifically, we control the episodes of fiscal adjustment by the cyclically-adjusted
primary balance (CAPB), To estimate the distributional impact of fiscal consolidation episodes, we formally run the following equation:
𝑌𝑡= 𝛽0+ 𝛽1𝐹𝐴𝑡+ 𝛽2𝑋𝑡+ 𝜀𝑡 (7)
where 𝑌 denotes, one of our dependent variables (Gini index), 𝐹𝐴 represents the changes in the CAPB in percent of GDP in periods of fiscal adjustment and zero otherwise; 𝑋 is a vector of control variables and 𝜀𝑡 is the error term.
14
Our data is a cross-sectional time series data set, and thus pooled OLS is the simple way for estimating since it does not consider non-observed effects. It is important to note that in our sample, fiscal adjustment episode as well as income inequality differs from one country to another. Hence it is possible that country effects can be relevant for explaining gap in income distribution. Therefore, the model in equation (7) is estimated employing fixed effect estimator (FE), The literature on panel data emphasizes that panel data sets are likely to exhibit substantial cross-sectional dependence, which may arise due to the presence of common shocks and unobserved components that become part of the error term ultimately, spatial dependent and due to idiosyncratic pair-wise dependence in the disturbances with no particular pattern of common components or spatial dependence (Baltagi, 2008). Assuming that cross-sectional dependence is caused by the presence of common factors, which are unobserved (and as a result, the effect of these components is felt through the disturbance term) but they are uncorrelated with the included regressors, the standard FE is consistent, although not efficient and the estimated standard errors are biased. Using the tests developed by Frees (1995) and Pesaran (2004), we found evidence for the presence of cross-sectional dependence. Also, the Breush-Pagan test and the Durbin Watson test showed the presence of panel heteroscedasticity and serial autocorrelation, as common for panel data with country-year observations. To correct these problems, the model (7) was estimated using the Driscoll and Kraay (1998) standard errors as implemented by Hoechle (2007). This estimation accounts for heteroscedasticity and cross-sectional dependence problems. Moreover, this option allowed us to correct the auto-correlation of any order. Some studies using GMM methods of reasons of a possible endogeneity of certain variables. Here, we decline to address the issue of endogeneity due limited number of observations. This should not have any effect on our results.
5-Empirical results
In this section, the results of the estimation of equation 1 are presented using fixed effects models that account state characteristics that are time invariant. To mitigate the likely problems of endogeneity, we use lagged values of the control variables and suppose that they are weakly exogenous. We also address cross-sectional dependence problems by including time effects in regressions and using standard errors corrected by Driscoll and Kraay (1998).
Table (2) presents the estimated coefficients of the changes in the CAPB on the income inequality measure by Gini index in our baseline model. The results show that that fiscal consolidations in previous years have a statistically significant negative effect on a current Gini coefficient. This result suggests that an improvement of 1% in previous years CAPB reduce
15
income inequality in current period, with an overall impact of 0.856 on the Gini coefficient. This means that income gap decreases after periods of fiscal consolidation. The result is in line to those obtained by Azevedo et al. (2014). Their found a negative and significant relationship between in cyclically adjusted-primary balances and Gini coefficient, meaning that a tighter fiscal stance in Brazilian states does not seem to increase inequality over the period of study. These results are contrary to those of several studies that have studied the impact of fiscal consolidations on inequality at the national level for OECD countries.
16
Table (2): Effects of fiscal adjustment on income inequality
VARIABLES Dependent variable: Gini coefficient
(1) (2)
Pooled-OLS Fixed-effects
All adjust. All adjust.
ΔCAPB (t-1) -0.758** -0.856** (0.344) (0.331) GDP pc growth (t-1) 0.000856 -0.00744*** (0.00241) (0.00239) Inflation (t-1) -0.00818 0.00327 (0.0111) (0.00574) Social globalization (t-1) -0.0529*** -0.234*** (0.0109) (0.0409) Population growth (t-1) -0.188* -0.190*** (0.0975) (0.0581) Corruption (t-1) 0.782*** 0.236* (0.236) (0.124) External conflic (t-1) -0.582*** 0.0597 (0.0813) (0.244) Military in politics (t-1) -0.447** -0.342*** (0.210) (0.0784) Constant 44.85*** 43.08*** (1.395) (2.234) Number of observations 123 123 Number of groups 7 7 R-squared 0.2591 0.3692
Source: Author estimates
Note: Driscoll-Kraay robust t-statistics in parentheses. They are robust to very general forms of cross-sectional and temporal dependence. All regressions control for Country fixed effects, Time fixed effects, and a constant term are included in each regression. *** p<0.01, ** p<0.05, * p<0.1
17
Spending versus taxes-based consolidation effects on equity
Does the composition of fiscal consolidation (spending versus taxes-based) matter for inequality? We attempt in this section to analyze the role played by the composition of fiscal adjustment in the distribution of income. Thus, we re-run our model by focusing on the two types of fiscal adjustments that are “tax-based adjustment” and “spending-based adjustment as defined above. Table (3) reports the results.
Results show that spending-based adjustments that mean cutting in current public expenditure appears to have no effect on income gap (Column 2), Interestingly, when fiscal consolidation is achieved via revenue side, income inequality seems to be reduced further (Column 1), These results are close to those obtained by Agnello and Sousa (2012). According to these authors, while fiscal adjustments following the reduction of public expenditure seem to hurt income distribution, the increase in tax seems to reduce income inequality. This evidence suggests that policymakers could achieve their goal of equal income distribution from a properly designed tax-based consolidation plan. Furthermore, fiscal adjustment focusing on indirect taxes may improve equity (Ciminelli et al., 2017). For authors, this outcome may be partly explained by the operation of a positive labor supply channel. Authors think that individual are more incentives to take part in the labor market with the establishment of indirect taxes. One explanation is that indirect taxes raise the price of consumer goods, leading to a negative income effect. Thereby, in developing economies, consolidation policies can be put in place to mitigate its negative impact on income redistribution. However, this must be accompanied by an improvement in the progressiveness of the tax and transfer systems of the global economy.
18
Table (3): Spending and tax-based adjustment effects on income inequality
VARIABLES Dependent variable: Gini coefficient
Driscoll-Kraay Fixed-effects estimation
(1) (2) Tax-based Spend.-based ΔCAPB (t-1) -0.882*** -0.259 (0.273) (0.226) GDP pc growth (t-1) -0.00851*** -0.00715** (0.00225) (0.00279) Inflation (t-1) 0.00493 0.00363 (0.00557) (0.00518) Social globalization (t-1) -0.232*** -0.242*** (0.0422) (0.0469) Population growth (t-1) -0.275*** -0.225*** (0.0429) (0.0555) Corruption (t-1) 0.325*** 0.149 (0.0931) (0.0935) External conflic (t-1) 0.143 0.136 (0.266) (0.324) Military in politics (t-1) -0.362*** -0.377*** (0.0776) (0.0937) Constant 42.13*** 42.63*** (2.228) (2.830) Number of observations 120 120 Number of groups 7 7 R-squared 0.3588 0.3209
Source: Authors estimates
Note: Driscoll-Kraay robust t-statistics in parentheses. They are robust to very general forms of cross-sectional and temporal dependence. All regressions control for Country fixed effects, Time fixed effects, and a constant term are included in each regression. *** p<0.01, ** p<0.05, * p<0.1
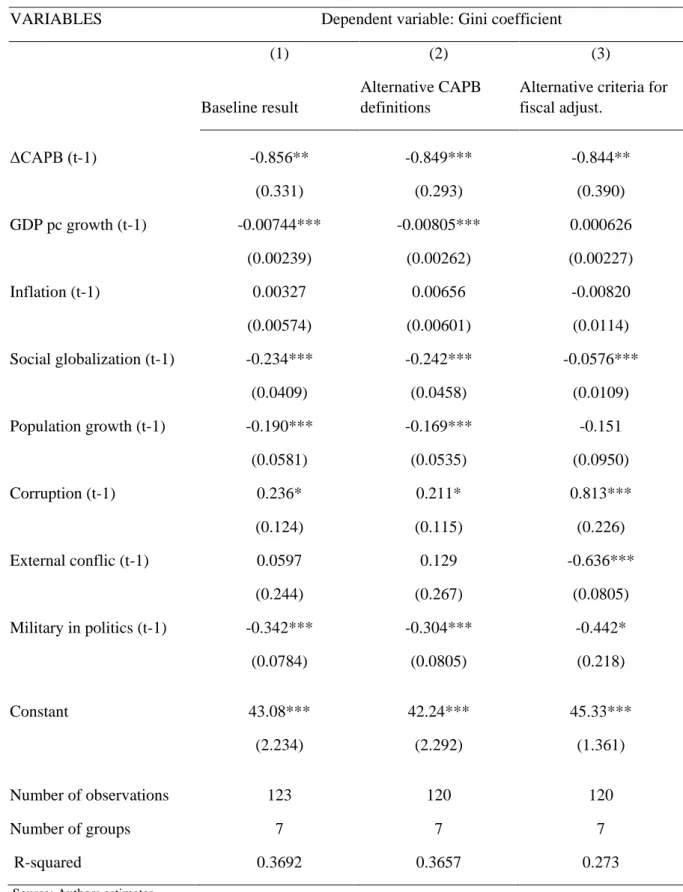
19 Robustness check
To check the robustness of our results, we perform several robustness checks, as calculating an alternative measure of fiscal consolidation as well as adding other control variables. For the construction of the new fiscal consolidation variable, we follow the same procedure developed above, but here, we use the output gap as a proxy for business cycle fluctuations instead of unemployment to cyclically adjust government spending and revenue. This allows us to calculate the alternative CAPB measure. Next we follow Alesina and Perotti (1997) in order to give a new definition of fiscal adjustment. Therefore, fiscal adjustment corresponds to period where the change in CAPB is at least 1.5% p of GDP in 1 year or at least 1.25% p of GDP per year in both 2 consecutive years.
Table (4) shows that the baseline results (columns 1) are robust to alternative CAPB definitions (columns 2) and alternative criteria for the definition of fiscal adjustment (columns 3), In each case, fiscal adjustment has a similarly negatively links to inequality meaning that after a period of fiscal austerity, there is a worsening in the distribution of income. In addition, almost all variables keep the right sign and their level of significance.
20
Table 4: Effects of fiscal adjustment on equity: alternative measures
VARIABLES Dependent variable: Gini coefficient
(1) (2) (3)
Baseline result
Alternative CAPB definitions
Alternative criteria for fiscal adjust. ΔCAPB (t-1) -0.856** -0.849*** -0.844** (0.331) (0.293) (0.390) GDP pc growth (t-1) -0.00744*** -0.00805*** 0.000626 (0.00239) (0.00262) (0.00227) Inflation (t-1) 0.00327 0.00656 -0.00820 (0.00574) (0.00601) (0.0114) Social globalization (t-1) -0.234*** -0.242*** -0.0576*** (0.0409) (0.0458) (0.0109) Population growth (t-1) -0.190*** -0.169*** -0.151 (0.0581) (0.0535) (0.0950) Corruption (t-1) 0.236* 0.211* 0.813*** (0.124) (0.115) (0.226) External conflic (t-1) 0.0597 0.129 -0.636*** (0.244) (0.267) (0.0805) Military in politics (t-1) -0.342*** -0.304*** -0.442* (0.0784) (0.0805) (0.218) Constant 43.08*** 42.24*** 45.33*** (2.234) (2.292) (1.361) Number of observations 123 120 120 Number of groups 7 7 7 R-squared 0.3692 0.3657 0.273
Source: Authors estimates
Note: Driscoll-Kraay robust t-statistics in parentheses. They are robust to very general forms of cross-sectional and temporal dependence. All regressions control for Country fixed effects, Time fixed effects, and a constant term are included in each regression. *** p<0.01, ** p<0.05, * p<0.1
21
Next, we check the robustness of our findings to the inclusion of other variables to control for development aid, trade open as well as remittances received by countries. The results are present in the table 5. Here again, the results regarding our interest variable that measures fiscal adjustment are consistent with our previous estimates. Results also give evidence that trade open and development aid contribute to strengthening the good distribution of income. However, our finding give evidence that international remittances tend to raise income inequality in WAEMU countries. In fact, households receiving international remittances are not poor at the first time and, with the receipt of remittances, they tend to improve their situation significantly. It should also be added that these receipts of remittances mainly benefit families whose members have emigrated, generating a gap in the household’s income.
22 Table 5: Robustness with adding news variables
VARIABLES Dependent variable: Gini coefficient
(1) (2) (3) ΔCAPB (t-1) -0.831** -1.063** -0.839** (0.300) (0.437) (0.307) GDP pc growth (t-1) -0.00510** -0.0117*** -0.00606*** (0.00241) (0.00360) (0.00199) Inflation (t-1) 0.00457 -7.34e-05 0.0143 (0.00937) (0.00497) (0.0102) Social globalization (t-1) -0.225*** -0.313*** -0.215*** (0.0487) (0.0401) (0.0268) Population growth (t-1) -0.169*** -0.259*** -0.291*** (0.0538) (0.0808) (0.0736) Corruption (t-1) 0.344* 0.115 0.210 (0.167) (0.232) (0.138) External conflic (t-1) 0.0695 0.0347 0.0455 (0.239) (0.179) (0.205) Military in politics (t-1) -0.256*** -0.171*** -0.388*** (0.0685) (0.0571) (0.0870) Dev. Aid (t-1) -0.667*** (0.137) Remittances (t-1) 0.416*** (0.0397) Trade open (t-1) -0.114** (0.0493) Constant 55.50*** 44.32*** 45.57*** (4.612) (1.904) (1.690) Number of observations 123 123 123 Number of groups 7 7 7 R-squared 0.3968 0.4799 0.4072
Source: Authors estimates
Note: Driscoll-Kraay robust t-statistics in parentheses. They are robust to very general forms of cross-sectional and temporal dependence. All regressions control for Country fixed effects, Time fixed effects, and a constant term are included in each regression. *** p<0.01, ** p<0.05, * p<0.1
23
6-Conclusion
This paper examines the distributional effects of fiscal consolidation in WAEMU. Using a tighter fiscal stance, measured by changes in the cyclically-adjusted primary balance, over the period 1990-2015, it shows income gap decreases after periods of fiscal adjustments in the region. In other words, the results suggest there is no trade-off between growth and income inequality when implementing fiscal consolidations. These finding are contrary to the results of several works analyzing the effect of austerities measures on income inequality at the national level. Our results also suggest that when fiscal consolidation is achieved via revenue side (tax-based fiscal consolidations), income inequality seems to be reduced further. However, reductions in primary expenditures do not seem to reduce the income gap. These results could be explained by the fact that in developing countries, tax based-adjustment are generally a base-broadening measures. Therefore, this will contribute to strong tax revenue collections and play an important role in achieving higher, sustainable economic growth. Therefore, Fiscal adjustment in WAEMU economies should focus on tax revenue mobilization to achieve a sustainable goal. In this case,
24 Bibliographies
AfDB. (2018), "Macroeconomic developments and poverty, inequality, and employment; Labor
markets and jobs," Africa Economic Outlook 2018 - African Development Bank.
Afonso, A., Christiane, N., and Philipp, R. (2006), "Fiscal consolidations in the Central and Eastern European countries," Review of World Economics, 142(2), 402–421.
Agénor, P. R. (2005), "Unemployment-poverty Trade-offs," Central Banking, Analysis, and
Economic Policies Book Series, 8, 115–165.
Agnello, L., and Sousa, R. M. (2012), "Fiscal adjustments and income inequality: a first assessment," Applied Economics Letters, 19(16), 1627–1632.
Alesina, A., and Ardagna, S. (2010), "Large Changes in Fiscal Policy: Taxes versus Spending,"
Tax Policy and the Economy, 24(1), 35–68.
Alesina, A., and Ardagna, S. (2013), "The Design of Fiscal Adjustments," Tax Policy and the
Economy, 27(1), 19–68.
Alesina, A., Favero, C., and Giavazzi, F. (2015), "The output effect of fiscal consolidation plans," Journal of International Economics, 96(S1), S19–S42.
Alesina, A., and Perotti, R. (1997), "Fiscal adjustments in OECD countries: composition and macroeconomic effects," IMF Staff Papers, 44(2), 210–248.
Azevedo, J. P., David, A., Bastos, F. R., and Pineda, E. (2014), "Fiscal Adjustment and Income Inequality: Sub-national Evidence from Brazil," IMF Working Paper WP/14/85.
Baltagi, B. (2008), "Econometric analysis of panel data," John Wiley and Sons.
Berg, A. G., and Ostry, J. D. (2017), "Inequality and Unsustainable Growth: Two Sides of the Same Coin? ," IMF Economic Review, 65(4), 792–815.
Ciminelli, G., Ernst, E., Giuliodori, M., and Merola, R. (2017), "The composition effects of
tax-based consolidations on income inequality," Global Labor Organization (GLO) Discussion Paper Series (Vol. 25),
Driscoll, J. C., and Kraay, A. C. (1998), "Consistent Covariance Matrix Estimation with Spatially Dependent Panel Data," Review of Economics and Statistics, 80(4), 549–560. Easterly, W., and Fischer, S. (2001), Inflation and the Poor. The Ohio State University Press,
33(2), 160–178.
Ehrhart, H., and Guerineau, S. (2013), "Commodity Price Volatility and Tax Revenues:
Evidence from Developing Countries," Document de Travail, Banque de France (Vol.
423),
Ferreira, F. H., and Litchfield, J. A. (2001), "Education or inflation?: the micro and macroeconomics of the brazilian income distribution during 1981-1995," Cuadernos de
Economía, 38(114), 209–238.
Ferreira, F. H., Lustig, N., and Teles, D. (2015), "Appraising cross-national income inequality databases: An introduction," The Journal of Economic Inequality, 13(4), 497–526. Frees, E. W. (1995), Assessing cross-sectional correlation in panel data. Journal of
Econometrics, 69(2), 393–414.
Giavazzi, F., and Pagano, M. (1996), "Non-Keynesian effects of fiscal policy changes: international evidence and the Swedish experience," Swedish Economic Policy Review,
3(1), 67–103.
25
expansionary fiscal consolidations in the EU," Open Economies Review, 18(5), 613–630. Guajardo, J., Leigh, D., and Pescatori, A. (2014), "Expansionary austerity? International
evidence," Journal of the European Economic Association, 12(4), 949–968.
Hoechle, D. (2007), "Robust Standard Errors for Panel Regressions with Cross-Sectional Dependence," Stata Journal, 7(3), 281.
Jenkins, S. P. (2015), "World income inequality databases: an assessment of WIID and SWIID,"
The Journal of Economic Inequality, 13(4), 629–671.
McDermott, C. J., and Wescott, R. F. (1996), "An empirical analysis of fiscal adjustments,"
IMF Staff Papers, 43(3), 725–753.
Mulas-Granados, C. (2005), "Fiscal Adjustments and the Short-Term Trade-Off between economic growth and equality," Hacienda Pública Española, 61–92.
Pesaran, M. H. (2004), "General Diagnostic Tests for Cross Section Dependence in Panels," University of Cambridge, Faculty of Economics, Cambridge Working Papers in Economics (Vol. 0435),
Ramey, V. A. (2011), "Identifying government spending shocks: it’s all in the timing," The
Quarterly Journal of Economics, 126(1), 1–50.
Ramey, V. A., and Shapiro, M. D. (1998), "Costly capital reallocation and the effects of government spending," Carnegie-Rochester Conference Series on Public Policy, 48, 145– 194.
Rawdanowicz, Ł., Wurzel, E., and Christensen, A. K. (2013), "The Equity Implications of
Fiscal Consolidation," OECD Economics Department.
Romei, F. (2015), "Need for (the right) speed: The timing and composition of public debt deleveraging," European University Institute.
Romer, C. D., and Romer, D. H. (1998), "Monetary policy and the well being of the poor,"
National bureau of economic research (Vol. 6793),
Romer, C. D., and Romer, D. H. (2010), "The Macroeconomic Effects of Tax Changes: Estimates Based on a New Measure of Fiscal Shocks," American Economic Review 100,
100(June), 763–801.
Solt, F. (2009), "Standardizing the World Income Inequality Database," Social Science
Quarterly, 90(2), 231–242.
Yang, W., Fidrmuc, J., and Ghosh, S. (2015), "Macroeconomic effects of fiscal adjustment: A tale of two approaches," Journal of International Money and Finance, 57, 31–60.
26 Annex
Annex A: Countries
Benin Mali
Burkina Faso Niger
Cote d'Ivoire Senegal
Guinea-Bissau Togo
Annex B: Variables definitions and sources
Variables Description/Notes Sources
GDP per capita growth GDP per capita growth (annual %) Central Bank of West African States (BCEAO)
Gini coefficient Inequality estimates after the deduction of taxes and social contributions
Standardized World Income Inequality Database (SWIID)
Cyclically Adjusted Primary Balance (CAPB)
See main text for details of variable construction. State level primary balance (revenues minus expenditures net of interest payments) as a share of state GDP
Authors’ calculations based on BCEAO database.
Inflation Inflation, consumer prices (annual %) World Bank Development Indicators
Social globalization
Social globalisation consists of interpersonal, informational and cultural globalisation, each of them contributing a third to the social globalisation index.
KOF Globalisation Index
Trade open
Trade is the sum of exports and imports of goods and services measured as a share of gross domestic product. The indicator is divided by two in oder to have trade open.
Authors’ calculations based on World Bank trade indicator (% of GDP)
Population growth Annual population growth rate World Bank Development Indicators
Corruption Corruption within the political system International Country Risk Guide (ICRG)
External conflic
The external conflict measure is an assessment both of the risk to the incumbent government from foreign action, ranging from non-violent external pressure (diplomatic pressures, withholding of aid, trade restrictions, territorial disputes, sanctions, etc) to violent external pressure (cross-border conflicts to all-out war),
International Country Risk Guide (ICRG)
Military in politics The military involvement in politics, even at a peripheral level, is a diminution of democratic accountability.
International Country Risk Guide (ICRG)
Remittances Personal remittances received (% of GDP) World Bank Development Indicators
Development Aid Net official development assistance and official aid received (constant 2015 US$)
World Bank Development Indicators