HAL Id: hal-00861103
https://hal.archives-ouvertes.fr/hal-00861103
Submitted on 11 Apr 2015
HAL is a multi-disciplinary open access
archive for the deposit and dissemination of
sci-entific research documents, whether they are
pub-lished or not. The documents may come from
teaching and research institutions in France or
abroad, or from public or private research centers.
L’archive ouverte pluridisciplinaire HAL, est
destinée au dépôt et à la diffusion de documents
scientifiques de niveau recherche, publiés ou non,
émanant des établissements d’enseignement et de
recherche français ou étrangers, des laboratoires
publics ou privés.
continental and oceanic mesoscale convective systems
and potential implications for commercial aircraft at
flight altitude
Jean-François Gayet, V. Shcherbakov, L. Bugliaro, Alain Protat, Julien
Delanoë, Jacques Pelon, Anne Garnier
To cite this version:
Jean-François Gayet, V. Shcherbakov, L. Bugliaro, Alain Protat, Julien Delanoë, et al.. Microphysical
properties and high ice water content in continental and oceanic mesoscale convective systems and
potential implications for commercial aircraft at flight altitude. Atmospheric Chemistry and Physics,
European Geosciences Union, 2014, 14 (2), pp.899-912. �10.5194/acp-14-899-2014�. �hal-00861103�
www.atmos-chem-phys.net/14/899/2014/ doi:10.5194/acp-14-899-2014
© Author(s) 2014. CC Attribution 3.0 License.
Atmospheric
Chemistry
and Physics
Microphysical properties and high ice water content in continental
and oceanic mesoscale convective systems and potential implications
for commercial aircraft at flight altitude
J.-F. Gayet1, V. Shcherbakov1,2, L. Bugliaro3, A. Protat4, J. Delanoë5, J. Pelon5, and A. Garnier6
1Laboratoire de Météorologie Physique, UMR6016 CNRS/Université Blaise Pascal, Clermont-Ferrand, France
2Laboratoire de Météorologie Physique, Institut Universitaire de Technologie d’Allier, Montluçon, France
3Deutsches Zentrum für Luft- und Raumfahrt (DLR), Institut für Physik der Atmosphäre, Oberpfaffenhofen, Germany
4Centre for Australian Weather and Climate Research (CAWCR), Melbourne, Australia
5Laboratoire Atmosphères, Milieux, Observations Spatiales, UMR8190 CNRS/Université Pierre et Marie Curie, Guyancourt,
France
6Centre National de la Recherche Scientifique, currently Science Systems and Applications, Inc./NASA Langley Research
Center, USA
Correspondence to: J.-F. Gayet ([email protected])
Received: 13 June 2013 – Published in Atmos. Chem. Phys. Discuss.: 29 August 2013 Revised: 20 November 2013 – Accepted: 12 December 2013 – Published: 27 January 2014
Abstract. Two complementary case studies are conducted
to analyse convective system properties in the region where strong cloud-top lidar backscatter anomalies are observed as reported by Platt et al. (2011). These anomalies were re-ported for the first time using in situ microphysical mea-surements in an isolated continental convective cloud over Germany during the CIRCLE2 experiment (Gayet et al., 2012). In this case, in situ observations quasi-collocated with CALIPSO (Cloud Aerosol Lidar and Infrared Pathfinder Satellite Observation), CloudSat and Meteosat-9/SEVIRI ob-servations confirm that regions of backscatter anomalies rep-resent the most active and dense convective cloud parts with likely the strongest core updrafts and unusually high values of the particle concentration, extinction and ice water con-tent (IWC), with the occurrence of small ice crystal sizes. Similar spaceborne observations of a maritime mesoscale cloud system (MCS) located off the Brazilian coast
be-tween 0◦ and 3◦N latitude on 20 June 2008 are then
anal-ysed. Near cloud-top backscatter anomalies are evidenced in a region which corresponds to the coldest temperatures with maximum cloud top altitudes derived from collocated CALIPSO/IIR and Meteosat-9/SEVIRI infrared brightness temperatures. The interpretation of CALIOP (Cloud Aerosol Lidar with Orthogonal Polarization) data highlights
signifi-cant differences in microphysical properties from those ob-served in the continental isolated convective cloud. Indeed, SEVIRI (Spinning Enhanced Visible and InfraRed Imager) retrievals in the visible spectrum confirm much smaller ice particles near the top of the isolated continental convective
cloud, i.e. effective radius (Reff) ∼ 15 µm as opposed to 22–
27 µm in the whole MCS area. Cloud profiling observations at 94 GHz from CloudSat are then used to describe the prop-erties of the most active cloud regions at and below cloud top. The cloud ice-water content and effective radius retrieved with the CloudSat 2B-IWC and DARDAR (raDAR/liDAR) inversion techniques, show that at usual cruise altitudes of commercial aircraft (FL 350 or ∼ 10 700 m level), high IWC
(i.e. up to 2 to 4 g m−3)could be identified according to
spe-cific IWC–Z (Z being the reflectivity factor) relationships. These values correspond to a maximum reflectivity factor of +18 dBZ (at 94 GHz). Near-top cloud properties also in-dicate signatures of microphysical characteristics according to the cloud-stage evolution as revealed by SEVIRI images to identify the development of new cells within the MCS cluster. It is argued that the availability of real-time infor-mation (on the kilometre-scale) about cloud top IR bright-ness temperature decreases with respect to the cloud environ-ment would help identify MCS cloud areas with potentially
high ice water content and small particle sizes against which onboard meteorological radars may not be able to provide timely warning.
1 Introduction
Platt et al. (2011, called PL hereafter) investigated backscat-ter anomalies in mesoscale convective systems (MCSs) using CALIOP (Cloud Aerosol Lidar with Orthogonal Polariza-tion; Hunt et al., 2009) observations on-board the CALIPSO (Cloud Aerosol Lidar and Infrared Pathfinder Satellite Obser-vation; Winker et al., 2009) platform. They showed that the microphysical cloud properties are different in regions near the centre of large MCSs from in surrounding clouds. These regions, extending over a few tens of kilometres, are the most active, with the coldest top temperatures and with max-imum cloud extinction and altitude. Simultaneous CloudSat cloud profiling radar (CPR; Stephens et al., 2002) observa-tions showed a cloud-top altitude similar to that measured by CALIOP. This feature likely suggests that relatively large ice crystals above the radar detection threshold were reach-ing cloud top. From the depolarization ratio measurements, PL suggested that the CALIOP and CloudSat returns were likely due to a mix of frozen drops or small ice droxtals with large crystals composed of thick hexagonal plates, hexagonal columns, spheroids, and irregular particles.
The same phenomenon was observed for the first time over Europe with aircraft in situ microphysical observations in an isolated continental convective cloud during the CIR-CLE2 experiment (Eichler et al., 2009) over Germany on 26 May 2007. Indeed, we have shown (Gayet et al., 2012, called GA hereafter) that unusually high values for the concentra-tion of small ice particles, extincconcentra-tion and ice water content
(up to 70 cm−3, 30 km−1 and 0.5 g m−3, respectively)
oc-curred at near the top of an overshooting convective cloud
(11 080 m/−58◦C). A chain-like aggregate of frozen droplets
was the main shape of the ice crystals with a maximum particle size and mean effective diameter of 300 µm and 43 µm, respectively. The airborne observations were coordi-nated with satellite observations, which allowed the cloud sit-uation to be coherently described by combined remote sens-ing measurements. The very dense cloud causes a strong attenuation of the CALIOP lidar returns and the Meteosat-9 (MET-Meteosat-9)/SEVIRI retrieved parameters, (Bugliaro et al., 2011) confirming the presence of small ice crystals at the top of the convective cell. Due to the chain-like aggregate shape of the small ice crystals, the power-law relationship between ice water content (IWC) and radar reflectivity (Z) appears to be different from those usually found in cirrus and anvil clouds. IWC is significantly larger in the overshooting cell than in the cirrus cloud for a given equivalent reflectiv-ity factor. Extrapolating the relationship for stronger
convec-tive clouds, IWC up to 5 g m−3 could be experienced with
94 GHz reflectivity factors no larger than about 20 dBZ. This
means that for similar situations, a rather weak radar echo could fail to indicate the occurrence of high ice water con-tent carried by small ice crystals. This has been recognized as a significant hazard for air traffic safety (e.g., Mason et al., 2006).
In anvils of intense mid-latitude storms over the Great
Plains of USA, IWC from 1.5 to 2.5 g m−3 was reported
(Heymsfield and Palmer, 1986, Lawson et al., 1998). Ice
wa-ter content exceeding 2 g m−3and extinction up to 60 km−1
have been measured in tropical convective turrets clouds (Lawson et al., 2010). Heymsfield et al. (2005a, 2006) re-ported a high concentration of small ice crystals (in the
or-der of 50 cm−3) in subtropical and tropical convection, even
in maritime tropical convective updrafts (Heymsfield et al., 2009). Although ice particle concentrations measured by the Forward Scattering Spectrometer Probe (FSSP) are gener-ally overestimated due to shattering effects (see among others Korolev and Isaac, 2005) these unusual observations could be important regarding engineering issues related to the failures of jet engines and Pitot tubes commonly used on commercial aircraft during flights through areas of high ice water content (Lawson et al., 1998; Strapp et al., 1999; Mason et al., 2006). Mason et al. (2006) mentioned that commercial aircraft often observe no flight-radar echoes at the location and altitude of such events.
The objectives of this paper are first to apply PL’s analy-sis to the CALIPSO lidar (CALIOP) backscatter properties related to the isolated continental convective cloud (26 May 2007 CIRCLE2 situation). CloudSat and MET-9/SEVIRI ob-servations combined with available quasi-collocated in situ measurements are analysed in order to obtain a consistent interpretation of these spaceborne remote sensing obser-vations. Then, for comparison purposes we analyse simi-lar spaceborne observations (from measured near-cloud top backscatter anomalies) regarding a maritime MCS on the 20
June 2008 located off the Brazilian coast between 0◦ and
3◦N latitude, in order to select the most-active MCS regions,
which are likely to have the densest clouds and strongest up-drafts. The use of collocated MET-9/SEVIRI real-time data is then discussed to describe the properties of the MCS re-gions most likely to be active, which could be encountered by commercial aircraft at usual cruise altitudes (FL 350 or
∼10 700 m level).
2 Satellite data
In this paper we use CALIPSO, CloudSat and MET-9 obser-vations. Satellite data have been described in detail in GA. We summarize the main payload and technical characteris-tics of the available observations below.
The payload of the CALIPSO satellite includes the Cloud-Aerosol Lidar with Orthogonal Polarization (CALIOP), the Imaging Infrared Radiometer (IIR) and the Wide Field Cam-era (WFC) (Winker et al., 2010). CALIOP is a laser opCam-erating
at 532 nm and 1064 nm, with parallel and orthogonal po-larization detectors at 532 nm (Winker et al., 2003; Hunt et al., 2009). The vertical and horizontal resolutions of the at-tenuated backscatter coefficient product used here are 60 m and 1 km, respectively. IIR is a non-scanning imaging ra-diometer, nadir-viewing with a 69 km swath, and a pixel size of 1 km, which provides measurements in the thermal in-frared atmospheric window region at 8.65 µm, 10.6 µm, and 12.05 µm with a bandpass of 0.9 µm, 0.6 µm and 1 µm, re-spectively (Garnier et al., 2012). The CALIOP beam is nom-inally aligned with the centre of the IIR image. WFC is a fixed, nadir-viewing imager with a single spectral channel covering the 620–670 nm region, selected to match band 1 of the MODIS (MODerate resolution Imaging Spectroradiome-ter) instrument on NASA’s Aqua satellite. The instantaneous field of view (IFOV) and swath are 125 and 61 km, respec-tively.
CloudSat carries a 94 GHz (3.2 mm) cloud profiling radar (CPR) to provide the vertical distribution of hydrometeors (Stephens et al., 2002). The CPR has a nominal vertical
res-olution of 500 m and a footprint of 1.4 × 1.7 km2(cross- and
along-track) for a CPR profile.
The MET-9 satellite’s main payload is the Spinning En-hanced Visible and InfraRed Imager (SEVIRI). It provides image data in four visible and near-infrared channels (0.4– 1.6 µm) and eight InfraRed channels (3.9–13.4 µm). Sam-pling distances are 1 km for the high resolution visible nel and 3 km for the infrared and the three other solar chan-nels.
3 Analysis of the CALIOP backscatter and CloudSat data of the 26 May 2007 isolated continental
convective cloud
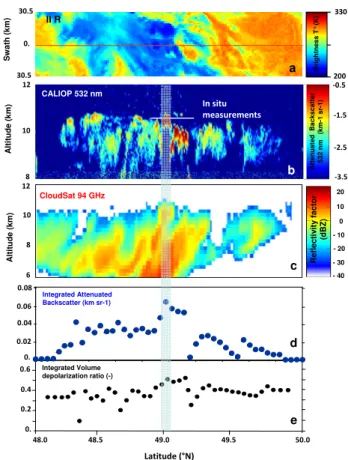
Figure 1a–c display a composite representation (from top to bottom) of IIR brightness temperature images at 10.6 µm, the vertical profiles from CALIOP (attenuated backscatter coef-ficient) and the equivalent reflectivity factor from CloudSat, respectively. These observations are plotted across the con-vective system on 26 May 2007 along the CALIPSO track,
i.e. between 48.0 and 50.0◦N latitude. This situation has
al-ready been discussed in a previous paper (see GA) including a detailed in situ microphysical description. These observa-tions address an isolated continental convective cloud over Germany. The CALIOP data (Fig. 1b) were obtained from the version 3.0 data products (available at the NASA Lang-ley Atmospheric Science Data Centre and the ICARE mir-ror site in France). The CALIOP profiles used correspond to resolutions of 1 km horizontally (e.g. averaged over 3 laser shots) and 60 m vertically. In Fig. 1d, the integrated attenu-ated backscatter is shown along the latitude and Fig. 1e rep-resents the integrated volume depolarization ratio. Figure 1b shows a typical increase of the backscatter coefficient in the
overshooting cell (which reaches 11 000 m/−58◦C level) and
0.08 0.06 0.04 0.02 0. Figure 1 b 48.0 48.5 49.0 49.5 50.0 Latitude (°N) 0.6 30.5 B ri g h t. T e m p . 0.2 0.4 0. Integrated Attenuated Backscatter (km sr-1) b d Integrated Volume depolarization ratio (-) e 30.5 0. S w a th (k m ) 200 330 II R a CALIOP 532 nm A tt e n u a te d B a c k s c a tt e r 5 3 2 n m ( k m -1 s r-1 ) In situ measurements -0.5 -1.5 -2.5 -3.5 A lt it u d e ( k m ) 12 8 10 b B ri g h tn e s s T ° (K ) A lt it u d e ( k m ) 12 10 8 c CloudSat 94 GHz 20 10 0 - 10 - 20 - 30 - 40 R e fl e c ti v it y fa c to r (d B Z ) 6
Fig. 1. (a) Imaging Infrared Radiometer (IIR); (b) vertical profile of
the CALIOP 532 nm attenuated backscatter coefficient; (c) vertical profile of the equivalent reflectivity factor from CloudSat; (d) inte-grated attenuated backscatter (log-scale); and (e) inteinte-grated depo-larization ratio. These observations are plotted along the CALIPSO track, i.e. between 48.5 and 49.5◦N across the convective system on 26 May 2007 (12:32 UTC). The shaded area indicates the active part of the overshooting cell.
in the adjacent growing clouds. IIR gives information that is exactly collocated in time and space with CALIOP infor-mation. The temperature of the cloud top deduced from the IR brightness temperature is in good agreement with the li-dar value, showing that this part of the cloud is dense. The value retrieved from the SEVIRI data (Bugliaro et al., 2011) is in good agreement with that from IIR, and offers an ex-tended swath. Lower lidar return signals are observed in the surrounding outflow cirrus layer. The integrated attenuated
backscatter (Fig. 1d) peaks up to 0.07 sr−1, a larger value
than those reported by PL in tropical MCS (i.e. 0.055 sr−1).
In the surrounding outflow cirrus, typical values range
be-tween 0.03 and 0.04 sr−1.
The integrated depolarisation ratio (Fig. 1e) changes con-currently with the largest values, increasing up to 0.54, whereas the mean value of 0.40 is observed in the sur-rounding outflow cirrus cloud. Cloud properties derived from CALIOP measurements are summarized in Table 1. As proposed by PL, we reported quantities for baseline
Table 1. Baseline and enhanced integrated attenuated backscatter values (γb0and γe0, respectively), baseline and enhanced values of isotropic backscatter-to-extinction ratio (kband ke)for η = 0.6, baseline and enhanced (or reduced) of the integrated depolarisation ratios (1band
1e), change in depolarization ratio from baseline value (d1 = 1e−1b)and cloud-top temperature (Tt). The results are reported for the two
cloud situations described in this paper (26 May 2007 and 20 June 2008).
Date γb0 γe0 kb ke 1b 1e d1 Tt
26 May 2007 0.04 0.070 0.60 1.06 0.40 0.54 +0.14 −58◦C 20 June 2008 Part A
0.03 0.043 0.45 0.65 0.38 0.44 +0.06 −75◦C 20 June 2008 Part B 0.38 0.29 −0.09
and enhanced values. The values away from the enhanced backscatter correspond to the baseline. The enhanced values are the peak values of the integrated backscatter and the peak or minimum values of the depolarization ratio. Following PL, the isotropic backscatter-to-extinction ratio (k) is calculated considering the lidar signal fully attenuated by the cloud, i.e.:
k =2ηγ0(π ), (1)
where η is the multiple scattering factor (0.6) and γ0(π )is the
integrated attenuated isotropic backscatter obtained by mul-tiplying the CALIOP integrated attenuated backscatter (IAB) by 4π . According to radiative transfer analyses, k values de-pend on the ice particle shape (Noël et al., 2004), but it has recently been found from CALIPSO observations that rela-tively constant values (k ∼ 0.40) were observed in the atmo-sphere for non-opaque ice clouds (Josset et al., 2012), pos-sibly due to mixture of particles with different shapes. The
enhanced value of ke of 1.06 in Table 1 is fairly larger than
the theoretical values provided by PL (see Table 2) for ran-domly oriented ice crystals with different shapes. This may correspond to droxtals particles (Yang et al., 2003). Infor-mation on the particle shape may also be given by the
val-ues of the integrated depolarization ratio (1e, see Table 1).
A value of 0.54 corresponds closely to the calculations by Takano and Liou (1989) for hexagonal columns. It is also
ex-pected that 1eshould also increase with cloud optical depth
and larger number of small particles due to multiple scatter-ing as in water clouds (Hu et al., 2007). Thus small particles such as frozen droplets could be mixed with larger ice crys-tals.
The in situ measurements taken near the top of the over-shooting cell (see GA) reveal unusually high values for the concentration of small ice particles, extinction and ice
wa-ter content (up to 70 cm−3, 30 km−1and 0.5 g m−3,
respec-tively). Although in situ observations were carried out 30 min after the CALIPSO overpass, these unusual microphysi-cal cloud properties may explain backscatter anomalies near the top of the overshooting cell. Chain-like aggregates of frozen droplets were the dominant form of the ice crystals (see Figs. 8 and 10 in GA) with a maximum particle size and mean effective diameter of 300 µm and 43 µm,
respec-Extinction coefficient (km-1) Reflectivity factor (dBZ) A lt it u d e ( m ) Figure 2 Extinction Reflectivity factor 0.01 0.1 1.0 10.
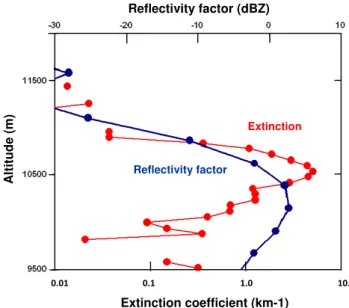
Fig. 2. Vertical profiles of the extinction coefficient and the
reflec-tivity factor at the centre of the overshooting cell (48.97◦N, see Fig. 1). 26 May 2007 cloud situation.
tively. Analysis of SEVIRI observations in the visible spec-trum gave an average particle size of about 20 µm, in good agreement with in situ observations (see GA).
Figure 2 displays the vertical profiles of the extinction co-efficient and the reflectivity factor at the centre of the
over-shooting cell (48.97◦N, see Fig. 1b). The extinction
coef-ficient was derived from the CALIOP attenuated backscat-tering profiles using the technique described by Noël et al. (2007) to retrieve extinction in the tops of deep convective clouds. The reflectivity is obtained from the 2B GEOPROF product and is available from the data processing centre (DPC) operated by the Colorado State University. The results in Fig. 2 show a sharp increase of the extinction coefficient
from the cloud top (11 000 m) to 10 450 m (up to 5 km−1),
and then the signal is rapidly attenuated at lower altitudes. The reflectivity factor reveals detectable signal (> −30 dBZ) even near the cloud top, indicating the presence of ice parti-cles large enough to be detected by CloudSat radar. Accord-ing to PL, the minimum detectable particle size is 30–40 µm
in terms of the effective radius of a distribution of equivalent-mass spheres, values which are within the range of in situ observations (see GA).
To conclude, similar backscatter anomalies as reported by PL in maritime MCS were observed for the first time near the top of an isolated continental convective cloud during the CIRCLE2 experiment. Quasi-collocated in situ observa-tions confirm that these regions represent the most active and dense convective cloud parts with likely the strongest core updrafts and unusually high values for the concentration of small ice particles, extinction and ice water content. Re-trieved extinction from lidar data analysis confirmed
unusu-ally large values near ice cloud top (in excess of 3 km−1). For
ice cloud particles with a 30 µm average diameter, this would
lead to an average number of particles of about 1000 L−1,
us-ing geometric optics approximation. Vigorous updrafts could lift supercooled droplets, which are frozen extremely rapidly
by homogeneous nucleation near the −37◦C level,
produc-ing therefore high concentrations of small ice particles at up-per altitudes. Moreover, the observed dominant ice particle shape (a chain-like aggregate of frozen droplets) is mostly observed in continental deep convective systems (Stith et al., 2002; Lawson et al., 2003; Connolly et al., 2005) which gen-erate intense electric fields causing efficient ice particle ag-gregation processes.
The next section will describe a maritime mesoscale cloud system located off the Brazilian coast on 20 June 2008 which presents similar near-cloud top backscattering anomalies.
4 Description of the 20 June 2008 maritime mesoscale convective system
For comparison purposes we looked for a case of a well-developed mesoscale convective cloud system over the trop-ical Atlantic Ocean. This system has to be observed by the CALIPSO and the CloudSat during daylight hours in order to simultaneously derive some of its parameters from vis-ible radiometry. We selected the case of the 20 June 2008 for which the CALIPSO track was very close to the centre of an active cloud cell. The CALIPSO/CloudSat satellites overpassed this mesoscale convective cloud system located
off the Brazilian coast between 0◦and 3◦N latitude at 15:43
UTC. CALIPSO and CloudSat observations reveal backscat-ter anomalies similar to those described in the isolated con-vective cloud previously analysed. This confirms the hypoth-esis that the satellites overpassed the most active parts of the MCS parts – those with the coldest temperatures (simultane-ously observed with the IIR) and with maximum cloud alti-tude.
We shall first analyse the MET-9/SEVIRI observations available in this area in order to assess the activity of the MCS in terms of cloud top temperature and altitude near the CALIPSO/CloudSat overpasses, as well as microphys-ical parameters. Then we shall discuss the active sensing
measurements, and finally we will analyse the parameters retrieved from CloudSat data (ice water content and effec-tive radius) in order to describe cloud properties at the usual cruise altitudes of commercial aircraft, which likely prevailed in the most active parts of the MCS in the mid-tropical tro-posphere.
4.1 Analysis of the MET-9/SEVIRI data
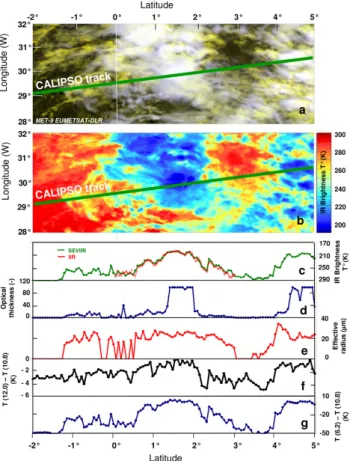
Figure 3a and b display the images of false colour compos-ites from MET-9/SEVIRI data and brightness temperature (10.8 µm channel), respectively, over the scene defined by
the range 28–32◦W longitude and −2◦ to +5◦N latitude
range (20 June 2008 at 15:45 UTC). The pixel resolution
is 3.2 × 3.1 km2at 10.8 µm wavelength and the temperature
colour scale is indicated on the right side of the figure. The quasi-collocated CALIPSO track at 15:43 UTC is superim-posed on the satellite images. The time lag between CALIOP and SEVIRI (CALIOP – SEVIRI) amounts to −2 min at
−2◦N and +7 min at 5◦N.
Figure 3c–g represent the evolution of retrieved parame-ters from SEVIRI observations along the CALIPSO track, namely: the brightness temperature in the IR channel at 10.8 µm, the optical depth, the effective radius, the differ-ences in the brightness temperatures (1BT1) between the 12.0 µm and 10.8 µm channels and the differences in the brightness temperatures (1BT2) between the 6.2 µm and 10.8 µm channels. The inversion technique of the SEVIRI spectral data has been described by Bugliaro et al. (2011) for the retrieval of the cloud properties (optical thickness, ef-fective radius, cloud water path, thermodynamic phase, top height, etc.). For validation purposes, this technique can pro-vide retrieved cloud products along polar orbiting satellite overpasses by navigating the tracks within the satellite co-ordinates. In this study, ice crystal optical properties from Baum et al. (2005a, b) have been used.
According to the temperature colour scale, the blue ar-eas in Fig. 3b roughly define the cloud clusters. The anal-ysis of the images in Fig. 3a and b clearly show an active mesoscale convective system linked to the intertropical con-vergence zone (ITCZ) usually found in the considered area
(2◦N latitude) in June (Xie and Carton, 2004). The pixels
representing the coldest areas retrieved are at 197 K (−76◦C,
see Fig. 3c) with the largest optical depths (see Fig. 3d, with 100 being the upper limit of the SEVIRI optical thickness retrieval), indicative of active updraft producing new cells at the tropopause region. Note that Fig. 3 displays an overview of the cloud situation, and that in the following we shall focus
our study on the cloud cluster located between 0◦and 3◦N
latitude (the cluster located on the right of Fig. 3 is beyond the scope of this paper).
Differences between the brightness temperatures at 12.0 and 10.8 µm (1BT1) (see Fig. 3f) show values close to 0 at the latitude of the convective cell, indicative of large cloud optical depths (as seen in Fig. 3d) or the occurrence of
Fig. 3. MET-9/SEVIRI observations on 20 June 2008 at 15:45 UTC. (a) False colour composites from SEVIRI data and (b) brightness
temperature (10.8 µm channel). The pixel resolution is 3 × 3 km2at 10.8 µm wavelength and the temperature colour scale is indicated on the right side of the figure. The quasi-collocated CALIPSO track at 15:43 UTC is superimposed on the satellite images. (c–g) Re-trieved parameters from SEVIRI observations along the CALIPSO track, namely brightness temperature in the IR channel at 10.8 µm, optical depth, effective radius, differences in the brightness temper-atures (1BT1) between the 12.0 µm and 10.8 µm channels and dif-ferences in the brightness temperatures (1BT2) between the 6.2 µm and 10.8 µm channels. Brightness temperature from the IIR imaging radiometer is superimposed on the SEVIRI retrieved temperature in
(c).
large crystals. The differences in the brightness temperatures (1BT2) between the 6.2 µm and 10.8 µm SEVIRI channels (see Fig. 3g) give information about what most likely oc-curred on the tropopause level. Because the 6.2 µm channel is more sensitive to water vapour absorption than the 10.8 µm channel, a positive 1BT2 difference means that the cloud overshoots the tropopause (Chaboureau et al., 2007). Re-sults in Fig. 3g reveal that the 1BT2 differences are quite small (±2 K) in the maximum-altitude areas of the clouds,
and are located between 1.3◦N and 1.9◦N latitude.
There-fore the active cloud cells do not overshoot the tropopause near the CALIPSO overpass. CALIOP profiles (see Fig. 4b next section) reveal apparent blow-off cirrus due to gravity
Fig. 4. As Fig. 1, but for the cloud system of 20 June 2008 (15:43
UTC). Shaded areas indicate the active parts (A and B) of the MCS. The effective radius retrieved from SEVIRI data are superimposed on the curve in (c).
wave breaking that may transport water vapour through the tropopause (Wang, 2007). Note that such cirrus clouds are not detected by the CloudSat radar (see Fig. 4c next section); this indicates the presence of small ice particles no larger than 30 µm in diameter.
To summarize, the analysis of the MET-9/SEVERI obser-vations reveals pixels along the CALIOP/CloudSat track that represent very cold areas. This is the location of the active updraft that produces new cloud material in the upper tropo-sphere. In the next section we analyse the CALIOP/CloudSat data in the same way as previously described in Sect. 3 for the continental isolated convective cloud (26 May 2007).
4.2 Analysis of CALIOP backscatter and CloudSat data
With the same presentation as in Fig. 1a–e, Figure 4a–e dis-play the IIR brightness temperature image, the vertical pro-files of the attenuated backscatter coefficient from CALIOP (log scale) and the equivalent reflectivity factor from
Cloud-Sat, along the latitude range from 0◦ to 3◦N on 20 June
2008 at 15:43 UTC. The integrated attenuated backscat-ter and the integrated volume depolarization ratio along the
latitude are also depicted in Fig. 4d and e, respectively. The results show that the system reached a maximum altitude of
about 15 700 m at two distinct locations (at ∼ 1.40◦N and
∼1.90◦N latitudes; see shaded areas labelled A and B,
re-spectively). These two cloud areas are characterized by near-top cloud backscatter anomalies where the IIR instrument measures coldest brightness temperatures (down to 198 K,
−75◦C) at 10.6 µm. For comparison purposes the IIR
bright-ness temperatures along the track have been superimposed on the SEVIRI retrieved values in Fig. 3c. The two IR brightness temperatures fit remarkably well all along the cloud cluster overpass (within ±1 K deviation) despite the different spatial resolutions; this indicates a good collocation of SEVIRI and the polar orbiting satellite data.
The integrated attenuated backscattering coefficient (Fig. 4d) peaks in the two shaded cloud areas defined above
(parts A and B) to 0.043 sr−1, a similar value to those
re-ported by PL in tropical MCS (i.e. 0.055 sr−1). Note that a
similar feature is observed between 0.6–0.9◦but for a much
lower cloud. In the surrounding outflow cirrus, the typical
value is about 0.03 sr−1. The integrated volume
depolarisa-tion ratio (1e, see Fig. 4e) changes concurrently with the
largest values of the integrated backscattering ratio, with a value increasing up to 0.44 in cloud part A and decreasing down to 0.29 in part B, whereas a mean value of 0.38 is
ob-served in the surrounding cloud clusters. Sharp 1eincreases
are observed at the northern fringes of parts A and B which reveal significant contrasts in microphysical properties, as will be discussed below. As for the 26 May 2007 situation described above, the cloud properties derived from CALIOP measurements are summarized in Table 1. Compared to the values found in the isolated continental convective cloud, the
isotropic backscatter-to-extinction ratio (ke)remains
compa-rable to values obtained by PL over the Pacific Ocean warm pool system, but is significantly lower than in the previous CIRCLE2 case (0.65 versus 1.06) as is the integrated
depo-larization ratio (1e)(0.44 and 0.29 versus 0.54). There is
an additional difference concerning part B since 1 decreases where the backscatter peaks (see Fig. 4d and e).
The value of ke of 0.65 (Table 1) could be compared
with theoretical values for randomly oriented hexagonal solid columns (0.6–0.9) provided by Takano and Liou (1995). For increasing 1 values in cloud part A, hexagonal column shaped ice crystals may be the dominant particles, which would explain the observed integrated depolarization ratio
(1e=0.44) according to the calculations by Takano and
Liou (1995) and Noël et al. (2004) – i.e. 0.55 and 0.44, re-spectively. By contrast, a significant 1 decrease (−0.09, see Table 1) is observed in part B of the cloud system. Low
1e values (0.29) may indicate hexagonal plates rather than
columns (see Fig. 1 in Noël et al., 2004). As suggested by PL, a larger number of droxtal particles may explain the low integrated depolarization ratio in the peak activity areas.
A qualitative analysis of SEVIRI images animation (every 15 min, not show here) shows that the system developed with
a weak advection in the period from 14:00 to 17:00 UTC, and that the development of new cells occurred mainly on the north side of the cluster. Therefore, part B of the cloud system (see Fig. 4) was likely a new, fresh, growing cell com-pared to the oldest cloud (part A), which has a larger horizon-tal extent (i.e. ∼ 40 km versus ∼ 20 km). Consequently, near-top cloud properties in terms of integrated depolarization ra-tios may indicate signatures of microphysical characteristics according to the cloud stage evolution. This feature is con-firmed by the effective radius retrieved from SEVIRI data
(see superimposed curve in Fig. 4e). A larger Reff (27 µm)
is observed in the fresh cloud (part B), whereas a smaller effective radius (22 µm) is found in part A. It is interesting to note that much smaller ice particles have been retrieved
(Reff ∼15 µm) near the top of the isolated continental
con-vective cloud described in Sect. 3 (see also Fig. 6 in GA). This is a consistent feature regarding maritime/continental cloud microphysical properties (see among others Rosen-feld and Lensky, 1998). Finally, even in the likely fresh con-vective cell (part B), the CloudSat radar reflectivity profile
(with the corresponding extinction coefficient) at 1.840◦N
latitude (see Fig. 5) indicates the presence of ice particles large enough to be detected up to the cloud top identified by lidar. A similar feature is observed in part A.
To summarize, the backscatter anomalies reported on 20 June 2008 in the oceanic tropical MCS confirm the obser-vations by PL, but reveal significant differences of near-top cloud properties to those observed in the continental isolated convective system (CIRCLE2, 26 May 2007 situation). In or-der to explain the decrease of the depolarization ratio, PL as-sume a greater preponderance of frozen droplets or small ice crystals in the peak activity area. This hypothesis is based on previous works on subtropical and tropical convection (Heymsfield et al., 2005a, 2006) and even in maritime tropi-cal convective updrafts (Heymsfield et al., 2009). Many small particles of frozen droplets or ice crystals (possibly droxtals, Yang et al., 2003) are mixed with less numerous larger ice crystals with different shapes (hexagonal columns, plates, ir-regular, see Noël at al., 2004). The smaller ice crystals con-tribute to high CALIOP extinction values (see GA) whereas CloudSat, which is sensitive to large particles only, reveals the presence of larger ice crystals lofted to the cloud top. In other words, the CALIPSO and CloudSat satellites over-passed the most active MCS region with likely the strongest updrafts. This region corresponds to the coldest temperatures and with maximum cloud top altitudes derived from MET-9/SEVIRI data.
5 Retrieved MCS cloud properties at usual cruise altitudes of commercial aircraft
In this section the cloud ice water content (IWC) and
effec-tive radius (Reff) retrieved with both the CloudSat 2B-IWC
Extinction coefficient (km-1) Reflectivity factor (dBZ) A lt it u d e ( m ) -30 -20 -10 0 10 20 0.001 0.01 0.1 1. 10. 16000 15000 14000 13000 Extinction Reflectivity factor Figure 5
Fig. 5. Same as Fig. 2, but for profiles obtained at the centre of part
B of the convective cell (1.840◦N, see Fig. 4) for the 20 June 2008 MCS.
the DARDAR (raDAR/liDAR, called DAR hereafter) ice-cloud products (Delanoë and Hogan, 2008, 2010) are anal-ysed.
The C2B retrieval is designed to use CloudSat Radar (CPR) radar reflectivity and visible optical depth if both data streams are available. The source for the visible optical depth is the MODIS (Moderate Resolution Imaging Spectro-radiometer) instrument on the Aqua platform. The retrieval technique described in detail by Benedetti et al. (2003) was adapted from the study by Austin and Stephens (2001). This technique is based on minimization of a cost function which calculates the distance between the model-derived and the observations variables. The forward model is assumed to de-scribe cirrus size spectra via a modified gamma size distri-bution (Stephens et al., 1990). The model equivalent radar reflectivities in the Rayleigh regime and the visible optical depth are computed using analytical expressions from two parameters of the size distribution, i.e. the mean size and the number concentration. The radar reflectivities are corrected for non-Rayleigh and density effects. When ice particles are sampled, a constant correction factor (K) is introduced since radar reflectivity is conventionally defined with respect to water (equivalent radar reflectivity). The factor K introduces the implicit assumption that the density of ice crystals is constant, and is prescribed by size–density relationships pro-posed by Brown and Francis (1995) and Matrosov (1999).
The DAR technique is a synergistic product, combining the CloudSat radar and CALIOP lidar measurements. This synergy retrieval is based on the optimal estimation frame-work (Rodgers, 2000); it allows one to retrieve ice cloud properties seamlessly while accounting for instrumental ran-dom errors. For instance, cloud properties are retrieved when lidar and/or radar measurements are available. The main ad-vantage of this method is to characterize cloud properties of
A lt it u d e ( k m ) 16 14 12 10 8 20 10 0 - 10 - 30 CloudSat reflectivity - 20 0.1 0.01 1. 10. 6 150. 100. 50. 0. 0 0.5 1.0 1.5 2.0 2.5 3.0 Latitude (°N) Figure 6 a b c FL 350 R e fl e c ti v it y fa c to r (d B Z ) Effective Radius (µµµµm) C2B DAR Ice Water Content (g m-3) C2B DAR MH c b
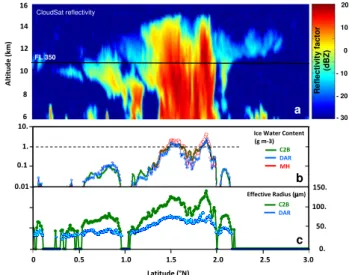
Fig. 6. (a) Vertical profiles of the equivalent reflectivity factor from
CloudSat. (b, c) Variations of the retrieved IWC (log scale) and ef-fective radius, respectively, along the 10 700 m level. IWC is re-trieved from both the CloudSat 2B-IWC (C2B, green curve) and DARDAR (DAR, blue symbols) algorithms and from the relation-ship proposed by Matrosov and Heymsfield (2008) (MH; red sym-bols for reflectivities > 0 dBZ).
types ranging from thin cirrus (using lidar when radar sensi-tivity is limited) to very deep ice clouds (using radar when lidar is extinguished). In the optimal estimation framework a forward model is required to convert cloud properties in radar and lidar measurements. One starts with a first guess of the cloud properties, for example a constant value of ex-tinction and number concentration. The values are converted into synthetic measurements, which are compared to the real measurements. Then, using an iteration process, one min-imizes the differences (in the least square sense) between real and simulated measurements. The forward model as-sumes that the particles are mainly aggregates (adapted from Brown and Francis, 1995; Mitchell, 1996) and their distri-bution is represented with the normalized particle size dis-tribution (PSD) approach (Delanoë et al., 2005). Mass–size relationships are identified accordingly (Delanoë and Hogan, 2008). This technique allows one to link, in an efficient way, the different moments of the PSD, and therefore the cloud properties, to the measurements. Therefore cloud parameters
such as IWC and Reffare retrieved at each radar and/or lidar
gate (60 m vertical resolution).
5.1 Ice water content
In Fig. 6a, the vertical profiles of equivalent reflectivity fac-tor from CloudSat along the orbit are displayed again (20 June 2008, 15:43 UTC) in order to facilitate the discussion of the results. We recall that the resolution of the pixels is 250 m (vertical) × 2500 m (horizontal). The black line in Fig. 6a indicates the 10 700 m altitude which corresponds
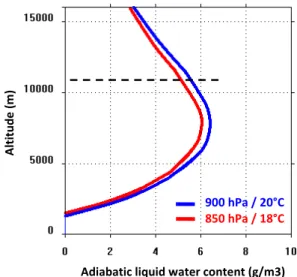
Adiabatic liquid water content (g/m3) A lt it u d e ( m ) 900 hPa / 20°C 850 hPa / 18°C Figure 7
Fig. 7. Profiles of the theoretical adiabatic liquid water content
(LWC), assuming the most likely thermodynamic properties of the cloud base (900 hPa/20◦C and 850 hPa/18◦C) obtained from the CALIPSO additional meteorological parameters.
to the usual flight level (FL 350 or 35 000 feet) of com-mercial aircraft. Figure 6b displays the variation of the C2B and DAR-retrieved IWCs at this level. Due to the log-scale presentation, the differences between the two satellite re-trievals are not well evidenced but they will be detailed be-low (Fig. 8). The main feature of the results can be summa-rized as follows: the cluster extends from a latitude of about
0.5◦N to 2.5◦N (∼ 220 km) with the core of the system
ob-served between a latitude of 1.5◦N and 2.0◦N (∼ 55 km).
As already discussed in the previous section, ice particles are large enough to be detected by CloudSat, with signif-icant IWC up to the top of cloud core observed concur-rently with backscatter anomalies and the lowest tempera-tures (see Fig. 5). Indeed, reflectivities up to 3 dBZ and
sub-sequent IWC of ∼ 0.5 g m−3are observed 1000 m below the
cloud top. At the 10 700 m level, IWCs remain quite low
(∼ 0.1 g m−3)until a latitude of 1.3◦N, and then significantly
increases in the cloud core along the considered altitude.
IWC values remain larger than 1.0 g m−3for 55 km (which
represents a flight duration of about 4:30 min with an
air-speed of Mach 0.80) and peaks at 2.0–2.5 g m−3. Because the
horizontal resolution of retrieved products is 2.5 km, higher IWC values on smaller scales may be encountered. The cloud particles are likely to be ice crystals since the temperature
of −40◦C at 10 700 m (CALIPSO additional meteorological
parameters) is below the temperature for which the super-cooled liquid water droplets freeze by homogeneous
nucle-ation (−37◦C).
Figure 7 displays the theoretical adiabatic liquid water content (LWC) assuming the most likely thermodynamic
properties of the cloud base (900 hPa/20◦C or 850 hPa/18◦C
obtained from CALIPSO additional meteorological
parame-ters). A maximum adiabatic LWC of ∼ 5.0 g m−3is found at
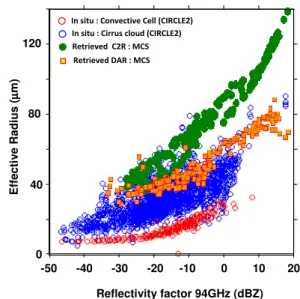
Reflectivity factor 94 GHz(dBZ) L o g1 0 (I W C ) (g /m 3 ) -50 40 -30 -20 -10 0 10 20 1 0 -1 -2 -3 -4 Sayres et al. (2008) Figure 8 In situ : Convective Cell (CIRCLE2)
In situ : Cirrus cloud (CIRCLE2) Retrieved C2R : MCS Retrieved DAR : MCS
Matrosov and Heymsfield (2008) Protat et al. (2007)
Fig. 8. Retrieved IWC–Z relationship obtained from both the
CloudSat 2B-IWC (green symbols) and DARDAR (yellow sym-bols) algorithms for 10 700 m (FL350) in the MCS system on 20 June 2008. IWC–Z relationships obtained from in situ observations on 26 May 2007 for continental isolated convective cloud and the outflow cirrus observations are red and blue symbols, respectively. The relationships proposed by Matrosov and Heymsfield (2008), Protat et al. (2007) and Sayres et al. (2008) are reported.
10 700 m altitude. The retrieved high ice water contents (up
to 2.0–2.5 g m−3)are smaller than the maximum value of the
theoretical adiabatic LWC at 10 700 m (∼ 5.0 g m−3)which
could be explained by entrainment of dry environmental air around the cluster and/or by precipitation removing signifi-cant amounts of cloud water.
However, it is well-known that cloud ice content estimates can have uncertainties as large as a factor of 2 (see, among others, Heymsfield et al., 2005b). For instance, much larger IWC is obtained (see superimposed red points on the results
in Fig. 6b) with a maximum of 4 g m−3 (rather close to the
adiabatic value) if we consider the relationship between W band radar reflectivity and ice cloud content proposed by Ma-trosov and Heymsfield (2008, called MH hereafter) for high-reflectivity clouds. Their relationship accounts for the parti-cle aspect ratio and for the non-sphericity of larger partiparti-cles via mass–size relation assumptions.
In order to check the consistency of the results, the re-trieved IWC–Z relationships obtained at 10 700 m in the MCS system (20 June 2008) are displayed in Fig. 8 (green and yellow symbols for C2B and DAR, respectively) to-gether with the relationships proposed by Protat et al. (2007) from mid-latitude and tropical field campaigns, by Sayres et al. (2008) in tropical anvils during CRYSTAL-FACE (dashed lines) and by Matrosov and Heymsfield (2008, unbroken line) discussed above.
A careful examination of the retrieved IWC dispersion shows that C2B overestimates DAR by up to 50 % for
IWC less than 0.6 g m−3 as already discussed in Protat et
al. (2010a) and Delanoë et al. (2013). Consequentially, for larger IWC, the agreement between the two methods is within ±25 %. The retrieved IWC–Z scatterplots (C2B and DAR) are roughly consistent with experimental relationships from Protat et al. (2007) and Sayres et al. (2008) with a
maximum IWC of 2.0–2.5 g m−3 for a radar reflectivity of
18 dBZ. Larger discrepancies are observed when consider-ing the MH relationship in regions of radar reflectivity at 94 GHz exceeding about 5 dBZ with a maximum retrieved
IWC of 4.0 g m−3at 18 dBZ. Discussing their experimental
relationship, MH emphasize that the data scatter for IWC–Z relationship becomes progressively smaller as reflectivity in-creases (see their Fig. 4). The same scatter plot convergence at larger values is observed for different data sets originating from various cloud types and geographical regions. MH con-cluded that the derived relationships are likely to be applica-ble to a wide variety of precipitating cloud systems, although significant differences in cloud properties could be expected between MCS and continental clouds because of different aerosol inputs and dynamical properties (weaker updrafts in maritime MCS, Mason et al., 2006), etc.
Therefore, the relationships obtained from in situ observa-tions related to the outflow cirrus observaobserva-tions and the con-tinental isolated convective cloud obtained on 26 May 2007 (CIRCLE2, blue and red symbols, respectively) have been reported in Fig. 8. Despite large uncertainties about
quantita-tive values of microphysical parameters (IWC, Reff, Z, etc.)
derived from in situ instruments (see below), the results in Fig. 8 show that the retrieved IWC–Z relationships (C2B and DAR) roughly fit the in situ observations (blue symbols) re-lated to outflow cirrus (for Z < 10 dBZ). This is a consistent feature since the retrieving techniques use forward model as-sumptions mainly based on experimental results obtained in anvils and/or outflow cirrus.
By contrast, for the core of the convective cell (red sym-bols in Fig. 8), it is found that the IWC–Z relationship would produce much larger IWC (by about one order of magnitude) than the more standard relationships. This feature is of cru-cial importance for aircrafts and may be explained as follows. i. The in situ observations performed very near the top of the core of the overshooting cell revealed numer-ous small chain-like aggregate crystals (leading to backscatter anomalies), whereas larger bullet-rosette particles were observed in the adjacent cirrus. There-fore the large differences between the red and blue IWC–Z in situ measurements in Fig. 8 are due to the different mass–size relationships related to the subse-quent ice particle shapes (see Fig. 9 in GA). This result needs to be confirmed by additional observations be-cause only a few data are available in such conditions (Stith et al., 2013).
ii. Significant shortcomings occur in IWC and Z deriva-tions from in situ measurements; these are mainly due
E ff e c ti v e R a d iu s ( µµµµ m ) Reflectivity factor 94GHz (dBZ) -50 -40 -30 -20 -10 0 10 20 120 80 40 0 Figure 9 In situ : Convective Cell (CIRCLE2)
In situ : Cirrus cloud (CIRCLE2) Retrieved C2R : MCS Retrieved DAR : MCS
Fig. 9. Same as Fig. 8. Reff-Z relationships.
to particle aspect ratio and ice density effects which are poorly described and non-sphericity via mass–size relationship assumptions. As discussed by Heymsfield et al. (2008) by testing 10 retrieval methods, IWC re-trievals in regions of radar reflectivity at 94 GHz ex-ceeding about 5 dBZ are subject to uncertainties of 50 %. They are explained by the use of the Rayleigh approximation (e.g. assuming that the particle size is much smaller than the wavelength – 3.2 mm at 94 GHz –) at high reflectivities in some of the algorithms and the differences in the way non-spherical particles and Mie effects are considered.
iii. Systematic errors regarding in situ measurements due to the contamination by the shattering of larger ice crystals on the probe tips may result in artificially high concentrations of small ice crystals with subsequent high extinction coefficients and low effective radii (see, for instance, Korolev and Isaac, 2005; Lawson et al., 2006; Heymsfield, 2007; Protat et al., 2010b). The great variability of the results in Fig. 8 (in situ obser-vations, retrieved values, experimental relationships) lead to the conclusion that there are combined shortcomings in the derivation of the microphysical parameters which seriously hamper the quantitative interpretation of the results, particu-larly in the denser part of the overshooting cell. At the time of this study, IWC-Z relationships are not yet available to de-scribe the core of deep various (continental/maritime) MCS with the use of new generation of cloud instruments. These instruments have specially designed tips and electronics that may now provide much more accurate in situ measurements (see for instance, Korolev et al., 2013).
5.2 Effective radius
Figure 6c displays the variations of the C2B-retrieved
ef-fective radius (Reff) and DAR-retrieved (Reff) along the
lati-tude at the 10 700 m level. It is found that the C2B effective radii are systematically about 30 % larger than the DAR ones. DAR effective radii fluctuate between 40 and 55 µm up to the
latitude of 1.3◦N, then increase in the cloud core to about
60 µm and reach 80 µm concurrently with the highest IWC values (see Fig. 6b). The comparisons with in situ measure-ments in Fig. 9 (with the same representation and symbols as in Fig. 8) show that the C2B retrieved effective radii are a factor of about 2 larger than values obtained for the out-flow cirrus observations (blue symbols). DAR effective radii are distributed closer to the in situ observations. Several hy-potheses may explain these differences:
i. Accurate in situ measurements of particle effective radius are not available in MCS clusters. Such data obtained with a new generation of instruments (see above) will improve the comparisons of the retrieved
Reffwithin the IWC–Z relationships.
ii. As discussed above, in situ measurements may be con-taminated by the shattering of larger ice crystals on the probe tips, resulting in systematic errors with artifi-cially high concentrations of small ice crystals with ar-tificially low effective radii. As discussed in GA, there are still large uncertainties regarding the magnitude of the contribution of these small ice crystals to the bulk microphysical properties.
iii. Large errors may arise from uncertainties of the forward model used for the inversion techniques (Benedetti et al., 2003). Among the factors that may contribute to these errors is the choice of size distri-bution and related parameters. If such a distridistri-bution is completely unrepresentative of real clouds, this can degrade the accuracy of the solution. For instance, bi-modal spectra are often observed in warm thick mid-latitude cirrus (Ivanova et al., 2001) making the as-sumption of a monomodal gamma distribution unreal-istic. Likewise, a worse parameter-description of small ice crystals could lead to oversized retrieved particles. Uncertainties due to non-sphericity of the ice crystals and ice densities (Mitchell et al., 1990) could also be important.
6 Discussion and conclusions
Two complementary case studies have been presented to analyse the properties of convective systems in the region where strong cloud-top backscatter anomalies are observed as reported by PL. These anomalies are observed for the first time in an isolated continental convective cloud over Germany during the CIRCLE2 experiment (26 May 2007).
Quasi-collocated in situ observations confirm that these re-gions represent the most active and dense convective cloud parts with likely the strongest core updrafts and unusually high values for the concentration of small ice particles, ex-tinction and ice water content. Moreover, the theoretical shape derived from CALIOP data interpretation may roughly fit with the observed dominant ice particle shape (chain-like aggregate).
Similar spaceborne data are observed in a maritime mesoscale cloud system (MCS) on the 20 June 2008 located
off the Brazilian coast between 0◦ and 3◦N latitude. The
analysis of the MET-9/SEVIRI observations reveals pixels along the collocated CALIPSO/CloudSat track (a time lag of max 3 min) that represent cold areas. This is the area of ac-tive updraft that produces new dense cloud material in the upper troposphere. This feature is confirmed by concurrent near cloud-top backscatter anomalies from CALIOP data and CloudSat reflectivities. Near-top cloud properties in terms of integrated depolarization ratios (1) may indicate signa-tures of microphysical characteristics. They are found to be significantly different from those observed in the continen-tal isolated convective cloud. Indeed, SEVIRI retrievals con-firm much smaller ice particles near the top of the isolated
continental convective cloud, i.e. Reff∼15 µm versus 22–
27 µm in the MCS. Near-top cloud properties may also indi-cate signatures of microphysical characteristics according to the cloud-stage evolution, as revealed by SEVIRI images, to identify the development of new cells within the MCS clus-ter. For instance, randomly oriented solid columns may ex-plain increasing 1 values in older cloud cells. By contrast, a significant 1 decrease is observed in new dense clouds that may indicate hexagonal plates rather than columns and a greater number of droxtal particles in the peak activity areas (Platt et al., 2011). This feature is confirmed by the effec-tive radius retrieved from SEVIRI data. Larger effeceffec-tive radii (27 µm) are observed in the fresh cloud whereas smaller ef-fective radii are found in older cell.
CloudSat and CALIPSO observations are used to describe the cloud properties which likely prevailed in the most active MCS region with the strongest updrafts at the usual cruise altitudes of commercial aircraft (10 700 m/FL 350 or above). Cloud ice water content (IWC) and effective radii have been estimated from the satellite observations using both the CloudSat 2B-IWC and DARDAR retrieval techniques. At the considered altitude, IWC significantly increases in the cloud core concurrently with backscatter anomalies and the pres-ence of the lowest temperatures. IWC values remain larger
than 1.0 g m−3for 55 km (which represents a flight duration
of about 4:30 min with an airspeed of Mach 0.80) and peaks
at 2.0–2.5 g m−3or even more (4 g m−3), according to
differ-ent IWC–Z relationships. This range of deviation illustrates shortcomings in both IWC retrievals for high-reflectivity clouds (due to Rayleigh approximation, non-spherical ice particles, multiple scattering and Mie effects, see Battaglia et al., 2011) and IWC estimates from in situ measurements
(due to particle aspect ratio effects and non-sphericity for large particles via mass–size relationship assumptions). Be-cause the pixel horizontal resolution of retrieved products is 2.5 km, higher IWC values at smaller scales could be encoun-tered. The retrieved IWC–Z relationships from the CloudSat 2B-IWC and DARDAR retrieval techniques are roughly con-sistent with in situ observations in the outflow cirrus region (CIRCLE2 data). It should be noticed that at the considered
altitude, the temperature (−40◦C) is lower than the
tempera-ture at which the supercooled liquid water droplets freeze by
homogeneous nucleation (−37◦C), and the cloud particles
are likely pure ice crystals. The vertical velocity in the ac-tive MCS region may lead to a rapid freezing of the droplets, leading in turn to a large number of small-sized particles.
The retrieved effective radius (DARDAR Reff) increases
in the cloud core to about 60 µm and reaches 80 µm concur-rently with the highest IWC values. The comparisons with in situ observations in cirrus ice clouds show systematically
larger retrieved Reff. Several hypotheses may explain these
differences:
i. Systematic errors regarding in situ measurements due to the contamination by the shattering of larger ice crystals on the probe tips, resulting in artificially high concentrations of small ice crystals with high extinc-tion coefficients and low effective radii.
ii. Large errors may arise from uncertainties in the for-ward model used for the CloudSat inversion. Among the factors that may contribute to these errors is the choice of size distribution and parameters related to this size distribution. Likewise, a worse parameter-description of small ice crystals could lead to over-sized retrieved particles, and uncertainties due to non-sphericity of the ice crystals and ice densities could also be important.
To conclude, quite high IWC (within a range between from
2 to 4 g m−3 according to the specific IWC–Z relationship
derived from in situ measurements) could be encountered at the usual cruise altitudes of commercial aircraft. These val-ues appear to correspond in the active MCS region to a max-imum reflectivity factor of 18 dBZ (at 94 GHz). Because the radar reflectivity depends on the sixth moment of the size dis-tribution, the particle size is a critical parameter for which the measurement accuracy must be considerably improved. A new generation of cloud instruments with specially designed tips and electronics may now provide much more accurate in situ measurements (see, for instance, Korolev et al., 2013). In the same way, relevant IWC–Z relationships should be obtained in order to describe the core of deep MCS. To com-plete this study, the analysis of radar echoes obtained simul-taneously by radars at 94 GHz and 35 GHz (onboard radars) in ice clouds with different properties would be important to assess more relevant IWC–Z relationships.
Finally, it is argued that the availability of real-time in-formation of the kilometre-scale cloud top IR brightness temperature decrease with respect to the cloud environment would help identify MCS cloud areas with potentially high ice water content and small particle sizes to which onboard meteorological radars may not be sensitive enough in order to be able to provide timely warning. Researchers could ex-amine this in future studies by generalizing the results from a statistical approach and by considering relevant criteria, such as optical depth and/or brightness temperature differ-ences (see Fig. 3d and f, respectively) to identify these MCS cloud areas.
Acknowledgements. We acknowledge NASA Langley Research
Atmospheric Science Data Center for the CALIPSO data, as well the CloudSat Data Processing Center at the Colorado State Univer-sity as well as ICARE Centre in Lille for the CALIPSO/CloudSat data. The support of CNES is also acknowledged. SEVIRI data operationally distributed by EUMETSAT Data Centre have been processed at DLR. J.-F. Gayet is grateful to DLR for having provided a guest scientist opportunity at the Institut für Physik der Atmosphäre during this study. The authors would like to thank the three anonymous reviewers for their suggestions and helpful comments.
Edited by: G. Vaughan
The publication of this article is financed by CNRS-INSU.
References
Austin, R. T. and Stephens, G. L.: Retrieval of stratus cloud mi-crophysical parameters using millimeter-wave radar and visible optical depth in preparation for CloudSat: 1. Algorithm formula-tion, J. Geophys. Res., 106, 28233–28242, 2001.
Battaglia, A., Augustynek, T., Tanelli, S., and Kollias, P.: Multi-ple scattering identification in spaceborne w-band radar measure-ments of deep convective cores, J. Geophys. Res., 116, D19201, doi:10.1029/2011JD016142, 2011.
Baum, B. A., Heymsfield, A. J., Yang, P., and Bedka, S. T.: Bulk Scattering Properties for the Remote Sensing of Ice Clouds. Part I: Microphysical Data and Models, J. Appl. Meteor., 44, 1885– 1895, doi:10.1175/JAM2308.1, 2005a.
Baum, B. A., Yang, P., Heymsfield, A. J., Platnick, S., King, M. D., Hu, Y.-X., and Bedka, S. T.: Bulk scattering properties for the remote sensing of ice clouds. Part II: Narrowband models, J. Appl. Meteor., 44, 1896–1911, doi:10.1175/JAM2309.1, 2005b. Benedetti, A., Stephens, G. L., and Haynes, J. M.: Ice cloud mi-crophysics retrievals from millimeter radar and visible optical depth using an estimation theory approach, J. Geophys. Res., 108, 4335, doi:10.1029/2002JD002693, 2003.
Brown, P. R. A. and Francis, P. N.: Improved measurements of the ice water content in cirrus using a total-water probe, J. Atmos. Oceanic Technol., 12, 410–414, 1995.
Bugliaro, L., Zinner, T., Keil, C., Mayer, B., Hollmann, R., Reuter, M., and Thomas, W.: Validation of cloud property retrievals with simulated satellite radiances: a case study for SEVIRI, Atmos. Chem. Phys., 11, 5603–5624, doi:10.5194/acp-11-5603-2011, 2011.
Chaboureau, J.-P., Cammas, J.-P., Duron, J., Mascart, P. J., Sitnikov, N. M., and Voessing, H.-J.: A numerical study of tropical cross-tropopause transport by convective overshoots, Atmos. Chem. Phys., 7, 1731–1740, doi:10.5194/acp-7-1731-2007, 2007. Connolly, P. J., Saunders, C. P. R., Gallagher, M. W., Bower, K.
N., Flynn, M. J., Choularton, T. W., Whiteway, J., and Lawson, R. P.: Aircraft observations of the influence of electric fields on the aggregation of ice crystals, Q. J. Roy. Meteorol. Soc., 131, 1695–1712, 2005.
Delanoë, J. and Hogan, R. J.: A variational scheme for re-trieving ice cloud properties from combined radar, lidar, and infrared radiometer, J. Geophys. Res., 113, D07204, doi:10.1029/2007JD009000, 2008.
Delanoë, J. and Hogan, R. J.: Combined CloudSat-CALIPSO-MODIS retrievals of the properties of ice clouds, J. Geophys. Res., 115, D00H29, doi:10.1029/2009JD012346, 2010. Delanoë, J., Protat, A., Testud, J., Bouniol, D., Heymsfield, A. J.,
Banseme,r A., Brown, P. R. A., and Forbes, R. M.: Statistical properties of the normalized ice particle size distribution, J. Geo-phys. Res., 110, D10201, doi:10.1029/2004JD005405, 2005. Delanoë, J., Protat, A., Jourdan, O., Pelon, J., Papazzoni, M.,
Dupuy, R., Gayet, J.-F., and Jouan, C.: Retrieval of polar ice cloud properties using RALI platform during POLARCAT cam-paign, J. Atmos. Ocean. Tech., 30, 57–73, doi:10.1175/JTECH-D-11-00200.1, 2013.
Eichler, H., Ehrlich, E., Wendisch, M., Mioche, G., Gayet, J.-F., Wirth, M., Emde, C., and Minikin, A.: Influence of ice crystal shape on retrieval of cirrus optical thickness and ef-fective radius: A case study, J. Geophys. Res., 114, D19203, doi:10.1029/2009JD012215, 2009.
Garnier, A., Pelon, J., Dubuisson, P., Faivre, M., Chomette, O., Pascal, N., and Kratz, D. P.: Retrieval of cloud properties us-ing CALIPSO Imagus-ing Infrared Radiometer, Part 1: effective emissivity and optical depth, J. Appl. Meteorol. Clim., 51, 1407– 1425, doi:10.1175/JAMC-D-11-0220.1, 2012.
Gayet, J.-F., Mioche, G., Bugliaro, L., Protat, A., Minikin, A., Wirth, M., Dörnbrack, A., Shcherbakov, V., Mayer, B., Garnier, A., and Gourbeyre, C.: On the observation of unusual high con-centration of small chain-like aggregate ice crystals and large ice water contents near the top of a deep convective cloud during the CIRCLE-2 experiment, Atmos. Chem. Phys., 12, 727–744, doi:10.5194/acp-12-727-2012, 2012.
Heymsfield, A. J.: On measurements of small ice particles in clouds, Geophys. Res. Lett., 34, L23812, doi:10.1029/2007GL030951, 2007.
Heymsfield, A. J. and Palmer, A.: Relationship for deriving thun-derstorm anvil ice mass for CCOPE storm weather estimates, J. Clim. Appl. Meteor., 25, 691–702, 1986.
Heymsfield, A. J., Miloshevich, L. M., Schmitt, C., Bansemer, A., Twohy, C., Poellot, M. R., Fridlind, A., and Gerber, H.: Homoge-neous ice nucleation in subtropical and tropical convection and
its influence on cirrus anvil microphysics, J. Atmos. Sci., 62, 41– 64, 2005a.
Heymsfield, A. J., Wang, Z., and Matrosov, S.: Improved Radar Ice Water Content Retrieval Algorithms Using Coincident Micro-physical and Radar Measurements, J. Appl. Meteor., 44, 1391– 1412, 2005b.
Heymsfield, A. J., Bansemer, A., Durden, S. L., Herman, R. L., and Bui, T. P.: Ice microphysics observations in Hurricane Hum-berto: Comparison with non-hurricane-generated ice cloud lay-ers, J. Atmos. Sci., 63, 288–308, 2006.
Heymsfield, A. J., Protat, A., Bouniol, D., Austin, R. T., Hogan, R. J., Delanoë, J., Okamoto, H., Sato, K., van Zadelhoff, G.-J., Donovan, D. P., and Wang, Z.: Testing IWC retrieval methods using radar and ancillary measurements with in situ data, J. Appl. Meteor. Climatol., 47, 135–163, 2008.
Heymsfield, A. J., Bansemer, A., Heymsfield, G., and Fierro, A. O.: Microphysics of Maritime Tropical Convective Updrafts at Temperatures from −20 to −60◦C, J. Atmos. Sci., 66, 3530– 3562, 2009.
Hu, Y.: Depolarization ratio-effective lidar ratio relation: theoretical basis for space lidar cloud phase discrimination, Geophys. Res. Lett., 34, L11812, doi:10.1029/2007GL029584, 2007.
Hunt, W. H, Winker, D. M., Vaughan, M. A., Powell, K. A., Lucker, P. L., and Weimer, C.: CALIPSO Lidar Description and Per-formance Assessment, J. Atmos. Ocean Tech., 26, 1214–1228, doi:10.1175/2009JTECHA1223.1, 2009.
Ivanova, D., Mitchell, D. L., Arnott, W. P., and Poellot, M.: A GCM parameterization for bimodal size spectra and ice mass removal rates in midlatitude cirrus clouds, Atmos. Res., 59–60, 89–113, 2001.
Josset, D., Pelon, J., Garnier, A., Hu, Y., Vaughan, M., Zhai, P.-W., Kuehn, R., and Lucker, P.: Cirrus optical depth and li-dar ratio retrieval from combined CALIPSO-CloudSat observa-tions using ocean surface echo, J. Geophys. Res., 117, D05207, doi:10.1029/2011JD016959, 2012.
Korolev, A. V. and Isaac, G. A.: Shattering during sampling by OAPs and HVPS, Part I: Snow particles, J. Atmos. Ocean Tech., 22, 528–543, 2005.
Korolev, A. V., Emery, E. F., and Creelman, K.: Modification and tests of particle probe tips to mitigate effects of ice shattering, J. Atmos. Ocean. Tech., 30, 690–708, doi:10.1175/JTECH-D-12-00142.1, 2013.
Lawson, R. P., Angus, L. G., and Heymsfield, A. J.: Cloud parti-cle measurements in thunder storm anvils and possible weather threat to aviation, J. Aircraft, 35, 113–121, 1998.
Lawson, R. P., Baker, B. A., Schmitt, C. G., and Jensen, T. L.: In situ measurements of microphysical properties of mid-latitude and anvil cirrus and validation of satellite retrievals’. Paper no. TS 32.4, Proceedings of 30th International conference on re-mote sensing of environment, Honolulu, Hawaii, http://www. symposia.Org/proceedings.htm, 2003.
Lawson, R. P., O’Connor, D., Zmarzly, P., Weaver, K., Baker, B. A., Mo, Q., and Jonsson, H.: The 2D-S (Stereo) probe: De-sign and preliminary tests of a new airborne, speed, high-resolution imaging probe, J. Atmos. Ocean. Technol., 23, 1462– 1477, doi:10.1175/JTECH1927.1, 2006.
Lawson, R. P., Jensen, E., Mitchell, D. L., Baker, B., Mo, Q., and Pilson, B.: Microphysical and radiative properties of tropical