HAL Id: hal-00296553
https://hal.archives-ouvertes.fr/hal-00296553
Submitted on 22 May 2008
HAL is a multi-disciplinary open access
archive for the deposit and dissemination of
sci-entific research documents, whether they are
pub-lished or not. The documents may come from
teaching and research institutions in France or
abroad, or from public or private research centers.
L’archive ouverte pluridisciplinaire HAL, est
destinée au dépôt et à la diffusion de documents
scientifiques de niveau recherche, publiés ou non,
émanant des établissements d’enseignement et de
recherche français ou étrangers, des laboratoires
publics ou privés.
Asian dust storm influence on North American ambient
PM levels: observational evidence and controlling factors
T. L. Zhao, S. L. Gong, X. Y. Zhang, D. A. Jaffe
To cite this version:
T. L. Zhao, S. L. Gong, X. Y. Zhang, D. A. Jaffe. Asian dust storm influence on North American
am-bient PM levels: observational evidence and controlling factors. Atmospheric Chemistry and Physics,
European Geosciences Union, 2008, 8 (10), pp.2717-2728. �hal-00296553�
© Author(s) 2008. This work is distributed under the Creative Commons Attribution 3.0 License.
Chemistry
and Physics
Asian dust storm influence on North American ambient PM levels:
observational evidence and controlling factors
T. L. Zhao1, S. L. Gong1,2, X. Y. Zhang2, and D. A. Jaffe3
1Air Quality Research Division, Science and Technology Branch, Environment Canada, 4905 Dufferin Street, Toronto, Ontario, M3H 5T4, Canada
2Centre for Atmosphere Watch and Services of CMA, Chinese Academy of Meteorological Sciences, Beijing 100081, China 3University of Washington-Bothell, 18115 Campus Way NE, Bothell, WA 98011-8246, USA
Received: 5 April 2007 – Published in Atmos. Chem. Phys. Discuss.: 4 July 2007 Revised: 25 March 2008 – Accepted: 7 May 2008 – Published: 22 May 2008
Abstract. New observational evidence of the trans-Pacific
transport of Asian dust and its contribution to the ambi-ent particulate matter (PM) levels in North America was re-vealed, based on the interannual variations between Asian dust storms and the ambient PM levels in western North America from year 2000 to 2006. A high correlation was found between them with an R2value of 0.83. From analysis of the differences in the correlation between 2005 and 2006, three factors explain the variation of trans-Pacific transport and influences of Asian dust storms on PM levels in western North America. These were identified by modeling results and the re-analysis data. They were 1) Strength of frontal
clones from Mongolia to north eastern China: The frontal
cy-clones in East Asia not only bring strong cold air outbreaks, generating dust storms in East Asia, but also lift Asian dust into westerly winds of the free troposphere for trans-Pacific transport; 2) Pattern of transport pathway over the North
Pa-cific: The circulation patterns of westerlies over the North
Pacific govern the trans-Pacific transport pattern. Strong zonal airflow of the westerly jet in the free troposphere over the North Pacific favor significant trans-Pacific transport of Asian dust; 3) Variation of precipitation in the North Pacific: The scavenging of Asian dust particles by precipitation is a major process of dust removal on the trans-Pacific transport pathway. Therefore, variation of precipitation in the North Pacific could affect trans-Pacific transport of Asian dust.
Correspondence to: S. L. Gong
1 Introduction
Dust aerosols transported from Asia to North America have been observed at surface observation stations and by satel-lites (Jaffe et al., 1999; McKendry et al., 2001; Prospero et al., 1989; VanCuren, 2003; Wilkening et al., 2000). On 15 April 1998, a dust storm in Asia produced a huge at-mospheric dust cloud that was transported across the Pa-cific Ocean and which caused elevated aerosol concentra-tions over much of the Pacific Coast of North America (Husar et al., 2001). In spring 2001, a number of dust episodes gen-erated in Asia were also transported to North America and were captured by many studies during the ACE-Asia cam-paign (Arimoto et al., 2006; Gong et al., 2003; Huebert et al., 2003; Seinfeld et al., 2004). The 2001 dust storms re-sulted in the greatest mass of Asian dust transported to North America in at least the past 20 years and contributed signifi-cantly to surface PM levels across the US (Jaffe et al., 2003b; USEPA, 2003).
The occurrence and transport of Sand Dust Storms (SDS) is controlled by a number of factors, including the surface conditions and wind speeds in the source regions and the strength of prevailing westerly jets. The mechanisms for re-gional and long-range transport under different climate con-ditions also vary. The regional-scale transport of Asian dust is dominated by northerly surface winds of the Asian winter monsoon (Zhang et al., 1999), and the surges of cold air as-sociated with the monsoon circulation historically increase in strength and frequency from the west during relatively cold and severe climate conditions. Similarly, the increased dust transported from northern sources in Asia are mainly asso-ciated with relatively warm and humid climate conditions (Zhang et al., 1997). These regional effects are in contrast to
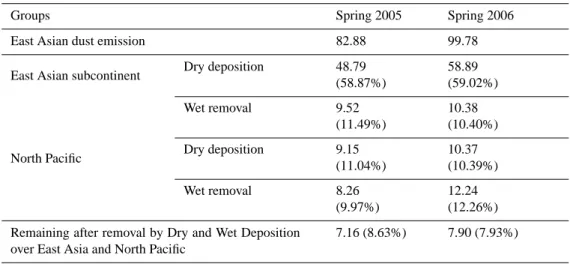
Table 1. Asian dust emission, dry deposition and wet removal (in megatons) in springs 2005 and 2006. Remaining (in megatons) of dust emission after dry deposition and wet removal over East Asia and North Pacific is Asian dust aerosol amount contributing to North American PM-background. The percentages in the brackets are relative to East Asian dust emissions.
Groups Spring 2005 Spring 2006 East Asian dust emission 82.88 99.78 East Asian subcontinent Dry deposition 48.79
(58.87%) 58.89 (59.02%) Wet removal 9.52 (11.49%) 10.38 (10.40%) North Pacific Dry deposition 9.15
(11.04%) 10.37 (10.39%) Wet removal 8.26 (9.97%) 12.24 (12.26%) Remaining after removal by Dry and Wet Deposition
over East Asia and North Pacific
7.16 (8.63%) 7.90 (7.93%)
the global-dispersal of dust, which is associated with trans-port by upper-level westerly jets and is mainly the result of desert dust storms during both glacial and interglacial condi-tions (Zhang et al., 1997). Active midlatitude cyclones and strong westerly winds in the free troposphere are the major mechanisms for long-range transport of Asian dust in spring (Merrill et al., 1989). Due to the interannual variations of these conditions, the frequency and strength of SDS in Asia and its trans-Pacific transport changes from year to year and links to many climate variables (Gong et al., 2006).
Using the Interagency Monitoring of Protected Visual En-vironments (IMPROVE) data from 1989 to 1998, VanCuren and Cahill (2002) analyzed the fine Asian dust aerosol fre-quency and intensity to mid-latitude North America. Their results indicated that the transport of Asian dust to the eastern Pacific and western North America contributes between 0.2 and 1.0 µg m−3 to PM
2.5, and high frequency of the Asian dust transport was found in spring, which is consistent with the frequency of SDS occurrences in Asia (Natsagdorj et al., 2003; Zhou, 2001). From six identified episodes of trans-Pacific transport occurred between 1993 and 2001, Jaffe et al. (2003a) found that varying emission conditions, weather patterns in both source and receptor regions and transport pathways across North Pacific all influenced on the diver-sity of episodes. The background tropospheric aerosol over western North America is generated in Asia (VanCuren et al., 2005). A “loose” relationship between the frequency and strength of Asian dust storms and the frequency and strength of dust transported to North America is established (Arimoto et al., 2006; Jaffe et al., 2003a; Merrill et al., 1989; Van-Curen et al., 2005). However, one question that remains un-solved concerning the Asian SDS is the relative amount of dust aerosol transported into North America with respect to the frequency and strength of Asian dust storms. In other
words, why the correlations between Asian SDS and western North American PM levels are less significant in some years. We tried to investigate the major factors controlling the trans-port and deposition of dust aerosols over the Pacific using the 2005/2006 cases as an example to increase the quantitative precision of our understanding on the relationship between the frequency and strength of SDS in Asia and the frequency and strength of dust aerosol transported to North America.
This paper presents a study using the observational data from both Asia and North America between 2000 and 2006 to elucidate the correlation between them, and uses model simulations to characterize the linkage between Asian SDS and its transports to North America. Factors controlling the production, transport and removal processes of dust aerosols are analyzed to explain the differences in the mechanism of trans-Pacific transports between 2005 and 2006.
2 Observational evidence
Prior to the year 2000, records of SDS in China were reg-istered in each observation station as dusty days (Zhou, 2001) for three types of SDS: blowing dust storms (BLDS), sand/dust storms (SDS), and severe SDS (SSDS). For the last half century, this data set has provided valuable records of SDS history and has been used in many studies on the trends of SDS in China (Sun et al., 2001; Zhang et al., 2003; Zhao et al., 2004, 2006) and Mongolia (Natsagdorj et al., 2003). However, the standards for SDS days vary from station to sta-tion and do not reflect the systematic features of dust concen-trations over larger areas or regions. Recently, the concept of a SDS process was introduced, providing a definition using certain standards and criteria after considering the synoptic weather patterns (Yang et al., 2008). Based on the existing WMO- and CMA (China Meteorological Administration) –
(a)
(b)
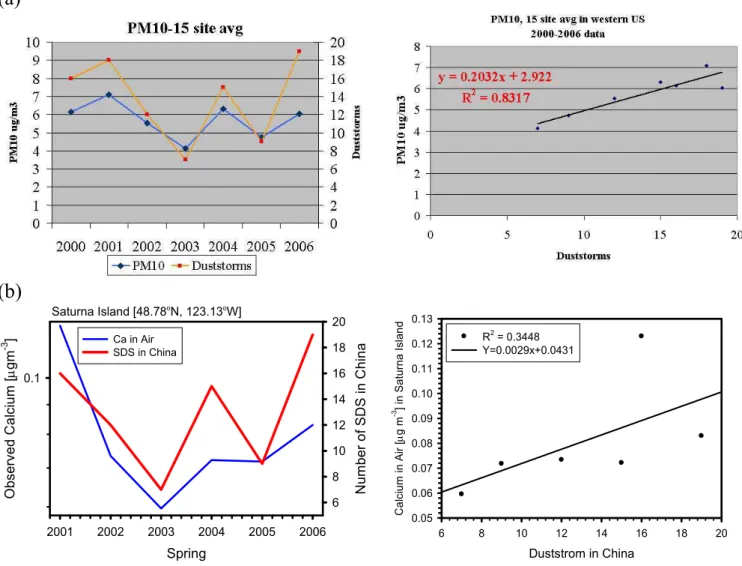
Saturna Island [48.78o N, 123.13o W] Spring 2001 2002 2003 2004 2005 2006 O b se rv e d C a lc iu m [µ g m -3 ] 0.1 N u mb e r o f SD S i n C h in a 6 8 10 12 14 16 18 20 Ca in Air SDS in China Duststrom in China 6 8 10 12 14 16 18 20 C a lc iu m i n A ir [µ g m -3 ] in Sa tu rn a I sl a n d 0.05 0.06 0.07 0.08 0.09 0.10 0.11 0.12 0.13 R2 = 0.3448 Y=0.0029x+0.0431Fig. 1. (a) Time series of spring mean PM10concentration at 15 sites (Table 2) in the western US and number of SDS (Duststorms) in China
from spring 2000 to 2006 (left) and a scatter plot of both variables (right). (b) Same as in (a) but for spring mean Ca concentration at Saturna Island, Canada from spring 2001 to 2006.
monitoring network of meteorological stations in northeast Asia, the number of observing stations that can spot the sand-dust phenomenon under a defined resolution is used to de-termine the sphere of influence. A BLSD (SDS and SSDS) process is made up of five (three) or more adjacent stations observing blowing dust (sand/dust storms and severe SDS) phenomena over an area, at a given observing hour, under the same synoptic system. By this definition, the total number of SDS processes including BLDS, SDS and SSDS observed in China was 16, 18, 12, 7, 15, 9 and 19 from 2000 to 2006 (Yang et al., 2008). Spring 2006 was one of the most prolific SDS seasons in the last 10 years in China with 19 dust storm processes recorded (Yang et al., 2008; Zhou et al., 2008).
To evaluate how the frequency of Asian SDS influences the concentration of dust in North America, data from the IMPROVE network of particulate monitoring sites in the
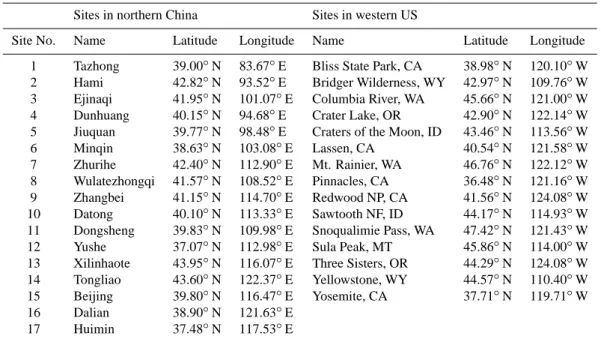
US (Malm et al., 1994) were used. The IMPROVE sites mea-sure aerosols in two size ranges, with a size cut at 2.5 µm diameter (see http://vista.cira.colostate.edu/IMPROVE/). On the fine fraction (PM2.5), a detailed chemical analysis is made along with the aerosol mass concentration. On the coarse fraction, only the aerosol mass concentration is mea-sured (PM10). Measurements are made approximately two times per week for a 24 h period. For this analysis, 15 sites in the western US were chosen (Table 2), and we examined the correlation between the annual spring (March–May) fine soil concentration and coarse mass concentration with the num-ber of Asian SDS processes, where the soil concentration is given by 2.20*Al+2.49*Si+1.63*Ca+2.42*Fe+1.94*Ti. These sites were chosen so as to minimize the influence of lo-cal pollution as well as lolo-cal dust sources. Note that as of the time of this writing, fine aerosol chemical data is available
Table 2. The locations of 17 sites in northern China and 15 sites of the IMPROVE (Inter-agency Monitoring of Protected Visual Environ-ments) network in the western US.
Sites in northern China Sites in western US
Site No. Name Latitude Longitude Name Latitude Longitude 1 Tazhong 39.00◦N 83.67◦E Bliss State Park, CA 38.98◦N 120.10◦W
2 Hami 42.82◦N 93.52◦E Bridger Wilderness, WY 42.97◦N 109.76◦W
3 Ejinaqi 41.95◦N 101.07◦E Columbia River, WA 45.66◦N 121.00◦W
4 Dunhuang 40.15◦N 94.68◦E Crater Lake, OR 42.90◦N 122.14◦W
5 Jiuquan 39.77◦N 98.48◦E Craters of the Moon, ID 43.46◦N 113.56◦W
6 Minqin 38.63◦N 103.08◦E Lassen, CA 40.54◦N 121.58◦W
7 Zhurihe 42.40◦N 112.90◦E Mt. Rainier, WA 46.76◦N 122.12◦W
8 Wulatezhongqi 41.57◦N 108.52◦E Pinnacles, CA 36.48◦N 121.16◦W
9 Zhangbei 41.15◦N 114.70◦E Redwood NP, CA 41.56◦N 124.08◦W
10 Datong 40.10◦N 113.33◦E Sawtooth NF, ID 44.17◦N 114.93◦W
11 Dongsheng 39.83◦N 109.98◦E Snoqualimie Pass, WA 47.42◦N 121.43◦W
12 Yushe 37.07◦N 112.98◦E Sula Peak, MT 45.86◦N 114.00◦W
13 Xilinhaote 43.95◦N 116.07◦E Three Sisters, OR 44.29◦N 124.08◦W
14 Tongliao 43.60◦N 122.37◦E Yellowstone, WY 44.57◦N 110.40◦W
15 Beijing 39.80◦N 116.47◦E Yosemite, CA 37.71◦N 119.71◦W
16 Dalian 38.90◦N 121.63◦E
17 Huimin 37.48◦N 117.53◦E
through spring 2004, whereas the coarse mass data is avail-able through the spring of 2006. Figure 1a shows a time series of the annual spring mean PM10concentration at these 15 sites, along with the total SDS process numbers in China each year and a scatter plot of these variables. The R2value for the correlation between the spring mean PM10 concen-tration with the number of Chinese SDS is 0.83 (7 years) and the R2value for the correlation between the spring mean fine dust concentration with the process number of Chinese SDS is 0.68 (5 years). This type of correlation was also ob-served with the surface Ca measurements at the Canadian CAPMoN (Canadian Air and Precipitation Monitoring) sta-tion on Saturna Island (Fig. 1b) with a smaller R2value of 0.34 (6 years). The results imply that the number of Chinese SDS has a significant control on the variability in background PM over much of western North America.
One interesting phenomenon in Fig. 1 is the difference in the relationship between the SDS numbers and the PM10 (Ca) concentrations in North America. It is evident that dust aerosols were transported to North America in greater amounts during 2005 than in 2006 relative to the springtime dust storm frequency in East Asia. Factors controlling the interannual variations were further investigated with a mod-eling study and re-analyzed meteorological data.
3 Model simulations of SDS in 2005 and 2006
In order to analyze the difference in production and trans-port of SDS between 2005 and 2006, model simulations were performed for the spring of both years. The model used in
this study is the Northern Aerosol Regional Climate Model (NARCM), which has been used extensively in simulating dust storms during ACE-Asia and 44-year climatology of Asian dust aerosol and trans-Pacific transport (Gong et al., 2006; Zhao et al., 2006). It is shown that NARCM captured most of the Asian dust mobilization and produced reason-able distributions of the dust concentrations over source re-gions and downwind areas from east China to western North America.
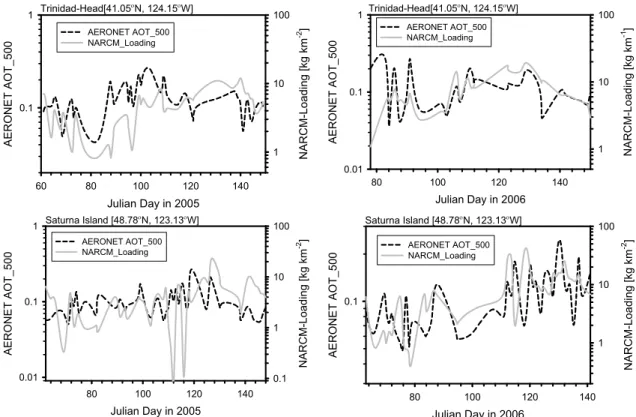
The spatial distribution and sources of SDS in East Asia were obtained from observational data from the WMO (World Meteorological Organization) – monitoring network and the routine meteorological station network of CMA (China Meteorological Administration) for springs 2005 and 2006 (Wang et al., 2008; Yang et al., 2008). The surface dust concentrations in both springs were comparable with the measured PM10 in northern China (Fig. 2a). The com-parisons of modeled surface dust concentrations in north-ern China between spring 2005 and 2006 coincide reason-ably well with the interannual variation of Asian dust storms (Fig. 2b) with higher PM10 concentrations at most stations in 2006 (Table 2). Figure 3 shows the differences of Asian dust emissions modeled by NARCM between spring 2006 and 2005. It was found that SDS occurred more frequently in most source regions, but less in east Mongolia and north eastern China, in spring 2006 than observed in spring 2005 (Zhou et al., 2008). Comparison of the optical depth from AERONET (Aerosol Robotic Network: http://aeronet.gsfc. nasa.gov/) with the simulated dust column loading was per-formed to evaluate the long-range transported Asian dust to
(a) (b)
NARCM-Simulation [µg m-3] 0 200 400 600 800 1000 1200 O b se rve d PM1 0 [µ g m -3 ] 0 200 400 600 800 1000 1200 R2 = 0.6421 y=0.6321x+135.53Observation Station in North China 0 1 2 3 4 5 6 7 8 9 10 11 12 13 14 15 16 17 18 M o d e le d D u st C o n ce n tra ti o n [µ g m -3 ] 0 200 400 600 800 1000 Spring 2005 Spring 2006
Fig. 2. (a) The correlations of the modeled surface dust concentrations with observed PM10 at the 17 stations (Table 2) in northern China
for spring 2005 and 2006. (b) Interannual variations of modeled surface dust concentrations at 17 observation stations in northern China between spring 2005 and 2006.
Fig. 3. Differences of simulated Asian dust emission (tons km−2)between spring 2006 and 2005.
North America. Good agreement between daily variations of modeled dust loading and AERONET AOT 500 at Trinidad Head and Saturna Island was achieved (Fig. 4), especially for the SDS episodes.
Based on the NARCM-simulations, Table 1 lists the bud-gets of Asian dust emissions, dry and wet deposition, dur-ing its trans-Pacific transport in sprdur-ing 2005 and 2006. Dust aerosol of 83 Mt and 100 Mt was emitted from the source re-gions in East Asia in spring 2005 and 2006, respectively. Af-ter removal from dry and wet deposition to the East Asian subcontinent and the North Pacific, it was estimated from Table 1 that about 9% and 8% Asian dust were engaged in trans-Pacific transport into North America in spring 2005 and 2006, respectively.
4 Analysis of the anomaly of trans-Pacific transport be-tween 2005 and 2006
Asian dust involved in trans-Pacific transport is governed by both the Asian dust source strengths and circulation patterns over the North Pacific (Gong et al., 2003). Active midlat-itude cyclones and strong westerly winds in the free tropo-sphere are the major mechanisms for long-range transport of Asian dust in spring (Merrill et al., 1989). Dust con-centration variability appears to be dominated by transport variability and/or transport and source covariance rather than source strength variability (Mahowald et al., 2003). The in-terannual differences of the connections between Asian dust storms and the ambient PM levels in western North Amer-ica, especially from 2005 to 2006 (Fig. 1 and Table 1) could
Trinidad-Head[41.05οN, 124.15οW] Julian Day in 2005 60 80 100 120 140 AER O N ET A O T _ 5 0 0 0.1 1 N AR C M-L o a d in g [ k g k m -2] 1 10 100 AERONET AOT_500 NARCM_Loading Trinidad-Head[41.05οN, 124.15οW] Julian Day in 2006 80 100 120 140 AER O N ET AO T _ 5 0 0 0.01 0.1 1 N AR C M -L o a d in g [ kg km -1 ] 1 10 100 AERONET AOT_500 NARCM_Loading Saturna Island [48.78οN, 123.13οW] Julian Day in 2005 80 100 120 140 AER O N ET AO T _ 5 0 0 0.01 0.1 1 N AR C M-L o a d in g [ kg k m -2 ] 0.1 1 10 100 AERONET AOT_500 NARCM_Loading Saturna Island [48.78οN, 123.13οW] Julian Day in 2006 80 100 120 140 A E R O N ET AO T _ 5 0 0 0.1 N A R C M -L o a d in g [ kg k m -2 ] 1 10 100 AERONET AOT_500 NARCM_Loading
Fig. 4. Comparisons of the modeled column dust loading (kg. km−2)with the optical depth of AERONET AOT 500 in Trinidad-Head and
Saturna Island in spring 2005 and 2006.
be closely associated with the varying mechanisms of trans-Pacific transport in interannual scales. Based on the analysis on trans-Pacific transport of Asian dust in springs 2005 and 2006, three factors controlling Asian dust Pacific trans-port and its contribution to PM levels in North America are discussed below:
4.1 Frontal cyclones in East Asia
Climatologically, Asian dust storms are closely associated with the activity of frontal cyclones in East Asia. The most favourable atmospheric circulation pattern for Asian dust storms is when intense cold fronts associated with cyclones sweep across southern Mongolia and northern China (Bey et al., 2001; Chun et al., 2001; Qian et al., 2002), where Asian dust emitted from the desert regions and remain in the bound-ary layer. The regional-scale transport of Asian dust from the desert regions to East Asian offshore regions near the west Pacific mostly occurred below 3 km, dominated by dust emission sources and northwesterly winds from cold frontal activity in East Asia (Zhao et al., 2006). Figure 5 shows such a regional-scale transport pattern at 3 km for both spring 2005 and 2006. In spring 2005 a strong cyclone existed in north eastern China (Fig. 5a), while in spring 2006 a diver-gence center persisted near Lake Baikal in the Siberian re-gion, which could entrain the frequent cold air outbreak and cause more dust storms (Fig. 5b). It is observed that spring
2006 featured noticeably increased SDS in East Asia (Yang et al., 2008). During the regional-scale transport, Asian dust is lifted from Asian boundary layer to the free troposphere over 3 km in East Asia and western Pacific and carried by the mid-latitude westerlies for long range transport. The in-creased mixing and convection caused by the frontal action play a major role in transporting the tracer from the boundary to the free troposphere (Donnell et al., 2001). The vertical transport fluxes of Asian dust averaged in spring 2005 and 2006 characterized the major uplift (with the negative values in Fig. 6) of Asian dust at 3 km in east Mongolia and north eastern China (Fig. 6). Although the distributions of vertical transport fluxes in spring 2005 (Fig. 6a) and 2006 (Fig. 6b) were rather similar, considering the variation of Asian spring dust emission from 83 mt in 2005 to 100 mt in 2006 in Ta-ble 1, more fraction of emitted dust was raised from the lower to the free troposphere by frontal cyclones for trans-Pacific transport in spring 2005 than in 2006. The stronger uplift associated with the cyclone in north eastern China in 2005, compared to 2006, brought a smaller dry deposition fraction and therefore increased precipitation for a more wet removal fraction over East Asia, as shown in Table 1.
4.2 Trans-Pacific transport pathway
Most trans-Pacific transport of Asian dust aerosol could be expected to be zonal, governed by the prevailing westerly
(a)
(b)
Fig. 5. Seasonally mean streamlines of dust transport fluxes (µg m−2s−1)at 3000 m over the Asian region in spring (a) 2005 and (b) 2006.
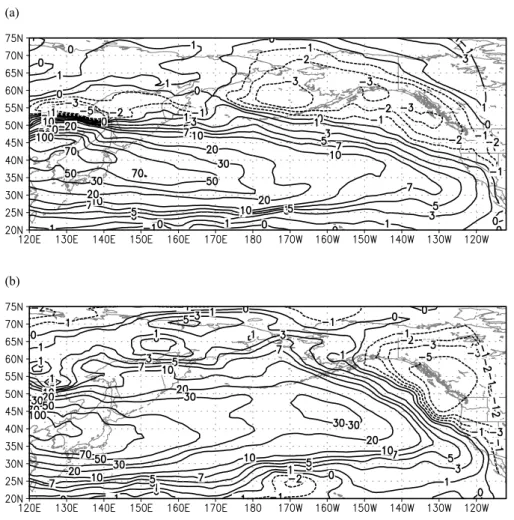
jet in the mid-latitude free troposphere in spring (Bey et al., 2001; Liu et al., 2003; Wilkening et al., 2000). Therefore, the zonal dust transport flux can be used to investigate the pathway of Asian dust trans-Pacific transport. The season-ally averaged transport fluxes of Asian dust indicate that most Asian dust trans-Pacific transport occurs in the free tropo-sphere between 3 km and 10 km for both spring 2005 and 2006. The different pathways of Asian trans-Pacific transport for spring 2005 and 2006 are found in Fig. 7. In spring 2005, the trans-Pacific pathway extended zonally across the North Pacific from East Asia to North America with strong zonal airflows over the North Pacific, which could provide more effective trans-Pacific transport of Asian dust (Husar et al., 2001); in spring 2006 the trans-Pacific transport was formed into two pathways: an eastward zonal path over the North Pacific and a meridional path north-eastwards from East Asia to the high-latitudes. The transport pattern caused by the sig-nificant meridional flow in East Asia and the west Pacific in spring 2006 weakened the strength of zonal dust transport across the North Pacific.
The correlation analysis of the trans-Pacific transport of Asian dust with various climate indices, based on 44-year interannual variability (Gong et al., 2006) examined the con-nections of the predominance of zonal or meridional circu-lation over the North Pacific and trans-Pacific transport. It was confirmed that strong zonal flows of the westerly jet in the free troposphere over the North Pacific favours significant trans-Pacific transport of Asian dust.
4.3 Scavenging by precipitation in North Pacific
Over the source regions of Asian dust, dry deposition is the dominant removal process, while wet deposition as a func-tion of precipitafunc-tion is the major process of dust aerosol re-moval from the atmosphere to the ocean in the North Pacific (Zhao et al., 2003). The atmospherically transported mineral aerosol is a significant source of sedimentary material for the North Pacific with larger quantities deposited over the west-ern North Pacific, closer to the Asian sources (Uematsu et al., 1983). The deposition of Asian dust during the trans-Pacific transport suggests that it may be a major contributor to the
(a)
(b)
Fig. 6. Seasonal averages of vertical dust transport fluxes (µg m−2s−1)at 3000 m over the Asian region in spring (a) 2005 and (b) 2006.
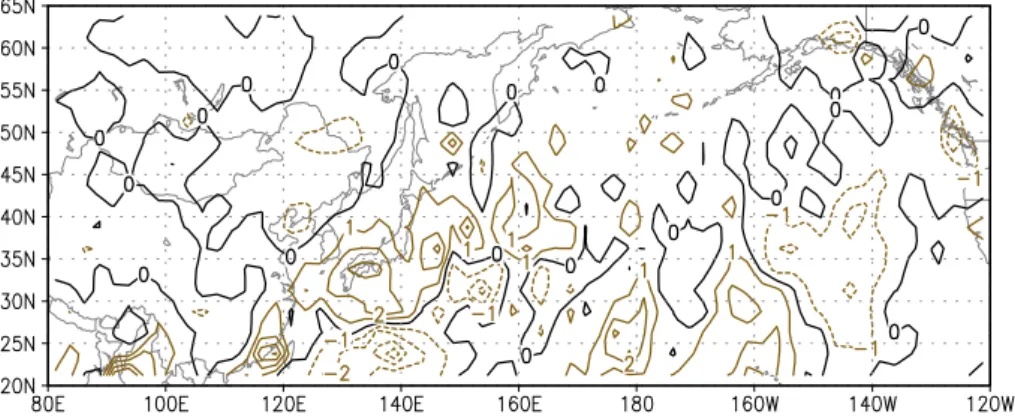
deep-sea sediments of the North Pacific (Duce et al., 1980; Parrington et al., 1983). Table 1 shows an apparent difference in wet deposition into the North Pacific between spring 2005 and 2006. More than 12% of Asian dust was removed by wet deposition over the North Pacific in spring 2006, while less than 10% in spring 2005 (Table 1). The greater wet de-position in spring 2006 than in 2005 mostly appeared on the pathway in the west and mid-Pacific (Fig. 8). The differences in dust wet removal (Fig. 8) were consistent with that of the seasonally averaged precipitation between spring 2006 and 2005, especially over the west and mid-Pacific, where more precipitation fell in spring 2006 than 2005 (Fig. 9). As the scavenging of Asian dust particles by precipitation is a major process of dust removal on the trans-Pacific transport path-way, the variation of precipitation in the North Pacific has a significant impact on the on trans-Pacific transport of Asian dust.
5 Conclusions
The observational fact of Asian dust trans-Pacific transport and contribution to the ambient PM levels in North America
was revealed, based on the connections of interannual varia-tions between Asian dust storms and the ambient PM levels in western North America. The results imply that the number of Chinese SDS has significant control on the variability in background PM over western North America. The difference in the connections of the process numbers and the PM10(Ca) concentrations in North America between spring 2005 and 2006 were analysed with NARCM simulations. The inter-annual variability of springtime PM levels in western North America was controlled by covariance of Asian dust source and trans-Pacific transport. Currently, we only have 7 years of data for the Asian SDS-process numbers from spring 2000 to 2006 which the correlation studies were based on. We chose 2005/2006 as the contrasting years to investigate the factors that control the trans-Pacific transport of soil dust. It is evident that springtime dust aerosols were transported to North America in greater amounts in 2005 than in 2006 rela-tive to their SDS process numbers in China. From investiga-tion of Asian dust trans-Pacific transport in spring 2005 and 2006, three major controlling factors on variations of Asian trans-Pacific transport and contribution to PM levels in west-ern North America were identified:
(a)
(b)
Fig. 7. Seasonally averaged distributions of zonal dust transport fluxes (µg.m−2s−1)at 5000 m in spring (a) 2005 and (b) 2006.
Fig. 8. Differences of modeled wet depositions (ton. km−2)between spring 2005 and 2006.
1. Strength of frontal cyclones from Mongolia to north
eastern China: The most favourable atmospheric
circu-lation pattern for Asian dust storms is when intense cold
fronts associated with cyclones sweep across Mongolia and northern China. The frontal cyclones not only bring strong surface winds from cold frontal activity for dust
Fig. 9. Differences of the seasonally averaged precipitation (mm day−1)from CMAP (CPC (Climate Prediction Center of NOAA) Merged
Analysis of Precipitation) data between spring 2005 and 2006.
storms in East Asia, but also raise Asian dust with their upward current into the westerly winds of the free tro-posphere for trans-Pacific transport.
2. Pattern of transport pathway over the North Pacific: The circulation patterns of westerlies over the North Pacific govern the trans-Pacific transport pattern. The evolution of zonal or meridional circulation patterns in the mid-latitudes could result in variations of transport pathways across the North Pacific. Strong zonal air-flows of the westerly jet in the free troposphere over the North Pacific favour significant trans-Pacific transport of Asian dust.
3. Variation of precipitation in the North Pacific: Over the source regions of Asian dust, dry deposition is the dom-inant removal process, while the scavenging of Asian dust particles by precipitation is the major process of dust removal on the trans-Pacific transport pathway; therefore, interannual variability of precipitation in the North Pacific clearly has an impact on trans-Pacific transport of Asian dust.
These three major factors controlling Asian dust trans-Pacific transport are drawn from interannual comparison of spring 2005 and 2006 in order to increase the quantitative precision of our understanding of the relationship between Asian dust trans-Pacific transport and the ambient PM levels in North America. If we advance this research with the extended ob-servation data of SDS-process in East Asia and PM in North America in the longer time series, the conclusions would be greatly strengthened.
The starting location of any SDS in China is another fac-tor that may influence the correlation between SDS process number and ambient PM in North America (Xuan et al., 2004; Zhang et al., 2003). This study only considered the to-tal dust emission from the all locations and source strengths for Asian Dust and its trans-Pacific transport in spring 2005 and 2006. Because the dust storms from the Taklimaken
Desert are limited locally in western China, the route of long-rang transport from there is still lacking research (Xuan et al., 2004) through an eastward route was once proposed (Sun et al., 2001). The long range transport routs from the source re-gions in western China deserve further study. Furthermore, the importance of the weather pattern between northeast Pa-cific and western North America should also be emphasized in transported amounts of Asian aerosols arriving into west-ern North America (Jaffe et al., 2003a; Liang et al., 2004). Acknowledgements. The authors wish to thank for the
fi-nancial supports from the National Basic Research Program (973) (2006CB403703 and 2006CB403701) and the MOST (2004DIB3J115) of China for this project.
Edited by: Y. Balkanski
References
Arimoto, R., Kim, Y. J., Kim, Y. P., Quinn, P. K., Bates, T. S., Anderson, T. L., Gong, S., Uno, I., Chin, M., Huebert, B. J., Clarke, A. D., Shinozuka, Y., Weber, R. J., Ander-son, J. R., Guazzotti, S. A., Sullivan, R. C., Sodeman, D. A., Prather, K. A., and Sokolik, I. N.: Characterization of Asian Dust during ACE-Asia, Global and Planet. Change, 52, 23–56, doi:10.1016/j.gloplacha.2006.02.013, 2006.
Bey, I., Jacob, D. J., Logan, J. A., and Yantosca, R. M.: Asian chemical outflow to the Pacific in spring: Origins, path-ways, and budgets, J. Geophys. Res., 106, 23 097–23 114, doi:10.1029/2001JD000806, 2001.
Chun, Y., Boo, K.-O., Kim, J., Park, S.-U., and Lee, M.: Synopsis, transport and physical characteristics of Asian dust in Korea, J. Geophys. Res., 106, 18 461–18 470, doi:10.1029/2001JD900184, 2001.
Donnell, E. A., Fish, D. J., Dicks, E. M., and Thorpe, A. J.: Mechanisms for pollutant transport between the boundary layer and the free troposphere, J. Geophys. Res., 106, 7847–7856, doi:10.1029/2000JD900730, 2001.
Duce, R. A., Unni, C. K., Ray, B. J., Prospero, J. M., and Merrill, J. T.: Long-range atmospheric transport of soil dust from Asia
to the tropical North Pacific: Temporal variability, Science, 209, 1,522–1,524, 1980.
Gong, S. L., Zhang, X. Y., Zhao, T. L., McKendry, I. G., Jaffe, D. A., and Lu, N. M.: Characterization Of Soil Dust Dis-tributions In China And Its Transport During ACE-ASIA 2. Model Simulation and Validation, J. Geophys. Res., 108, 4262, doi:10.1029/2002JD002633, 2003.
Gong, S. L., Zhang, X. Y., Zhao, T. L., Zhang, X. B., Barrie, L. A., McKendry, I. G., and Zhao, C. S.: A simulated climatol-ogy of Asian dust aerosol and its trans-Pacific transport. Part II: Interannual variability and climate connections, J. Climate, 19, 104–122, 2006.
Huebert, B. J., Bates, T., Russell, P. B., Shi, G., Kim, Y. J., Kawa-mura, K., Carmicheal, G. and Nakajima, T.: An overview of ACE-Asia: Strategies for quantifying the relationships between Asian aerosols and their climatic impacts, J. Geophys Res., 108, 8633, doi:10.1029/2003JD003550, 2003.
Husar, R. B., Tratt, D. M., Schichtel, B. A., Falke, S. R., Li, F., Jaffe, D., Gass´o, S., Gill, T., Laulainen, N. S., Lu, F., Reheis, M. C., Chun, Y., Westphal, D., Holben, B. N., Gueymard, C., McKendry, I., Kuring, N., Feldman, G. C., McClain, C., Frouin, R. J., Merrill, J., DuBois, D., Vignola, F., Murayama, T., Nick-ovic, S., Wilson, W. E., Sassen, K., Sugimoto, N., and Malm, W. C.: Asian dust evens of April 1998, J. Geophys. Res., 106, 18 317–18 330, doi:10.1029/2000JD900788, 2001.
Jaffe, D., McKendry, I., Anderson, T., and Price, H.: Six “new” episodes of trans-Pacific transport of air pollutants, Atmos. Env-iron., 37, 391–404, 2003a.
Jaffe, D. A., Anderson, T., Covert, D., Kotchenruther, R., Trost, B., Danielson, J., Simpson, W., Berntsen, T., Karlsdottir, S., Blake, D., Harris, J., Carmichael, G., and Uno, I.: Transport of Asian air pollution to North America, Geophys. Res. Lett., 26, 711– 714, doi:10.1029/1999GL900477, 1999.
Jaffe, D. A., Snow, J., and Cooper, O.: The April 2001 Asian dust events: Transport and substantial impact on surface particulate matter concentrations across the United States, EOS Transac-tions, November 18, 2003b.
Liang, Q., Jaegl´e, L., Jaffe, D. A., Weiss-Penzias, P., Heckman, A., and Snow, J. A.: Long-range transport of Asian pollution to the northeast Pacific: Seasonal variations and transport path-ways of carbon monoxide, J. Geophys. Res., 109, D23S07, doi:10.1029/2003JD004402, 2004.
Liu, H., Jacob, D. J., Bey, R. M., Yantosca, R. M., Duncan, B. N., and Sachse, G. W.: Transport pathways for Asian pollution outflow over the Pacific: Interannual and seasonal variations, J. Geophys. Res., 108, 8786, doi:10.1029/2002JD003102, 2003. Mahowald, N., Luo, C., del Corral, J., and Zender, C. S.:
Inter-annual variability in atmospheric mineral from a 22-year model simulation and observational data, J. Geophys. Res., 108, 4352, doi:10.1029/2002JD002821, 2003.
Malm, W. C., Sisler, J. F., Huffman, D., Eldred, R. A., and Cahill, T. A.: Spatial and seasonal trends in particle concentration and op-tical extinction in the United States, J. Geophys. Res., 99, 1347– 1370, doi:10.1029/93JD02916, 1994.
McKendry, I. G., Hacker, J. P., Stull, R., Sakiyama, S., Mignacca, D. and Reid, K.: Long-range transport of Asian dust to the Lower Fraser Valley, British Columbia, Canada, J. Geophys. Res., 106, 18 361–18 370, doi:10.1029/2000JD900359, 2001.
Merrill, J. T., Uematsu, M., and Bleck, R.: Meteorological
anal-ysis of long-range transport of mineral aerosols over the North Pacific, J. Geophys. Res., 94, 8584–8598, 1989.
Natsagdorj, L., Jugder, D., and Chung, Y. S.: Analysis of dust storms observed in Mongolia during 1937–1999, Atmos. Envi-ron., 37, 1401–1411, 2003.
Parrington, J. R., Zoller, W. H., and Aras, N. K.: Asian Dust: Sea-sonal Transport to the Hawaiian Islands, Science, 229, 195–197, 1983.
Prospero, J. M., Uematsu, M., and Savoie, D. L.: Mineral aerosol transport to the Pacific Ocean, in: Chemical Oceanography, edited by: Riley, J. P., Chester, R., and Duce, R. A., Academic, San Diego, CA, 188–218, 1989.
Qian, W., Quan, L., and Shi, S.: Variability of the dust storm in China and climatic control, J. Climate, 15, 1216–1229, 2002. Seinfeld, J. H., Carmichael, G. R., Arimoto, R., Conant, W. C.,
Brechtel, F. J., Bates, T. S., Cahill, T. A., Clarke, A. D., Do-herty, S. J., Flatau, P. J., Huebert, B. J., Kim, J., Markowicz, K. M., Quinn, P. K., Russell, L. M., Russell, P. B., Shimizu, A., Shinozuka, Y., Song, C. H., Tang, Y., Uno, I., Vogelmann, A. M., Weber, R. J., Woo, J. H., and Zhang, X. Y.: ACE-ASIA: Regional Climatic and Atmospheric Chemical Effects of Asian Dust and Pollution, B. Am. Meteorol. Soc., 85, 367–380, 2004.
Sun, J. M., Zhang, M. Y., and Liu, T. S.: Spatial and temporal char-acteristics of dust storms in China and its surrounding regions, 1960–1999: Relations to source area and climate, J. Geophys. Res., 106, 10 325–10 334, doi:10.1029/2000JD900665, 2001. Uematsu, M., Duce, R. A., Prospero, J. M., Chen, L., Merrill, J. T.,
and McDonald, R. L.: Transport of mineral aerosol from Asia over the North Pacific Ocean, J. Geophys. Res., 88, 5,343–5,352, 1983.
USEPA: Impact of April 2001 Asian dust event on particulate mat-ter concentrations in the United States, National Air Quality and Emissions Trends Report, USEPA (US Environmental Protection Agency), Washington, D.C., 2003.
VanCuren, R. A.: Asian aerosols in North America: Extract-ing the chemical composition and mass concentration of the Asian continental aerosol plume from long-term aerosol records in the western United States, J. Geophys. Res., 108, 4623, doi:10.1029/2003JD003459, 2003.
VanCuren, R. A. and Cahill, T. A.: Asian aerosols in North Amer-ica: Frequency and concentration of fine dust, J. Geophys. Res., 107, 4804, doi:10.1029/2002JD002204, 2002.
VanCuren, R. A., Cliff, S. S., Perry, K. D., and Jimenez-Cruz, M.: Asian continental aerosol persistence above the marine boundary layer over the eastern North Pacific: Continuous aerosol mea-surements from Intercontinental Transport and Chemical Trans-formation 2002 (ITCT 2K2), J. Geophys. Res., 110, D09S90, doi:10.1029/2004JD004973, 2005.
Wang, Y. Q., Zhang, X. Y., Gong, S. L., Zhou, C. H., Hu, X. Q., Liu, H. L., Niu, T., and Yang, Y. Q.: Surface observation of sand and dust storm in East Asia and its application in CUACE/Dust forecasting system, Atmos. Chem. Phys., 8, 545–553, 2008, http://www.atmos-chem-phys.net/8/545/2008/.
Wilkening, K. E., Barrie, L. A., and Engle, M.: Trans-Pacific air pollution, Science, 290, 65–67, 2000.
Xuan, J., Sokolikb, I. N., Hao, J., Guo, F., Mao, H., and G., Y.: Iden-tification and characterization of sources of atmospheric mineral dust in East Asia, Atmos. Environ., 38, 6239–6252, 2004. Yang, Y. Q., Hou, Q., Zhou, C. H., Liu, H. L., Wang, Y. Q., and Niu,
T.: Sand/dust storm processes in Northeast Asia and associated large-scale circulations, Atmos. Chem. Phys., 8, 25–33, 2008, http://www.atmos-chem-phys.net/8/25/2008/.
Zhang, X. Y., An, Z. S., and Cao, J. J.: Dust emission from Chinese desert sources linked to variations in atmospheric circulation, J. Geophys. Res., 102, 28 041–28 047, doi:10.1029/97JD02300, 1997.
Zhang, X. Y., Arimoto, R., and An, Z. S.: Glacial and interglacial patterns for Asian dust transport, Quart. Sci. Rev., 18, 811–819, 1999.
Zhang, X. Y., Gong, S. L., Zhao, T. L., Arimoto, R., Wang, Y. Q., and Zhou, Z. J.: Sources of Asian dust and role of climate change versus desertification in Asian dust emission, Geophys. Res. Lett., 30, 2272, doi:10.1029/2003GL018206, 2003. Zhao, C., Dabu, X., and Li, Y.: Relationship between climatic
fac-tors and dust storm frequency in the Inner Mongolia of China, Geophys. Res. Lett., 31, L01103, doi:10.1029/2003GRL018206, 2004.
Zhao, T. L., Gong, S. L., Zhang, X. Y., Blanchet, J. P., McKendry, I. G., and Zhou, Z. J.: A simulated climatology of Asian dust aerosol and its trans-Pacific transport. Part I: Mean climate and validation, J. Climate, 19, 88–103, 2006.
Zhao, T. L., Gong, S. L., Zhang, X. Y., and Mckendry, I. G.: Modeled size-segregated wet and dry deposition bud-gets of soil dust aerosol during ACE-Asia 2001: Implica-tions for trans-Pacific transport, J. Geophys. Res., 108, 8665, doi:10.1029/2002JD003363, 2003.
Zhou, C. H., Gong, S. L., Zhang, X. Y., Wang, Y. Q., Niu, T., Liu, H. L., Zhao, T. L., Yang, Y. Q., and Hou, Q.: Development and Evaluation of an Operational SDS Forecasting System for East Asia: CUACE/Dust, Atmos. Chem. Phys., 8, 787–798, 2008, http://www.atmos-chem-phys.net/8/787/2008/.
Zhou, Z. J.: Blowing-sand and sandstorm in China in recent 45 years, Quat. Sci., 21, 9–17, 2001 (in Chinese).