HAL Id: hal-00329423
https://hal.archives-ouvertes.fr/hal-00329423
Submitted on 15 Sep 2005
HAL is a multi-disciplinary open access
archive for the deposit and dissemination of
sci-entific research documents, whether they are
pub-lished or not. The documents may come from
teaching and research institutions in France or
abroad, or from public or private research centers.
L’archive ouverte pluridisciplinaire HAL, est
destinée au dépôt et à la diffusion de documents
scientifiques de niveau recherche, publiés ou non,
émanant des établissements d’enseignement et de
recherche français ou étrangers, des laboratoires
publics ou privés.
over the polar caps and the substorm dynamics of aurora
E. E. Titova, A. G. Yahnin, O. Santolik, D. A. Gurnett, F. Jiricek, Jean-Louis
Rauch, François Lefeuvre, L. A. Frank, J. B. Sigwarth, M. M. Mogilevsky
To cite this version:
E. E. Titova, A. G. Yahnin, O. Santolik, D. A. Gurnett, F. Jiricek, et al.. The relationship between
auroral hiss at high altitudes over the polar caps and the substorm dynamics of aurora. Annales
Geophysicae, European Geosciences Union, 2005, 23 (6), pp.2117-2128. �hal-00329423�
© European Geosciences Union 2005
Geophysicae
The relationship between auroral hiss at high altitudes over the
polar caps and the substorm dynamics of aurora
E. E. Titova1, A. G. Yahnin1, O. Santol´ık2, D. A. Gurnett3, F. Jir´ıcek4, J.-L. Rauch5, F. Lefeuvre5, L. A. Frank3, J. B. Sigwarth3, and M. M. Mogilevsky6
1Polar Geophysical Institute, Apatity, Russia
2Faculty of Mathematics and Physics, Charles University and Institute of Atmospheric Physics, Prague, Czech Republic 3Department of Physics and Astronomy, University of Iowa, Iowa City, USA
4Institute of Atmospheric Physics, Prague, Czech Republic 5LPCE/CNRS, Orleans, France
6Institute of Space Research, Moscow, Russia
Received: 18 October 2004 – Revised: 11 May 2005 – Accepted: 17 May 2005 – Published: 15 September 2005
Abstract. Strong variations of intensity and cutoff frequency
of the auroral hiss were observed by INTERBALL-2 and PO-LAR satellites at high altitudes, poleward from the auroral oval. The hiss intensifications are correlated with the auroral activations during substorms and/or pseudo-breakups. The low cutoff frequency of auroral hiss increases with the dis-tance between the aurora and the satellite footprint. Mul-ticomponent wave measurements of the hiss emissions on board the POLAR spacecraft show that the horizontal com-ponent of the Poynting flux of auroral hiss changes its direc-tion in good accordance with longitudinal displacements of the bright auroras. The vertical component of the Poynting flux is directed upward from the aurora region, indicating that hiss could be generated by upgoing electron beams. This re-lationship between hiss and the aurora dynamics means that the upgoing electron beams are closely related to downgoing electron beams which produce the aurora. During the auro-ral activations the upgoing and downgoing beams move and change their intensities simultaneously.
Keywords. Magnetospheric physics (Auroral phenomena;
Plasma waves and instabilities; Storms and substorms)
1 Introduction
Broadband VLF auroral hiss is an electromagnetic wave phe-nomenon, often observed in the vicinity of the Earth’s auroral regions (e.g. Sazhin et al., 1993; Andre, 1997; LaBelle and Treumann, 2002). A large number of early ground-based observations confirmed connection of auroral hiss with the visible aurora and with the substorm magnetic disturbances. Measurements on board low-orbiting satellites demonstrated that occurrence of auroral hiss is correlated with electrons
Correspondence to: E. E. Titova
(lena.titova@gmail.com)
precipitating at energies 3–4 keV (Gurnett, 1966), or less than 1 keV (Laaspere and Hoffman, 1976), and with inverted V electron precipitation events (Gurnett and Frank, 1972). Ground-based and rocket observations also revealed close as-sociation between VLF hiss and the auroral arc in the evening sector (Bering et al., 1987). Results of satellite studies at low altitudes show that auroral hiss propagates in the whistler mode at frequencies below the electron cyclotron frequency or the electron plasma frequency, whichever is smaller. Mea-surements of the Poynting flux of auroral hiss at altitudes below 5000 km demonstrated that in most cases, waves were propagating downward (Gurnett et al., 1971; Kasahara et al., 1995). At low altitudes, downgoing auroral hiss is consid-ered to be generated below the auroral potential drop by downgoing field-aligned electrons (from 100 eV to above 1 keV) by the Landau resonance (Maggs, 1976; Maggs and Lotko, 1981).
The DE-1 spacecraft carried out first observations of au-roral hiss at higher altitudes between 1 and 4 RE (Gurnett et
al., 1983). Whistler mode auroral hiss was almost always observed by the spacecraft when it crossed the auroral zone. Auroral hiss usually has a specific funnel-shaped lower fre-quency boundary. Gurnett et al. (1983) explained this fea-ture by the limitation of ray angles for whistler-mode waves propagating upward with wave vectors close to the resonance cone. This explanation has been experimentally confirmed only recently (Santol´ık and Gurnett, 2002). Direct measure-ments of the wave normal and the Poynting flux direction on the POLAR satellite at a radial distance of 5 RE showed
that funnel-shaped auroral hiss propagates upward with the Poynting flux directed outward from the auroral oval. The wave vectors were found to be close to the whistler mode resonance angle.
Since downgoing auroral hiss observed at low altitudes closely correlates with downgoing low-energy electrons beams, Gurnett et al. (1983) supposed that auroral hiss at
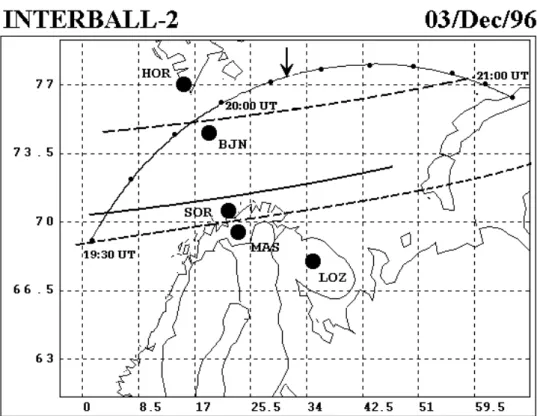
Fig. 1. Projection of the INTERBALL-2 orbit on 3 December 1996 (dots on the trajectory mark 10-min intervals) and location of magnetic
stations of the IMAGE network (big points). Boundaries of the auroral particle precipitation zone (dashed lines) discovered from the ground and satellite observations are also shown, as well as the position of the bright auroral arc inside of the precipitation zone. The arrow marks the projection of the satellite along magnetic field lines on the ionosphere for the onset of auroral hiss near 20:13 UT on INTERBALL-2 (see Fig. 2).
altitudes of DE-1 is produced by upgoing beams of elec-trons from the acceleration region located at lower altitudes. However, sufficiently energetic upgoing electron beams were rarely visible in particle data in the early satellite experi-ments (Klumpar and Heikkila, 1982), whereas auroral hiss was recorded very frequently during the DE-1 auroral zone crossings (Gurnett et al., 1983). More recently, observations of the FAST spacecraft have shown that upward energetic electron beams with energies up to several keV are fairly of-ten registered in the auroral zone (Carlson et al., 1998a, b). The upward beams were observed above the auroral zone in winter months at altitudes between 2000 and 4000 km in 78% of the passes. These beams might be the source of auroral hiss at high altitudes.
In this paper we present the auroral hiss observations per-formed by the INTERBALL-2 and POLAR satellites at high altitudes of more than 2 RE, poleward from the auroral oval.
The intense auroral hiss bursts, with fast and significant vari-ations of the low cutoff frequency, were registered by satel-lites in the polar cap. It is important to note that during these events the satellites were close to their apogee, had low orbital velocities and, as a consequence, the latitude of the satellite footprint almost did not change. Therefore, the variations of auroral hiss frequency were not related to the change in the satellite position, as was the case of the DE-1
observations. It is reasonable to think that in our cases the amplitude and frequency variations of auroral hiss were re-lated to intensifications of the source of the auroral hiss and to its motion relative to the satellite. The aim of the present paper is to investigate this possibility by studying the relation of hiss to the auroral dynamics. Similar comparison of auro-ral hiss and the aurora has been done for two events on the INTERBALL-2 satellite (Titova at al., 1999).
The INTERBALL-2 satellite was launched on 29 Au-gust 1996, with an apogee of 19 200 km, perigee of 800 km and inclination of 62.8◦. The observations of VLF/ELF waves were performed in November and December 1996, when the INTERBALL-2 apogee was projected on the night-side of the polar cap at latitudes of 72–75◦. Broadband VLF wave measurements were made for the electric and magnetic field components in the frequency range 20 Hz– 20 kHz. The detailed description of the wave measurements by the INTERBALL-2 satellite was done by Mogilevsky et al. (1998) and Lefeuvre et al. (1998). For the analysis of auroral dynamics the ground-based aurora observations at Loparskaya and Lovozero stations (Kola peninsula, north-west of Russia) were used, together with the imager data from the POLAR and DMSP satellites.
The POLAR satellite was launched in February 1996 into a polar orbit with an apogee of 50 000 km and a perigee
2 R(R )E 3 3 4 LAT INV Relativeamplitude 0.0 0.2 0.4 0.6 0.8 1.0 k
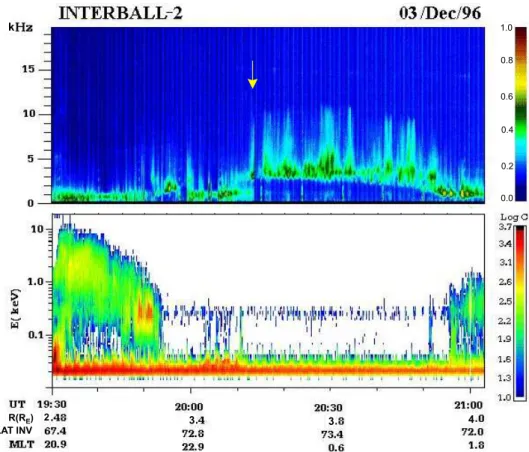
Fig. 2. INTERBALL-2 electron flux and VLF wave observations on 3 December 1996. Top panel: Spectrogram of the electric component
of VLF emissions. The arrow marks the onset of auroral hiss near 20:13 UT on INTERBALL-2. Bottom panel: INTERBALL-2 electron energy-time spectrogram in the range 0.02–14 keV. The electron counts rates C (counts/s) are color-coded.
Appearance of auroral hiss on board INTERBALL-2 is situated well poleward from the auroral oval, and it correlates with the beginning of a weak localized magnetic bay at station SOR (Fig. 3).
of 14 000 km. POLAR has three orthogonal electric anten-nas, triaxial magnetic search coils, and a magnetic loop an-tenna. The Plasma Wave Instrument (PWI) on the POLAR spacecraft (Gurnett et al., 1995) was designed to provide wave measurements in the frequency range from 0.1 Hz to 800 kHz. Several receiver systems were used to process the data: a wideband receiver, a high-frequency waveform re-ceiver (HFWR), a low-frequency waveform rere-ceiver, multi-channel analyzers, and sweep frequency receivers (SFR).
2 Observations
2.1 Auroral hiss and weak disturbances of the pseudo-breakup type
Let us consider the relationship between auroral hiss and aurora dynamics for weak disturbances. A typical exam-ple of auroral hiss during weak magnetic disturbances of the pseudo-breakup type occurred on 3 December 1996. Fig-ure 1 shows the INTERBALL-2 satellite trajectory for the event of 3 December 1996. At 19:30 UT and 19:53 UT the INTERBALL-2 crossed the evening auroral zone bound-aries, which are marked with a dashed line. Then, the
satellite remained for almost one hour poleward of the auroral oval and came back into the precipitation zone at about 20:55 UT. Figure 2 shows the boundaries of the auroral particle precipitation zone discovered from the INTERBALL-2 electron energy spectrogram in the range 0.02–14 keV.
During this pass the satellite observed several types of ELF/VLF emissions (Fig. 2). Inside the auroral zone from 19:30 UT to ∼19:55 UT ELF hiss was detected. Auroral hiss with increasing frequency was detected just poleward of the auroral zone near 19:55 UT. This was a weak polar part of the funnel-shaped auroral hiss observed by DE-1 (Gurnett et al., 1893). Soon afterwards, at 20:00 UT, a burst of nar-rowband ELF hiss at frequency about 1 kHz occurred and, simultaneously, electron flux at energy of 20–30 eV was ob-served on INTERBALL-2 (Fig. 2). The bursts of narrowband ELF hiss appear sometimes in the nightside auroral zone at high altitudes; however, their origin has not been understood yet (Santol´ık et al., 2001).
A new intensification of auroral hiss with a lower cutoff frequency at 3 kHz started at about 20:13 UT. This intensi-fication of auroral hiss correlates with the beginning of the magnetic bay at the Soroya (SOR) station (Fig. 3) and with
Fig. 3. Magnetograms of the IMAGE network stations for 3
Decem-ber 1996. The arrow marks the onset of auroral hiss near 20:13 UT on INTERBALL-2 (Fig. 2). The very weak magnetic disturbance about 50 nT started almost simultaneously with the appearance of auroral hiss. The disturbance is visible only on one single station (Soroya at a geomag. latitude of 67.2◦).
the appearance of an auroral arc, registered by a TV camera in Lovozero (LOZ). The position of the auroral arc is shown in Fig. 1. Magnetograms obtained from the Scandinavian IMAGE network, presented in Fig. 3, show that the magnetic disturbance was registered only by the Soroya station and was very weak (about 50 nT); this allows us to classify it as a pseudo-breakup.
The lower frequency cutoff of the auroral hiss was con-stant and then it started to decrease gradually. The frequency minimum has been achieved at 20:55 UT, as the satellite was again crossing the polar boundary of the auroral zone, when the ELF hiss was detected. Unfortunately, there are no data available on auroras from the POLAR satellite for this event, and we could not trace the global auroral dynamics in detail. But we can see that when the INTERBALL-2 satellite was moving nearly tangentially, just outside of the auroral oval, it registered a relatively stable low frequency cutoff of auroral hiss.
In other pseudo-breakup cases that we have analyzed from the INTERBALL-2 polar-cap orbits, the appearance of auro-ral hiss was often well-correlated with the beginning of weak magnetic disturbances and with an intensification of single arcs. Usually, during such weak disturbances there were no significant movements of auroras, and the low frequency cut-off of auroral hiss did not change.
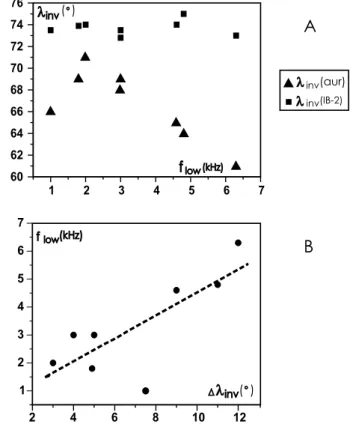
inv(aur) inv(IB-2) 2 4 6 8 10 12 1 2 3 4 5 6 7 inv( ) flow(kHz) 1 2 3 4 5 6 7 60 62 64 66 68 70 72 74 76 flow(kHz) inv( )
A
B
Fig. 4. Relationships between the low frequency cutoff of auroral
hiss and the distance from INTERBALL-2 footprint to aurora for weak disturbances. (a) Invariant latitudes of the INTERBALL-2 footprint (squares) and aurora (triangles) for different lower cut-off frequencies of auroral hiss. The greater the difference is be-tween latitudes of the aurora and the INTERBALL-2 footprint, the higher the low frequency cutoff is of auroral hiss on the satel-lite. (b) Dependence of auroral hiss cutoff frequency, flow, on the difference between the invariant latitudes of the INTERBALL-2 footprint and aurora. The regression equation (dashed line) is flow(1λinv)=(0.4±0.1) 1λinv+(0.4±1.0), the slope 1flow/1λinv is equal to 0,4 kHz/deg.
2.2 Relationships between the lower frequency cut-off of auroral hiss and the distance between the INTERBALL-2 footprint and aurora for weak distur-bances
In this section we will consider how the low frequency cut-off of auroral hiss depends on the distance of the satellite footprint from the aurora. We have selected several cases of the weak auroral intensifications (pseudo-breakup) without any significant auroral expansion, as observed by the ground-based TV cameras or by the POLAR imagers. During each of these events the INTERBALL-2 satellite was situated near apogee in the nightside polar cap; geomagnetic latitude of the satellite varied only within 2◦(73◦–75◦), whereas the aurora latitude changed within 10◦(61◦–71◦, Fig. 4a).
The low frequency cutoff of auroral hiss increases along with the decrease of the aurora latitude (Fig. 4a) and with the latitudinal difference between the INTERBALL-2 footprint
2 4 6 8 10 12 14
kHz
0INTERBALL - 2
24 Nov/96
/
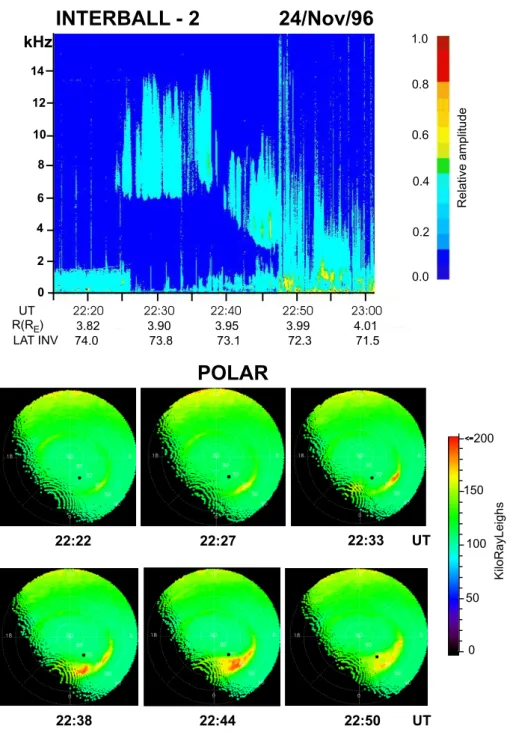
22:20 22:30 22:40 22:50 23:00 22:22 22:27 22:33 UT 22:38 22:44 22:50 UT 0 50 100 150 200POLAR
KiloRayLeighs UT 3.82 3.90 3.95 3.99 4.01 R(R )E 74.0 73.8 73.1 72.3 71.5 Relativeamplitude 0.0 0.2 0.4 0.6 0.8 1.0 LAT INVFig. 5. Upper panel: spectrogram of the electric component of VLF waves recorded by INTERBALL-2 on 24 November 1996 during the
development of a strong substorm. Bottom panel: sequence of auroral images obtained by POLAR satellite VIS imager. The images are in InvLat-MLT coordinates. The INTERBALL-2 footprint is indicated by black points.
and the aurora (Fig. 4b). This increase could be related to the propagation of the whistler waves characterized by the wave normal angle on the resonance cone and generated in a source situated on the auroral field lines (Gurnett et al., 1983). 2.3 Auroral hiss and intense substorms
Let’s consider an example of auroral hiss observed by INTERBALL-2 during an intense substorm on 24 November 1996. Figure 5 presents the spectrogram of VLF emissions
obtained by INTERBALL-2 (on the upper panel) and the au-roral data from the POLAR satellite (on the bottom panel). During this event, INTERBALL-2 was close to its apogee, and its magnetic projection (footprint) on the ionosphere only slightly changed during the time interval of interest. Auro-ral hiss appeared at about 22:25 UT, when INTERBALL-2 was situated in the polar cap at a latitude of 74◦. This correlates with weak auroral intensification at the latitude of 60◦in the early morning sector. When the cutoff frequency of auroral hiss was near 6 kHz, the latitude of this weakly
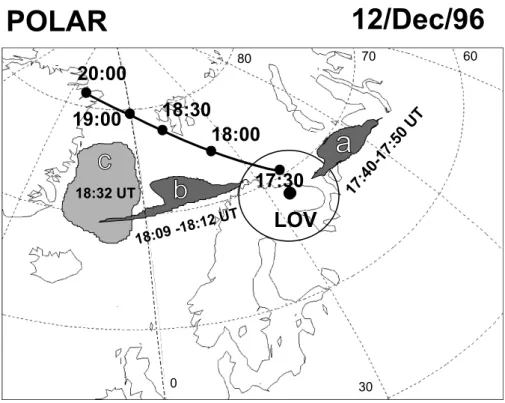
Fig. 6. The projection of the POLAR orbit on 15 December 1996 is shown by a line marked with time points. The dark areas “a”, “b”, “c”
show schematically the position of aurora maximum for the different times. A circle is the field of view of the all-sky TV camera situated in Lovozero.
intensified aurora remained almost unchanged. The analy-sis of the IMAGE magnetometer network data showed that auroral hiss and the aurora started simultaneously with the onset of a strong (∼500 nT) substorm. A new auroral in-tensification appears in the midnight sector, as it is shown by the POLAR imager data for 22:38 UT. After this in-tensification, the auroral bulge develops, the aurora quickly moves poleward, and the poleward boundary of the aurora reaches the INTERBALL-2 footprint at 22:48 UT. This en-counter is confirmed by the ION instrument data on board the INTERBALL-2, which measures particles with energies
<30 keV. During the breakup and the poleward motion of the aurora, the low frequency of auroral hiss quickly de-creases from 6.5 kHz (at 22:38 UT) to 3 kHz (at 22:45 UT). It should also be recalled that the invariant latitude of the INTERBALL-2 footprint almost did not change during this substorm.
The analysis of about 10 other intense substorms con-firmed a qualitatively similar behavior of auroral hiss as we described above for 24 November 1996. When the INTERBALL-2 satellite was in the polar cap in the night sec-tor, the appearance of auroral hiss was correlated with the on-set of the substorm and the corresponding auroral intensifica-tion. The auroral hiss frequency always decreases during the substorm expansion phase associated with the fast movement of the auroral poleward boundary toward the INTERBALL-2 footprint. Note that such poleward movement of the aurora is typical for the substorm expansion phase.
2.4 Longitudinal dynamics of the auroral hiss source Below we consider another event showing the relationship between the auroral hiss characteristics and longitudinal dy-namics of discrete auroras during a substorm. Multicompo-nent wave measurements on the POLAR spacecraft allow us to find direction towards the source and hence to determine the motion of the source in longitude. Figure 6 shows the trace of the POLAR satellite for the time interval 17:30– 20:00 UT on 15 December 1996. During this time inter-val the substorm occurred. Figure 7 (upper panel) represents the spectrogram of the SFR analyzer (Gurnett et al., 1995), showing that both auroral hiss at frequencies 1.5–6 kHz and AKR (f>50 kHz) emissions intensified at about 17:35 UT. At the same time magnetograms obtained from the IMAGE network exhibited the intensification of the westward electro-jet (Fig. 7, lower panel). Further on, we will concentrate on the interval 17:40–18:10 UT, when the simultaneous wave-form measurements of the electric and magnetic fluctuations by the HFW receiver of the plasma wave instrument on the POLAR satellite enabled us to estimate the direction of the Poynting vector of auroral hiss.
Figure 8 shows the result of the Poynting vector deter-mination. The HFWR instrument measured the waveforms of the three magnetic and three electric components at fre-quencies below 2 kHz. The data are organized into short snapshots of 0.458 s which are taken with a periodicity of 128.8 s. Figure 8a represents a time-frequency power spec-trogram of the electric field fluctuations. Each column is
SOR MAS MUO PEL X-COMPONENT 500nT 17:00 17:30 18:00 18:30 19:00 19:30 20:00
IMAGE magnetometer network
POLAR PWI Ez
15/Dec/96
10 10 10 10 10 10 10 10 3 -16 -14 -12 -10 -8 5 4 Frequency(Hz) SCET 17:00 17:30 18:00 18:30 19:00 19:30 20:00 RE 3.98 4.72 5.39 5.98 6.51 7.38 22.28 54.64 21.43 23.23 21.12 15.46 4.59 L MLT 20.59 6 .90 10.34 20.85 21.81 35.31 6.97 VmHz 2 -2 -1 20.35
Fig. 7. Upper panel: power spectrogram of the electric field in the frequency range 5·102–105Hz recorded by the POLAR satellite on 15 December 1996. Bottom panel: magnetograms of the Scandinavian IMAGE network for 15 December 1996. The auroral hiss on board POLAR satellite occurs during a substorm magnetic disturbance registered by the IMAGE network.
obtained as a sum of the power spectra of the separate elec-tric components from one single snapshot of data. The re-sults are represented in the frequency range 0.5–2.0 kHz. The intensifications of the wave power correspond to the bursts of the auroral hiss shown in the top panel of Fig. 7. Fig-ures 8b–d show estimations of the three components of the Poynting flux in the coordinate system, defined by the local stationary magnetic field B0. The z axis is oriented along B0 (approximately downward in the Northern auroral
re-gion), the x axis is oriented in the plane of the local mag-netic meridian (to the north), and the y axis (oriented to the east) completes the system. The three components of the
Poynting flux are normalized by their standard deviations ob-tained from the properties of the spectral analysis using the method described by Santol´ık et al. (2001). The results can be obtained only if the magnetic field fluctuations are strong enough (>2×10⁻⁹nT2Hz−1), which is the case only for the strongest bursts.
First of all, the measurements between 17:40 and 18:10 UT show that the component of the Poynting flux par-allel to the magnetic field is directed upward at the frequen-cies of auroral hiss. The meridional component of the flux is directed mainly northward. As to the longitudinal com-ponent, its direction changes significantly. At ∼17:45 UT
. POLAR HFWR 15 December 1996
UT:
1800
1830
1900
R (R
E):
5.39
5.98
6.51
MLAT (deg):
43.80
51.55
58.05
MLT (h):
20.85
21.12
21.43
L:
10.34
15.46
23.22
(a)
10
-6
10
-5
10
-4
10
-3
10
-2
mV
2m
-1Hz
-10.6
1.0
1.4
1.8
f (kHz)
(b)
-1.0
-0.5
0.0
0.5
1.0
S
Z/
σ
S
Z0.6
1.0
1.4
1.8
f (kHz)
(c)
-1.0
-0.5
0.0
0.5
1.0
S
X/
σ
S
X0.6
1.0
1.4
1.8
f (kHz)
(d)
-1.0
-0.5
0.0
0.5
1.0
S
Y/
σ
S
Y0.6
1.0
1.4
1.8
f (kHz)
Fig. 8. Results of analysis of the multicomponent waveform measurement of the HFWR instrument on board the POLAR spacecraft. (a) Time-frequency power spectrogram of the electric field fluctuations. (b–d) Estimations of the three components of the Poynting flux
normalized by their standard deviations in the coordinate system defined by the local stationary magnetic field B0using the method of
Santol´ık et al. (2001). The results are presented only for the time-frequency intervals where the magnetic field fluctuations are stronger than 2×10⁻⁹nT2Hz−1, and at the same time the electric field fluctuations are stronger than 10−5mV2m−2Hz−1.
this component is directed westward, but at 18:02 UT and 18:10 UT it is directed eastward. This means that the source of emissions moves in longitude in the east–west direction.
Auroral observations are available for this event. Until
∼18:00 UT the auroras were observed from the ground by the all-sky TV camera situated in Lovozero. Its field of view is shown in Fig. 6 by a circle. Figure 9 shows a sequence of selected TV frames demonstrating the aurora development. The first auroral brightening appears in the eastern horizon at 17:36 UT, and then the auroral arc propagates from the east to the west. This clearly says that the substorm cen-ter is eastward of the Lovozero station (and to the south-east from the POLAR satellite footprint location). Schematically, it is shown in Fig. 6 by a dark area. The next auroral ac-tivation occurred around 17:45 UT. It started as an auroral
arc flash slightly poleward of the preceding one. Again, the brightening propagates from the east to the west, suggesting that the substorm activation is eastward of Lovozero. The auroral activations are associated with a poleward shift of auroras, so by ∼18:00 UT the discrete arcs leave the field of view of the TV camera. However, information on fur-ther aurora dynamics can be obtained from the auroral im-ages from the DMSP F12 and F13 satellites. These data (not shown) are placed at http://sd-www.jhuapl.edu/Aurora and at http://spidr.ngdc.noaa.gov/. The two satellites had fortunate passes above the region of interest around 18:10 UT. They observed the auroral bulge and its westward part (westward traveling surge – WTS) between Scandinavia and Green-land (also shown in Fig. 6 as the dark area “b”). Note that WTS is the region of the most bright and dynamic auroras.
17:37:51 UT 17 43 23: : UT 17:45:08 UT 17:46:39 UT 28 36 44 66 70 17:36: 1 UT5 17:36:21 UT 28 36 44 66 70 28 36 44 66 70 28 36 44 66 70 28 36 44 66 70 28 36 44 66 70 0 42 85 127 170 212 255 RelativeUnits
Fig. 9. Sequence of selected TV frames, obtained by the all-sky TV camera situated in Lovozero. The field of view of the TV camera is
shown in Fig. 6 by a circle. The auroral dynamics for time before 18:00 UT shows that the maximum of aurora activation is eastward of Lovozero.
Combining the observations from Lovozero and DMSP satel-lites one can conclude that, although the first substorm acti-vations started approximately at the same latitude and east-ward of the Lovozero station, in the late stage of the sub-storm, the bright discrete auroras shifted poleward and to the west. This behavior of auroras agrees with the direc-tion of the Poynting flux obtained from the POLAR PWI data (Fig. 8). Unfortunately, the POLAR satellite aurora im-ages are only available starting at 18:30 UT. Nevertheless, the POLAR imager data confirm poleward-westward devel-opment of the auroras during this substorm. The location of bright auroras seen from POLAR at 18:32 UT is also shown in Fig. 6 (the dark area “c”).
Note that during this event the lower cutoff of whistler-mode hiss does not show any systematic decrease during the substorm expansion, as is shown for other strong substorm events (Fig. 5). This is evidently due to the mutual location of the satellite and auroras. Indeed, during the substorm ex-pansion, POLAR moved in the same (north-west) direction as the auroral bulge did. So, the average distance between bright auroras and the satellite footprint was relatively sta-ble.
3 Summary
The main results of auroral hiss observations on the INTERBALL-2 and POLAR satellites in the nighttime po-lar cap at high altitudes can be summarized as follows:
– The satellites situated on the nightside and poleward
from the auroral oval recorded strong variations of auro-ral hiss intensity and frequency. The appearance of au-roral hiss is correlated with the beginning of both strong substorms and weak intensifications of isolated auroral arcs.
– While the satellite footprint latitude remained almost
unchanged, the low frequency cutoff of auroral hiss in the polar cap varied considerably, within several kHz. These low frequency cutoff variations were related to the development of magnetic disturbances and auroral dynamics. The auroral hiss cutoff frequency always de-creased during the strong substorm and remained es-sentially stable during weak disturbances of the pseudo-breakup type.
– The observed auroral hiss low-frequency cutoff
de-pended on the distance between the satellite footprint and the aurora. The frequency decreased when the lati-tude distance between the satellite footprint and the ac-tive auroras decreased and vice versa.
– The multicomponent wave measurements of auroral
hiss on the POLAR spacecraft show that the waves propagated upward from the auroral region. The Poynt-ing vector of auroral hiss turned, accordPoynt-ing to longitu-dinal displacements of the maximum of the aurora.
aurora “Inverseaurora“
Polar cap
SATELLITE Acceleratting region (Source) VLF wa ve s f < f V source V source f t f t 1 2Fig. 10. A schematic showing the relationship between the characteristics of auroral hiss and the auroral dynamics. The left part shows
the Birkeland current system, where downgoing and upgoing beams of accelerated electrons are formed. The upgoing beams generate the upgoing VLF waves. Resonance VLF waves having higher frequencies propagate at larger angles to the magnetic field. The right part shows the auroral hiss frequency alteration depending on the direction of movement of the electron upward acceleration region. The auroral hiss frequency registered by the satellite in the polar cap decreases as the upward electron acceleration region (a source of auroral hiss) approaches the satellite and vice versa.
4 Discussion
As we have mentioned in the Introduction, Gurnett et al. (1983) performed the first analysis of auroral hiss at high altitudes using the DE-1 satellite data and proposed that (1) the VLF waves are generated at the resonance cone and prop-agate upward from a localized source below the spacecraft, and (2) auroral hiss at high altitudes is produced by an up-ward beam of low energy electrons. The first hypothesis was confirmed quite recently on the basis of POLAR satellite ob-servations. Using multicomponent wave measurements of the POLAR spacecraft at a radial distance of 5 Earth radii, Santol´ık and Gurnett (2002) provided the direct evidence that auroral hiss propagated upward and the wave vectors were found close to the whistler mode resonance angle. Our re-sults are also in agreement with the first conclusion of Gur-nett et al. (1983).
However, the direct confirmation of the second statement is still absent. Only the example of the auroral hiss correla-tion with upgoing 50 eV electrons in the dayside polar cusp was shown (Lin et al., 1984). However, this result contra-dicts with results by Morgan et al. (1994), who investigated the role of Landau damping for upward propagating auroral hiss. Morgan et al. concluded that auroral hiss observed by DE-1 must be produced by the electron beam with energies larger than 1 keV.
Our results demonstrate a relationship of time and fre-quency characteristics of auroral hiss with variations of au-roras, that is, downgoing electrons. The revealed close con-nection between auroral hiss and aurora intensifications can mean that upgoing electron beams intensify simultaneously and move together with downgoing electron beams produc-ing the aurora. Such a relationship is consistent with the re-sults obtained on board the FREJA and FAST satellites. The FREJA and FAST observations have revealed symmetry be-tween the two parts of the auroral current circuit. The upward current region is associated with negative potential structures accelerating electrons downward towards the Earth’s atmo-sphere, while the downward current region is associated with positive potential structures accelerating ionospheric elec-trons away from the Earth (Klumpar and Heikkila, 1982; Carlson et al., 1998b). The strong spatial relationship be-tween up- and downgoing electron beams is also evidenced by observations of the optical phenomenon called “black au-rora” (Marklund and Karlsson, 1997). It is accepted that the black auroras observed near the bright auroral forms corre-spond to regions of the upward acceleration of electrons.
It is worth noting that the variations of the hiss parameters reflect the peculiarities of the auroral disturbances, thus the high-altitude hiss observations at high latitudes could be used to monitor the development of the auroral substorm dynam-ics. During the substorm the bright discrete aurora expands
both poleward and westward. As we have shown, the pole-ward movement of auroras is associated with the decrease of the lower-frequency cutoff of hiss, and the westward move-ment of auroras is related to the turning of the Poynting vec-tor from east to west.
An auroral substorm lasts for about 1.5 h and consists of a number of 1-min-long separate activations assembled into groups with a duration of 5–10 min and a repetition rate of about 10 min (e.g. Sergeev and Yahnin, 1979; Yahnin et al., 1983). A similar temporal structure was observed by the INTERBALL-2 and POLAR satellites (Fig. 7): a few-minutes-long burst of auroral hiss and AKR at ∼100 MHz were repeated after 10-min-long intervals. Correlation of the AKR intensity with the downward electron flux that produces the aurora is well known (Gurnett, 1974). Therefore, the temporal structure of AKR is related to the fine structure of quasi-static electric fields generating the auroral activations during the substorm. The temporal modulation of the auroral hiss intensity probably means that the same temporal struc-ture exists in the flux of upgoing electrons, and hence in the electric field producing the upgoing electron beams.
Another remarkable feature seen from our observations is that the bursts of auroral hiss correlate not only with the intense auroral structures during substorms, but also with rather weak intensifications of isolated auroral arcs. This means that upgoing electron beams (upward acceleration re-gions) can exist in connection with separate auroral arcs.
Figure 10 illustrates a possible relationship between down-and upward electron acceleration down-and the generation of high altitude auroral hiss. The left diagram shows particle ac-celeration regions within the Birkeland current system. The upward field-aligned current relates to the parallel potential drop that accelerates magnetospheric electrons downward into the atmosphere and creates the auroras. In the downward current regions the intense upgoing beams of field-aligned electrons with energies up to several keV generate upgoing VLF waves by Landau resonance.
According to multicomponent wave measurements on the Polar satellite, the wave vectors of VLF upgoing auroral hiss are close to the whistler mode resonance angles. Because the resonance angle of the whistler waves increases with the frequency and the ray direction is perpendicular to the wave vector near the resonance angle (Stix, 1992), the angle be-tween the ray direction and the magnetic field also increases with increasing frequency. Correspondingly, VLF waves at higher frequencies deviate strongly from the magnetic field and propagate across the field lines to larger distances from the source. When the source of whistler resonance waves (upgoing electron beam) moves toward a satellite, the satel-lite records high frequency waves first and lower-frequency waves afterwards (right diagram in Fig. 10). In other words, the frequency of the resonant VLF waves should vary pending on the direction to the source: the frequency de-creases when the source moves towards the satellite and vice versa. Such a relation between the frequency and the source position is valid for waves propagated right at the resonance cone. However, electron beams generate broadband VLF
hiss within some range of angles inside the resonance cone. Among all the waves the resonant ones deviate greatly from the magnetic field: this means that the frequency-position re-lationship discussed above should occur only for the lower cutoff frequency of auroral hiss, which is indeed observed.
5 Conclusion
Using INTERBALL-2 and POLAR satellites data we found a relationship between auroral hiss at high altitudes over the polar caps and the substorm dynamics of aurora. The inten-sifications of auroral hiss were correlated with the auroral activations during substorms and/or pseudo-breakups. The lower cutoff frequency of auroral hiss increases with the dis-tance between the aurora and the satellite footprint. Consid-ering the correlation between auroral hiss observed at high altitudes and the auroral dynamics, we can conclude that the region of the upgoing electron acceleration appears or be-comes more intense simultaneously with the variations in the acceleration region for the downward electrons.
In the present paper, we have only provided a qualita-tive explanation of the relationship between characteristics of high altitude auroral hiss and the dynamics of auroras. To use the auroral hiss observations for the diagnosis of the upward electron acceleration region, more work is needed. This fu-ture work should include simulation (modelling) of the gen-eration of auroral hiss by upgoing electron beams, as well as modelling of the propagation of whistler-mode waves, taking into account real parameters of the plasma medium in the ac-celeration region.
Acknowledgements. We are grateful to J. Smilauer for useful
comments, J.-A. Sauvaud for providing the electron data from the INTERBALL–2 satellites. E. E. Titova, A. G. Yahnin and M. M. Mogilevsky acknowledge a support from Division of Physical Sciences of Russian Academy of Sciences (Program 18). This work was supported partially by the grants A3042201 of GAAV, 205/03/0953 of GACR, INTAS 03-51-4132, NATO PST.CLG.980041, RFBR 04-05-64955. Research using the PO-LAR PWI data was supported by NASA Goddard Space Flight Cen-ter under grant NAG5-7943. O. Santol´ık acknowledges additional support from grants ME 650 and GACR 202/03/0832. Part of this work was done during the visit of ET and OS to Sodankula Geo-physical Observatory, supported by the EU LAPBIAT program, and during the visit of E. E. Titova to Bern, Switzerland, supported by International Space Science Institute.
Topical Editor T. Pulkkinen thanks A. Smith and two other ref-erees for their help in evaluating this paper.
References
Andre, M.: Waves and wave-particle interactions in the auroral re-gion, J. Atmos. S.-P., 59, 1687–1712, 1997.
Bering, E. A., Maggs, J. E., and Anderson, H. R.: The plasma wave environment of an auroral arc, J. Geophys. Res., 92, 7581–7605, 1987.
Carlson, C. W., McFadden, J. P., Ergun, R. E., Temerin, M., Peria, W., Mozer, F. S., Klumpar, D. M., Shelley, E. G., Peterson, W. K.,
Moebius, E., Elphic, R., Strangeway, R., Cattell, C., and Pfaff, R.: Fast observations in the downward auroral current region: Energetic upgoing electron beams, parallel potential drops, and ion heating, Geophys. Res. Lett., 25(12), 2017–2020, 1998a. Carlson, C. W., Pfaff, R. F., and Watzin, J. G.: The fast auroral
SnapshoT (FAST) mission, Geophys. Res. Lett., 25(12), 2013– 2016, 1998b.
Gurnett, D. A.: A satellite study of VLF hiss, J. Geophys. Res., 71, 5599–5615, 1966.
Gurnett, D. A. and Frank, L. A.: VLF hiss and related plasma obser-vations in the polar magnetosphere, J. Geophys. Res., 77, 172– 190, 1972.
Gurnett, D. A., Mosier, S. R., and Anderson, R. R.: Color spec-trograms of very-low-frequency Poynting flux data, J. Geophys. Res., 76, 3022, 1971.
Gurnett, D. A.: The Earth as a radio source: Terrestrial kilometric radiation, J. Geophys. Res., 79, 4227–4238, 1974.
Gurnett, D. A., Shawhan, S. D., and Shaw, R. R.: Auroral Hiss, Z mode radiation, and auroral kilometric radiation in the Polar magnetosphere: DE 1 observations, J. Geophys. Res., 88, 329– 340, 1983.
Gurnett, D. A., Persoon, A. M., Randall, R. F., et al.: Polar plasma wave instrument, Space Sci. Rev., 71, 597–622, 1995.
Kasahara, Y., Yoshida, K., Matsuo, T., Kimura, I., and Mukai, T.: Propagation characteristics of Auroral Hiss observed by Ake-bono Satellite, J. Geomag. Geoelectr., 47, 509–525, 1995. Klumpar, D. A. and Heikkila, W. J.: Electrons in the ionopheric
source cone: evidence for runaway electrons as carriers of down-ward Birkeland currents, Geophys. Res. Lett. 9, 873–876, 1982. Laaspere, T. and Hoffman, R. A.: New results on the correlation between low-energy electrons and auroral hiss, J. Geophys. Res., 81, 524–530, 1976.
LaBelle, J. and Treumann, R.: Auroral Radio Emissions, 1. Hisses, Roars, and Bursts, Space Science Reviews, 101(3), 295–440, 2002.
Lefeuvre, F., Parrot, M., Rauch, J. L., Poirier, B., Masson, A., and Mogilevsky, M.: Preliminary results from the MEMO multicom-ponent measurements of waves on-board INTERBALL 2, Ann. Geophys., 16, 1117–1136, 1998,
SRef-ID: 1432-0576/ag/1998-16-1117.
Lin, C. S., Burch, J. L., Shawhan, S. D., and Gurnett, D. A.: Corre-lation of auroral Hiss and upward electron beams near the Polar Cusp, J. Geophys. Res., 89, 925–935, 1984.
Maggs, J. E.: Coherent generation of VLF Hiss, J. Geophys. Res., 81, 1707–1724, 1976.
Maggs, J. E., and Lotko, W.: Altitude dependent model of the au-roral beam and beam-generated electrostatic noise, J. Geophys. Res., 86, 3439–3447, 1981.
Marklund, G. and Karlsson, T.: On low-altitude particle acceler-ation and intense electric fields and their relacceler-ationship to black aurora, J. Geophys. Res., 102, 17 509–17 522, 1997.
Mogilevsky, M. M., Golyavin, A. M., Aleksandrova, T. V., Ro-mantsova, T. V., Rusanov, A. A., Jir´ıcek, F., Tr´ıska, P., and Poirier, B.: Measurements of low frequency electromagnetic field onboard the Auroral probe satellite in the Interball project: The NVK-ONCH experiment, Cosmic. Res., 36, 587–592, 1998. Morgan, D. D., Gurnett, D. A., Menietti, J. D., Winningham, J. D., and Burch, J. L.: Landau damping of auroral hiss, J. Geophys. Res., 99, 2471–2488, 1994.
Santol´ık, O., Lefeuvre, F., Parrot, M., and Rauch, J. L.: Complete wave-vector directions of electromagnetic emissions: Applica-tion to INTERBALL-2 measurements in the nightside auroral zone, J. Geophys. Res., 106, 13 191–13 201, 2001.
Santol´ık, O. and Gurnett, D. A.: Propagation of auroral hiss at high altitudes, Geophys. Res. Lett., 29(10), 1191–1194, 2002. Sazhin, S. S., Bullough, K., and Hayakawa, M.: Auroral hiss: a
review, Planet. Space Sci., 41, 153–166, 1993.
Sergeev, V. A. and Yahnin, A. G.: The features of auroral bulge expansion, Planet. Space Sci., 27, 1429–1440, 1979.
Stix, T. H.: Waves in Plasmas, New York: American Institute of Physics, 1992.
Titova, E. E., Yahnin, A. G., Jir´ıcek, F., Smilauer, J., Mogilevsky, M. M., Romantsova, T. V., Rusanov, A. A., Sauvaud, J.-A., and Smith, R.: INTERBALL-2 observations of auroral hiss and the aurora dynamics, Czechoslovak J. of Physics, 49(4a), 657–666, 1999.
Yahnin A. G., Sergeev V. A., Pellinen R. J., Baumjohann, W., Kaila, K. U., Ranta, H., Kangas, J., and Raspopov, O. M.: Substorm time sequence and microstructure on 11 November 1976, J. Geo-phys. Res., 53, 182–197, 1983.