READ THESE TERMS AND CONDITIONS CAREFULLY BEFORE USING THIS WEBSITE. https://nrc-publications.canada.ca/eng/copyright
Vous avez des questions? Nous pouvons vous aider. Pour communiquer directement avec un auteur, consultez la première page de la revue dans laquelle son article a été publié afin de trouver ses coordonnées. Si vous n’arrivez pas à les repérer, communiquez avec nous à [email protected].
Questions? Contact the NRC Publications Archive team at
[email protected]. If you wish to email the authors directly, please see the first page of the publication for their contact information.
NRC Publications Archive
Archives des publications du CNRC
This publication could be one of several versions: author’s original, accepted manuscript or the publisher’s version. / La version de cette publication peut être l’une des suivantes : la version prépublication de l’auteur, la version acceptée du manuscrit ou la version de l’éditeur.
Access and use of this website and the material on it are subject to the Terms and Conditions set forth at
A Computational and experimental study of fire growth and smoke
movement in large spaces
Kashef, A.; Bénichou, N.; Lougheed, G. D.; McCartney, C. J.
https://publications-cnrc.canada.ca/fra/droits
L’accès à ce site Web et l’utilisation de son contenu sont assujettis aux conditions présentées dans le site
LISEZ CES CONDITIONS ATTENTIVEMENT AVANT D’UTILISER CE SITE WEB.
NRC Publications Record / Notice d'Archives des publications de CNRC:
https://nrc-publications.canada.ca/eng/view/object/?id=ef23f2e5-e7fe-4887-9878-9be6abb21dbc https://publications-cnrc.canada.ca/fra/voir/objet/?id=ef23f2e5-e7fe-4887-9878-9be6abb21dbcA Computational and experimental study of fire
growth and smoke movement in large spaces
Kashef, A.; Benichou, N.; Lougheed, G.D.;
McCartney, C.
A version of this document is published in / Une version de ce document se trouve dans : CFD 2002, the Tenth Annual Conference of the Computational Fluid Dynamics Society of
Canada, Windsor, Ontario, June 9-11, 2002, p. 1-6
www.nrc.ca/irc/ircpubs
NRCC-45201
A COMPUTATIONAL AND EXPERIMENTAL STUDY OF FIRE GROWTH AND
SMOKE MOVEMENT IN LARGE SPACES
Ahmed Kashef, Ph.D., P.Eng.
1, Noureddine Benichou, Ph.D.
2, Gary Lougheed, Ph.D.
3, and
Cameron McCartney
4[email protected], Noureddine.Benichou @nrc.ca Gary.Lougheed @nrc.ca, and
Cameron.McCartney @nrc.ca
1
Research Officer,
2Research Officer,
3Senior Research Officer and
4
Technical officer at the National Research Council of Canada, Ottawa, Ontario.
ABSTRACTTo show the applicability of different methods of simulating fire dynamics, this paper presents a computational and experimental study of fire growth and smoke movement in large spaces. The numerical results are obtained using three methods: 1) simple correlations; 2) a two-zone model (FIre Evaluation and
Risk Assessment system, FIERAsystem); and 3) a Computational Fluid Dynamics model (FDS).
This paper investigates the merits of the two fire models in an effort to develop robust engineering tools to study and evaluate fire safety and smoke exhaust systems. The investigation is conducted using two case studies. The first case study simulates an enclosed pool fire located in the paint workshop of an aircraft hangar. The second example investigates the effects of a fire in a mechanically-exhausted atrium space. Predictions of the numerical models of the second case study are compared with the data from a series of experiments conducted at the National Research Council of Canada (NRC) as part of a study to investigate the effectiveness of smoke management systems in large spaces.
INTRODUCTION
Spaces with high ceilings, such as warehouses, atria, aircraft hangars, and covered malls, represent some of the most difficult fire protection challenges with their complex geometry and possibility of containing large quantities of fuel, and housing valuable equipment such as airplanes. Moreover, these spaces often differ widely from current practices of a code-compliant building. In recognition of this fact, most building and fire safety codes contain equivalency clauses [1]. These clauses allow for the use of alternative methods and materials when equivalency to the prescriptive requirements can be shown to the authority having jurisdiction. In the past, the determination of equivalency has been based primarily on subjective judgement, which becomes more difficult as the complexity of a problem increases.
With the move towards performance-based codes, designers will have more flexibility in designing
structure in a cost-effective way. The requirements of performance-based codes are usually based upon explicitly stated objectives that allow the designers and building officials the freedom to develop innovative designs that will satisfy these objectives. Such innovative designs often lead to lower fire protection costs. The implementation of performance-based building regulations can be facilitated by the development of engineering tools that can help assess the overall fire safety performance of a building.
To show the use of different tools in a performance-based environment, fire behaviour in large spaces has been estimated. The analysis was conducted using predictive models that range from simple correlations derived from experimental [2,3] data through relatively simple computer-based zone models [4] to sophisticated and computationally intensive CFD models [5].
Zone Models
Zone models are one-dimensional models that divide a fire compartment into a number of characteristic zones, such as the upper hot layer, the lower cold layer, the fire plume and the compartment boundary. Conditions, such as temperature, pressure, and density in each zone, are assumed to be uniform. Each zone is modelled separately and then linked together through fluid dynamics and heat transfer equations. This approach simplifies computations and allows previously developed correlations, such as plume correlations or ceiling jet correlations, to be incorporated. An example of this group of fire models is the smoke model in FIERAsystem, being developed at the NRC [4].
CFD Models
Due to the rapid development of computer technology, the use of CFD models to simulate fire development and smoke movement is increasing quickly. The details of fluid flow and heat transfer provided by CFD models can prove vital in analysing problems involving far-field smoke flow, complex geometries, andimpact of fixed ventilation flows. The use of CFD models in fire dynamics problems has made
it possible to perform an engineering analysis of the fire safety performance of buildings to determine equivalency to prescriptive code requirements. However, simulation of fire development and smoke movement using CFD is a challenging endeavor, as fire-induced flows are turbulent and tend to generate eddies of many sizes. The energy from large eddies in which inertia forces dominant is transferred into smaller scale vortices associated with viscous forces with energy dissipated into heat. For typical fires, the small-scale vortices are in the order of millimetres. Thus high grid resolution is vital to properly model these small scales.
The majority of CFD models avoid this costly constraint by using turbulence models, e.g. k-ε models [6], to approximate the turbulent energy and dissipation produced by the fire. This approach results in a steady-state solution to an averaged version of the flow equations. Another approach, the Large Eddy Simulation (LES) [5], is to solve the large scales of motion and model the small scales that are assumed to be universal. The LES results in a transient solution to the actual Navier-Stockes equations. Because real turbulent flow situations are inherently transient, LES methods could have an advantage in modelling turbulent fire-induced flows. An example of the CFD-LES method is the NIST Fire Dynamic Simulation (FDS) model [5].
Description of the Experimental Facility
The second case study involves comparison of numerical predictions and experimental data from a series of tests conducted at NRC. The experimental facility was a large compartment with dimensions of 9 m x 6 m x 5.5 m height. The interior wall surface of the compartment was insulated using 25 mm thick rock fibre insulation. A fan was used to supply fresh air into the compartment through openings in the floor around the walls. These openings had a width of 0.1 m, and a total length of 22.8 m.
Thirty-two exhaust inlets with a diameter of 150 mm were located in the ceiling of the compartment. These inlets were used to extract the hot gases from the compartment during the tests. All exhaust ducts were connected to a central plenum. A 0.6 m diameter duct was used between the plenum and each exhaust fan. By using multiple exhaust inlets, smoke exhaust system parameters such as total area of exhaust inlet, velocity at the inlets and exhaust inlet location relative to the ceiling and the fire could be readily investigated.
A square propane sand burner was used for the fire source. The burner was capable of simulating fires ranging from 15 kW to 1,000 kW with three possible fire areas: 0.145 m2, 0.58 m2 and 2.32 m2. The heat
release rate of the fire was determined using two methods. The first method computes the heat release rate from the volume flow rate of propane supplied to the burner. The second method was based on the oxygen depletion method using oxygen concentrations, temperature and volume flow rate measured in the main exhaust duct.
The room was instrumented with thermocouples and pitot tubes for velocity measurements. Also, gas inlets were located in the room for extracting gas samples to determine CO2 concentrations at various
locations. More details of the small-scale facility and the instrumentation can be found in [7].
All tests were conducted over an extended period of time (up to 1 h). The test procedure was conducted by first starting all systems, including the mechanical exhaust system and data acquisition system. Then, the small burner was ignited and the propane flow rate was adjusted to provide a low heat release rate fire. All conditions in the test facility, except CO2
concentrations, were monitored continuously using the data acquisition system. The flow to the propane burner was adjusted to produce a steady state heat release rate and the conditions in the test facility were allowed to stabilize for approximately 15 min producing a steady clear height with upper layer exhaust. The CO2
concentrations at various heights were measured. This set of data, along with the temperatures measured at the same heights, was used to determine the height of the smoke layer. The heat release rate was increased and the previous steps were repeated. Using this test procedure, data could be acquired for several heat release rates under the same test conditions.
RESULTS AND DISCUSSION Aircraft Hangar Case Study
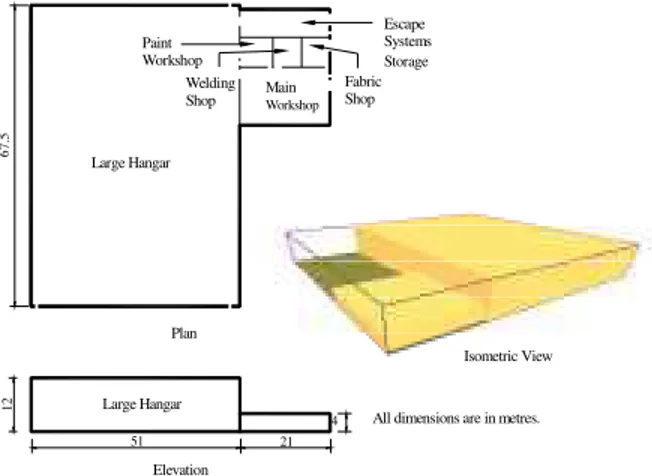
The aircraft hangar (referred to as Hangar 7) [8] consists of escape system storage, welding shop, fabric shop, main workshop, paint workshop, and the large hangar. Figure 1 shows the floor plan, the elevation, and an isometric view of the compartments that were modelled. The shop compartments have a total floor area of 572 m2 and the large hangar has a floor area of 3443 m2. For the simulation, all internal doors are assumed open and all external doors are assumed closed. The building is of concrete construction and sprinklered with no smoke/heat detectors installed.
The entire hangar is divided into a uniform grid consisting of 180 (along the 83 m length) by 160 (along the 67.5 m length) by 36 (along the height) cells producing 1,036,800 control volumes capable of resolving 0.30 m. Adiabatic boundary conditions were prescribed at the ceiling, walls, and floors. The
simulation, using FDS, was run for 400 s on a Pentium IV processor (1.7 GHz) and 1.0 GB memory. The simulation required a total CPU time of 40 h.
Large Hangar Main Workshop Paint Workshop Shop Fabric Welding Shop Escape Systems Storage 67 .5 12 Large Hangar
All dimensions are in metres.
Elevation Plan
4
51 21
Isometric View
Figure 1. Six compartments modelled in Hangar 7
The fire was located in the middle of the paint workshop and centred between four sprinklers. The paint workshop dimensions are 8.l m long, 6.7 m wide, and 4 m high with one door 1 m wide and 2.25 m high leading to the main workshop and another similar door that leads to the large hangar. There was also a 3 m wide by 2.75 m high roller door between the paint workshop and the large hangar. The fire source was limited to spilling within a dyke with a diameter of 4.0 m. The fire was estimated to reach flashover at 221 s and 20 MW heat release rate at 330 s (Figure 2), when all the fuel was consumed.
The kerosene fuel source had the following properties: heat of combustion of 40.3 MJ/kg; a radiative fraction of 0.35; carbon fraction of 0.85; hydrogen fraction of 0.15; oxygen fraction of 0.00; soot fraction of 0.01; and CO Fraction of 0.00. The radiative fraction represents the fraction of energy lost from the fire by radiation to the environment. The fire itself was prescribed in a manner consistent with a mixture fraction based approach to combustion, but detailed combustion chemistry is not simulated.
A measure of how well the fire was resolved is the non-dimensional expression D*/δx, where D* is the characteristic fire diameter, defined by
5 2 . *
=
∞ ∞C
T
g
Q
D
Pρ
and δx is the nominal size of a grid cell (0.30 m in this
case), ρ∞ and T∞ are the ambient density and temperature respectively, Cp is the constant pressure
specific heat, and g is the acceleration of gravity. For the present case, D* is about 3.1 m. The more cells
spanning the fire, the better the resolution of the calculation. The analysis was carried out with the ventilation system assumed closed representing the worst case scenario.
0 5000 10000 15000 20000 0 50 100 150 200 250 300 350 Tim e (s) HRR ( k W )
Figure 2. Heat release rate of the pool fire Simulation Results for Aircraft Hangar
Layer Interface Height: The interface height in a compartment is one of the important parameters used in both fire safety design guides and building codes. This parameter is usually used as a life safety criterion for evaluating fire protection designs. The zone model predictions of the depth of the hot layer with time for the paint workshop were used in the CFD models to calculate the upper layer hot gas temperature and species concentrations. The hot gas layer descends from 4.0 m, at ambient temperature, to 0.5 m above the floor at 320 s. At about 130 s, the hot gas layer falls to a height of 1.5 m above the floor representing untenable conditions for occupants in the paint shop.
Upper Layer Temperature: The results for the upper layer temperature from the zone and CFD models are presented in Figure 3. The temperature of the upper layer in CFD model was obtained using two approaches. The first approach determines the temperature by taking the average temperature of all nodes above the layer interface height. The other approach considers the maximum temperature of all nodes above the layer interface height to be the upper layer temperature. Figure 3 shows that there are a number of discrepancies on some data between the zone and CFD (second approach) models predictions, but in general a good agreement can be observed. The temperature in the compartment of fire origin increases rapidly to about 830°C (zone model) or 775°C (CFD model) after 320 s from ignition. Figure 3 shows also that the first approach of CFD produces much lower upper layer temperatures. This indicates that the zone model tends to predict conservative estimates of upper layer temperature.
Upper Layer CO2 Concentration and Visibility:
Figure 3shows CO2 production with time for the paint
0 2 0 0 4 0 0 6 0 0 8 0 0 10 0 0 0 50 10 0 150 2 0 0 2 50 3 0 0 3 50 T i me ( s )
CFD field model - averagre CFD field model - maximum Zone model
Figure 3. Paint workshop upper layer temperatures
0 . 0 4 . 0 8 . 0 12 . 0 16 . 0 0 5 0 10 0 15 0 2 0 0 2 5 0 3 0 0 3 5 0 T i me ( s )
CFD f ield model - av eragre CFD f ield model - max imum Zone model
Figure 4. Paint workshop upper layer CO2 profile
Again, the zone and CFD (second approach) models predictions compare well. Since kerosene is assumed as the fuel source, the two models predict no CO production. CO2 concentrations in the paint shop
indicate a gradual increase, reaching 15% after 330 s (zone model) and about 12% after 300 s (CFD model second approach). Figure 5 shows the predicted visibility (a measure of untenability) inside the paint workshop. The visibility is predicted to drop quickly to 5.0 m after 140 s from ignition. Based on FIERAsystem results, it is predicted that all occupants in the compartment of fire origin would take action in about 135 s and that they will evacuate in approximately 140 s. 0 100 200 300 0 50 100 150 200 250 300 350 Time (s) V isibility (m)
CFD field model - averagre CFD field model - minimum
Figure 5. Paint workshop visibility
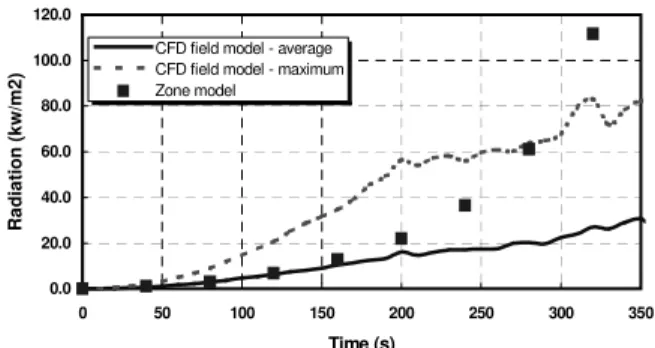
Radiation to Floor: Figure 6 presents the radiation to floor in the paint workshop as predicted by the zone
and CFD models. The zone and CFD (two approaches) models predict that the radiation flux to the floor rises to a value of 20 kW/m2 after 200 s, 120 s, and 280 s, respectively. At this value, it is expected that fire compartment contents will ignite and the paint workshop will reach the flashover condition. The predictions of zone models compare well with the CFD first approach up to 200 s, after which time the predictions start to deviate. This might be attributed to the difference and limitations in modelling radiation between the zone and CFD models.
0.0 20.0 40.0 60.0 80.0 100.0 120.0 0 50 100 150 200 250 300 350 Time (s) R a dia tion (k w /m 2 )
CFD field model - average CFD field model - maximum Zone model
Figure 6. Radiation to floor in the paint workshop Atrium Space Case Study
Results from the experiments and preliminary numerical simulations indicated that the conditions in the room were symmetric, so the room was modelled by considering only one quarter of the room (Figure 7). The computational domain was divided into a uniform grid of 96 x 60 x 72 control volumes. The total number of grid points for the simulations was 414,720. The walls of the enclosure were modelled as solid, adiabatic and hydro-dynamically smooth boundaries. These types of boundary are appropriate as the walls of the enclosure were insulated, and had a smooth surface. Symmetric boundaries conditions were used at the symmetry boundaries. At the ceiling vents, a constant mass flow rate was assigned based on the experimental data obtained at the quasi-steady state. At the floor openings, the total pressure was set to 101,325 Pa across the area of the openings. The inlet velocities were free to develop corresponding to the mass flow rate downstream. Inlet air temperature was assumed to be 297 K (24oC).
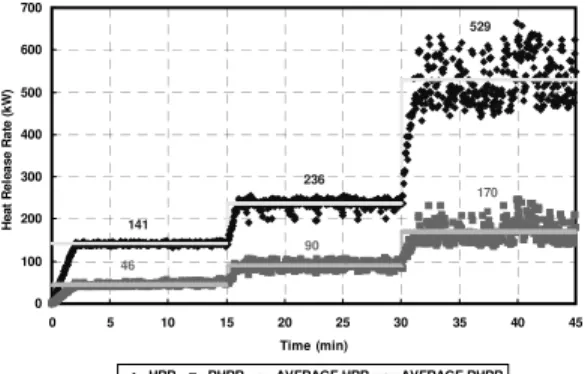
The heat release rates used in the numerical simulations were extracted from the experimental data. During the experiments, the propane flow rate was adjusted to a pre-determined level to produce the required heat release rate. Figure 8 shows the heat release rate (HRR) plateau used in the CFD simulations which replicates the results of a test with a total HRR of approximately 150 kW in the initial stage, 250 kW in the intermediate stage and 600 kW in the final stage of
floor supply Ceiling exhaust symmetry plan wall eiling xhaust fire pan Z Y X floor supply
Figure 7. CFD modelled domain
the test. The fire was maintained steady for about 15 min at each heat release rate to allow stable conditions to be reached in the test facility. A radiative fraction of approximately 0.30 of the total HRR (RHRR) was maintained during the simulation. The simulation required a total CPU time of 295 h.
529 141 236 170 90 46 0 100 200 300 400 500 600 700 0 5 10 15 20 25 30 35 40 45 Time (min) Heat Re le a se Ra te (k W) HRR RHRR AVERAGE HRR AVERAGE RHRR Figure 8. CFD simulation heat release rate
In the CFD simulations, propane was introduced at the fire location at a rate corresponding to the HRR of the test being considered. The area over which propane was introduced was similar to the area of the pan used in the tests. As only a quarter of the room was used for the CFD simulations, the HRR simulated was one fourth of the HRR of the tests. The simulations followed a transient approach and continued until steady state conditions were established in the room. Typically it took less than 5 min of simulation time to obtain a steady solution.
Simulation Results for Atrium Space
Figure 9 shows predicted and experimental profiles of temperature rise along the centre point of the room. The results shown are at a steady state condition for the 600 kW HRR, which was achieved approximately 35 min into the simulation. The predictions, at few centimeters away from the centreline of the room, appear to be in a good agreement with the experimental profile. At the room centre exactly, there is a
significant difference between experimental data and predictions. This might be attributed to thermocouples being located slightly off room centre. Similar observations were recorded for the other two HRR, namely, 150 and 250 kW. 0 .0 1 .0 2 .0 3 .0 4 .0 5 .0 6 .0 0 2 0 0 40 0 6 0 0 8 0 0 1 0 0 0 1 20 0 Te m pe ra tur e Ris e (oC) H e ig h t (m)
x/X=0.99 & y/Y=1.00 x/X=0.98 & y/Y=0.98 x/X=0.97 & y/Y=0.97 x/X=0.96 & y/Y=0.95 x/X=0.95 & y/Y=0.95 Expe r im e nt al
Figure 9. Temperature rise at room centre
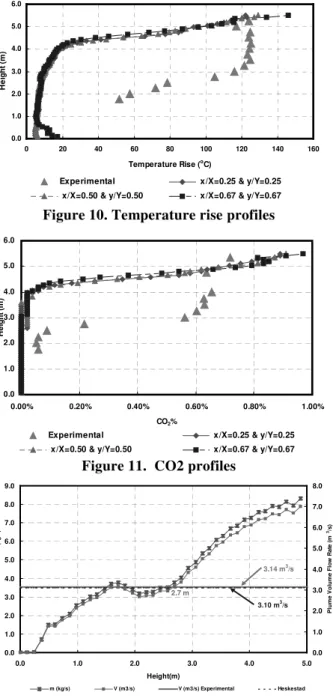
Figures 10 and 11 show the predicted and experimental temperature rise and CO2 profiles along
one-eight, one-quarter, and three-quarter points of the room for the 600 kW HRR.While predictions appear to be realistic, discrepancies exist between the numerical and the experimental profiles, especially in the hot layer. In this region, the experimental temperature is quite uniform and the interface between the hot and cold layers is clearly defined. Predicted temperature profile and CO2 show that the two parameters increase
with height and do not have a layer with uniform temperature. Similar observations were reported [7]. These discrepancies may be attributed to the differences in values of exhaust volumetric flow rates and to the thermal radiation estimated by the numerical model. Slight change in the values of volumetric rates, can greatly affect the rate of air entrainment, the rate of smoke production, and the interface height [2]. The predicted profiles at different points across the modelled domain indicate that similar conditions exist at all locations supporting the assumption of zone models that two layers are formed in the room.
In an ideal smoke management system and under steady state conditions, the smoke exhaust rate should be equivalent to the rate of smoke production. With a greater rate of mass supply than exhaust, the smoke layer interface is expected to descend. The rate of descent depends on the ratio of the exhaust to production rates. On the other hand, if the exhaust rate is greater than the production rate, the plugholing phenomenon might occur. In this case, the cold air beneath the smoke layer is drawn into the layer making its way to the exhaust system reducing its effectiveness.
In the physical model test, an equilibrium state between the measured exhaust rate (3.14 m3/s) and the calculated production rate (3.10 m3/s) was achieved [7].
Under this condition, the smoke layer height was calculated, using the equation developed by Heskestad [2], to be approximately 2.8 m. Figure 12 shows the mass and volume plume flow rates as function of height at the room centre point. The numerical model predicts a volumetric flow rate of 3.14 m3/s at height of 2.7 m.
0.0 1.0 2.0 3.0 4.0 5.0 6.0 0 20 40 60 80 100 120 140 160 Temperature Rise (o C) H e ig h t ( m )
Experimental x/X=0.25 & y/Y=0.25 x/X=0.50 & y/Y=0.50 x/X=0.67 & y/Y=0.67
Figure 10. Temperature rise profiles
0.0 1.0 2.0 3.0 4.0 5.0 6.0 0.00% 0.20% 0.40% 0.60% 0.80% 1.00% CO2% H e ig h t ( m )
Experimental x/X=0.25 & y/Y=0.25 x/X=0.50 & y/Y=0.50 x/X=0.67 & y/Y=0.67
Figure 11. CO2 profiles
2.7 m 3.14 m3/s 3.10 m3/s 0.0 1.0 2.0 3.0 4.0 5.0 6.0 7.0 8.0 9.0 0.0 1.0 2.0 3.0 4.0 5.0 Height(m) P lu m e M a ss F lo w R a te ( k g /s ) 0.0 1.0 2.0 3.0 4.0 5.0 6.0 7.0 8.0 Pl u m e Vo lu me F lo w R a te ( m 3/s ) m (kg/s) V (m3/s) V (m3/s) Experimental Heskestad
Figure 12. Plume flow rates across at centre point CONCLUSIONS
Two fire models were used as tools to evaluate fire protection systems for two case studies, namely, a Canadian DND aircraft hangar and an atrium space. The first model is a CFD model (FDS model) and the other is the zone model, FIERAsmoke.
In the first case study, comparisons of zone and CFD predictions were performed. A good agreement between the zone and the CFD was observed for both upper layer temperatures and CO2 concentrations. The
zone model tends to predict conservative values of these parameters.
In the second case study, comparisons of the CFD predictions with experimental data were performed. In general the comparisons indicated that the predicted hot layer temperatures and interface heights compare well with the experimental values. However, the temperature profiles comparisons showed some differences. While the experimental data showed that the temperatures in the upper layer are quite uniform, the predicted temperatures were not uniform.
REFERECES
1. Hadjisophocleous, G.V., Benichou, N., Torvi, D.A. and Reid, I.M.A., “Evaluating Compliance of Performance-Based Designs with Fire Safety Objectives”, 3rd International Conference on Performance-Based Codes and Fire Safety Design Methods, Lund University, Sweden, pp 307-318, 2000.
2. Heskestad, G., “Engineering Relations for Fire Plumes”, Fire Safety Journal, 7, pp 25-32, 1984. 3. McCaffrey, B.J. “Purely Buoyant Diffusion Flames:
Some Experimental Results”, NBSIR 79-1910, National Institute of Standards and Technology, Gaithersburg, MD, 1979.
4. Bénichou, N.; Hadjisophocleous, G.V.; Torvi, D.A.; Vollhoffer, S.R.; Reid, I. "Hazard analysis of a multi-occupancy building using FIERAsystem," 4th International Conference on Performance-Based Codes & Fire Safety Design Methods, Melbourne, Australia, 2002, to be published. 5. McGrattan, K.B., Baum, H.R. Rehm, R.G., Hamins,
A. and Forney, G.P, “Fire Dynamics Simulator – Technical Reference Guide”, NISTIR 6467, National Institute of Standards and Technology, Gaithersburg, MD, 2000.
6. Wilcox, D.C., Turbulence Modeling of CFD, DCW Industries, Inc., La Cañada, California, TA357.5.T87 W542, 1993.
7. Lougheed, G.D, Hadjisopocleous, G.V., “Investigation of Atrium Smoke Exhaust Effectiveness”, ASHRAE Transactions, V. 103, pp 1-15.
8. Kashef, A.; Bénichou, N. "Application of CFD modelling to study fire and smoke spread in an aircraft hangar," 2nd NRC CFD Symposium on Computational Fluid Dynamics, High Performance Computing and Virtual Reality, Ottawa, Ontario, Dec, 2001, pp. 1-8.