Characterizing protein conformation space
Anshul Nigham
1, David Hsu
2and Jean-Claude Latombe
31
Computer Science programme, Singapore–MIT Alliance,
2School of Computing, National University of
Singapore,
3Stanford University
Abstract— In this work, we propose a radical approach for exploring the space of all possible protein structures. We present techniques to explore the clash-free conformation space, which comprises all protein structures whose atoms are not in self-collision. Unlike energy based methods, this approach allows efficient exploration and remains general – the benefits of characterization of the space apply to all proteins. We hypothesize that this conformation space branches into many small funnels as we sample compact conformations. We develop a compact representation the conformation space, and give experimental results that support our hypothesis. Potential applications of our method include protein folding as well as observing structural relationships between proteins.
Index Terms— Protein structure, protein conformation space, protein folding
I. INTRODUCTION
It is well known that protein structure determines protein function. Consequently, predicting protein structure from se-quence, or protein folding is an important problem in biology. Although much progress has been done in recent years (e.g., homology [1] and ab-initio [2] techniques), this problem remains mostly open.
Traditional approaches treat this problem as a search for the lowest energy structure, or conformation, of a protein in the space of all possible structures, or conformation space. The energy of a protein structure is made up of many terms, and depends on the chemistry of the protein. As a result, the energy distribution of the space is different for different proteins, and the energy function has a large number of local minima, making it difficult to navigate.
In this work, we propose a radically different approach, which is based on two main ideas.
First, we define the clash-free subset of the conformation space of a protein structure we call it the free space to be the space of all structures in which no two atoms are colliding. The free space only takes into account the van der Waals energy terms. We treat it as the feasible space within which the protein can move. In contrast, we regard the other energy terms (like the electrostatic ones) as being responsible for steering the molecule toward its native conformation inside the free space. We hypothesize that the free space is a tree-shaped space consisting of many branching funnels. Around denatured conformations, the free space is open. As the protein folds and becomes compact the trajectories of motion lie in narrower funnels. The funnels end as collisions among atoms eventually prevent the protein cannot get more compact. The native conformation lies near such a dead-end.
The generic conformation space consists of many such trajectories and narrow funnels; we believe that the rest of the proteins energy guides the proteins folding toward the unique native state of a protein.
Secondly, we further hypothesize that the overall geometric structure of the tree-shaped free space is almost independent of the protein itself, in particular its amino-acid sequence (although the final fold to which the protein is eventually steered strongly depends on this sequence). So, we consider a generic protein-like chain modeled as a chain of beads and our goal is to compute a generic representation of the free space of this generic protein.
We build this representation as a tree of bifurcations. We define a fold as a group of similar conformations (usually lying in the same narrow funnel) and a bifurcation as a conformation at which the free space splits into separate funnels or folds. The bifurcation tree is rooted at the open, or denatured (least compact) structure of the protein chain. The leaves of this tree are the compact folds which may contain the unique native structure of a specific protein.
To construct the bifurcation graph, we first build a connected graph, or a roadmap of conformations in the free space of the generic chain of beads. This is done by performing a large number of random walks in free space and sampling conformations along those walks. Next, we determine folds and bifurcations by connecting the sampled conformations by simple clash-free paths.
Once the bifurcation tree has been constructed, it can be used in a number of ways. One example is to evaluate the energy function gradient of a specific protein at each bifurcation in the tree and determine how it steers the protein toward its native conformation. Another interesting application is to compare the folds recorded in the PDB [3] to the folds in the tree. If we think of the distance between two PDB folds as the number of bifurcations in the tree that separate them, then it would be interesting to determine how the PDB folds are distributed in the bifurcation tree and whether they form clusters.
After a brief survey of related work, we present preliminary techniques to build a bifurcation tree for a generic chain of beads. We then show some preliminary computational results. Our results show that the conformation space indeed branches into narrow trajectories as we sample compact structures, thus confirming the fundamental hypothesis of the conformation space structure.
II. RELATEDWORK
The well-known protein folding problem [4] is a search for the native structure in the conformation space of a protein; the native structure is believed to correspond to the lowest-energy structure in the space [5]. Since the entire space of protein structures is believed to be nearly impossible to enumerate, the most accurate current methods typically use energy-based minimization from a set of candidate structures obtained from homologs, or sequentially similar proteins [6]. The distribution of the energy function over the space of protein structures is hard to navigate [7], and hence the success of folding depends on finding good candidate or template structures which are close to the native state.
Most protein folding approaches consider the overall energy landscape while minimizing to a low-energy structure, and use classical optimization approaches such as Monte Carlo search [8]. Previous work on protein folding includes generic representations, particularly in lattice models [9]. However, usually only information implicit in the generic model is used to predict native structures. Our two-stage strategy intends to build upon such work to allow full energy evaluations to be used while navigating a generic space of protein structures.
Previously, graphs similar to probabilistic roadmaps [10] have been used to represent conformation space to study folding kinetics [11], [12], search for good folding trajectories [13] and compute large amplitude protein motions [14].
III. STRUCTURE OF GEOMETRIC CONFORMATION SPACE
Proteins are amino acid chains connected by peptide bonds. It is known that peptide bonds are planar and do not allow rotational freedom. The ability of a protein chain to fold into different shapes is largely conferred by the two rotatable backbone bonds of the α-carbon atom in each residue. The torsional angles of these bonds are commonly referred to as the φ and ψ angles: a protein with n residues has 2n variable torsion angles. Thus, the conformation space of a protein has 2n dimensions, and each point in the space is a particular protein structure.
A. Conformation graph
We intend to characterize the clash-free, or geometric con-formation space of the protein, which is the subset of the conformation space that consists of structures whose atoms are not in self-collision.
We do this using a set of sampled conformations in the clash-free space, and a connectivity information of the sampled conformations. This can be well-represented using a graph, whose vertices correspond to sampled conformations and edges correspond to connected conformations. Proteins are very compact structures, and since we would like to use the conformation space to explore aspects of protein structure, we direct the edges of the graph based on compactness.
The graph consists of the set of sampled conformations Ci. A directed edge Cx → Cy indicates that a collision free
straight-line path exists between Cx and Cy and that Cy is
more compact than Cx. This results in a directed acyclic graph.
The leaves of the graph represent the most compact confor-mations, therefore the graph encodes folding paths from less compact to more compact conformations. Since connectivity encodes straight line paths, the lack of an edge between two conformations indicates the presence of an obstacle, i.e. self-colliding conformations (see Fig. 1(a)).
B. Folds and bifurcations
Consider two protein conformations C1and C2that are of a
similar compactness. Intuitively, the likelihood that a straight-line collision-free path exists between C1 and C2 is higher
if the conformations are less compact, and two extremely compact conformations are unlikely to be able to easily switch in a straightforward manner.
We hypothesize that the geometric conformation space branches into small regions (or folds) as we sample increas-ingly compact structures. Each fold is disconnected from other regions of compact structures by “obstacles”, or self-colliding conformations, which means that to move from one region of compact structures to another, a protein must first “unfold”, or become less compact. From a graphical point of view, this means that a path between conformations in different folds involves an unfolding move to a common ancestor, and then folding moves to the other fold. The common ancestor is a node that splits the space into two or more folds, and we refer to such nodes as bifurcations.
Folds represent a number of similar conformations, and hence they can form a higher level representation of compact structures of the protein chain. They may be represented as a bifurcation graph, with nodes as bifurcations with edges representing connectivity from one fold to another. As with the conformation graph, edge directions indicate the relative compactness of the conformations in the fold (see Fig. 1(b)). We are then interested in extracting the bifurcation graph from the conformation graph. We can do this by detecting bifurcations from the conformation graph. Bifurcation points are detected by examining the reachability sets of nodes and their children (see Section IV).
C. Applications
An obvious application of the bifurcation graph is searching for the native state of a protein. The folding graph represents the geometric space of clash-free structures. We start from the root (denatured) conformation and recursively move to the child node that gives us the maximum decrease in objective energy of the protein. It is possible to move along a single trajectory, or multiple “reasonable” trajectories which keep the energy low. This will result in one or more compact folds being reached at the leaves, from where we can use finer-grained energy minimization to search for the native structure.
Another application is the examination of the relationship between different proteins. Since a single bifurcation graph can represent any similarly sized protein, we can examine the relationship between two proteins by identifying the folds that best match their native structures. One metric of distance is the number of unfolding moves a structure must make in order to be able to find a folding path into an alternative structure.
(a) (b)
Fig. 1. (a) A representational view geometric conformation space of a protein chain. Conformations toward the center are open and get more compact toward the circumference. The native state of the protein is shown as a green dot. Opaque, black areas represent obstacles, or areas where the protein chain is in self-collision. (b) Shaded areas are strongly connected conformations or folds. A bifurcation, as indicated, is a node or region where the conformation space splits into distinct folds.
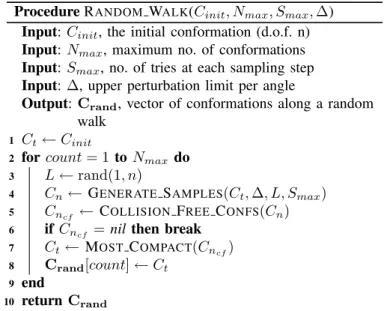
Procedure RANDOM WALK(Cinit, Nmax, Smax, ∆)
Input: Cinit, the initial conformation (d.o.f. n)
Input: Nmax, maximum no. of conformations
Input: Smax, no. of tries at each sampling step
Input: ∆, upper perturbation limit per angle
Output: Crand, vector of conformations along a random
walk Ct← Cinit 1
for count = 1 to Nmax do 2
L ← rand(1, n)
3
Cn← GENERATE SAMPLES(Ct, ∆, L, Smax) 4
Cncf ← COLLISION FREE CONFS(Cn)
5
if Cncf = nil then break
6 Ct← MOST COMPACT(Cncf) 7 Crand[count] ← Ct 8 end 9 return Crand 10
IV. BIFURCATION GRAPH
A. Sampling
To construct the conformation graph, we use biased random walks, starting from an open conformation. Each random walk consists of sampling nearby conformations and accepting those that are collision free, and bias the choice toward compact samples. Procedure RANDOM WALK illustrates the method. We perform several random walks to obtain a representative sample of the space.
B. Connectivity and bifurcations
Once samples have been generated, we connect the graph by checking for collision-free straight-line paths between conformations. To avoid the O(n2) cost of connecting all pairs,
we can check paths between neighbouring conformations only using a nearest neighbour approach. The edge directions corre-spond to the relative compactness between two conformations. Once we have a connected graph, we need to locate the bifurcation points. The main characteristic of bifurcation
Fig. 2. A bifurcation node
points is that they split the conformation space into folds, i.e. regions that are not directly connected to each other. Define the reachability of a node X to be the set of leaves LX
that can be reached by travelling from the node X toward increasingly compact conformations. A bifurcation point, then, is a node that has two children X1 and X2 with non-intersecting reachability sets LX1and LX2 (see Fig. 2).
Since our sampling may be denser than necessary, it is possible to have a parent of a bifurcation X, Y that is also a parent of X1 and X2 in which case it, too becomes a bifurcation point. However, no extra information is gained by this since the same folds are identified in both cases. To avoid this, we discard redundant edges (from the perspective of reachability) from our conformation graph. For example, if we have X → Y → Z and X → Z, the latter edge can be discarded without any loss of the reachability set LX. This
means that the nodes identified as bifurcations are close to the new folds, a property that can be useful to identify distinct folds.
V. RESULTS
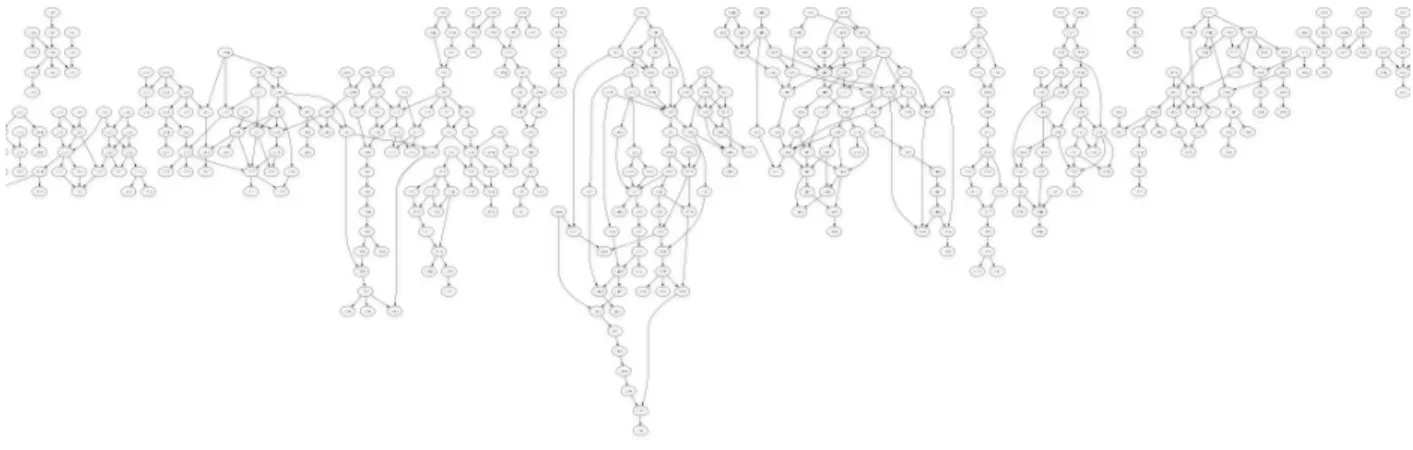
(a) (b)
Fig. 4. The conformation space graph near a protein’s native structure
Preliminary results support our hypothesis of the structure of the geometric conformation space of a protein chain.
First, we started from a completely open protein confor-mation (corresponding to a long chain) and performed five random walks of 10,000 steps each to sample the space. We used a “synthetic” protein for this experiment, which had 32 residues with the standard bond lengths and angles. We then connected the conformation graph and discarded redundant edges as described in the previous section. We obtained a deep graph that was linear near the initial conformation (see Fig. 3(a)), and tended to have a significant number of branches as the conformations became more compact (see Fig. 3(b)).
Since we have discarded redundant edges, any branch in this reduced graph indicates that the children are not connected to each other and may have different reachability sets, and each branching node is therefore, potentially a bifurcation.
This result supports the hypothesis that as we sample compact conformations, the conformation space tends to bi-furcate and divide itself into differing folds. However, the most compact structures of the conformations obtained using this experiment were not as compact as protein structures usually are. To investigate the nature of the conformation space, we sampled conformations near the native structure of a small protein (PDB: 1WHZ). This was done by unfolding the structure of 1WHZ for a small number of steps and using the conformation obtained as the starting conformation for the random walk sampling.
The resultant graph was very wide and heavily branched. A portion of it is shown in Fig. 4. This lends further support to our hypothesis. Since we are starting from an already compact structure, the conformation graph is not very deep. However, highly compact structures can easily branch out into distinct folds which are not directly connected. An analogy of knotting can be drawn here - because of the compact structures of most knots, one has to untie (unfold) a particular knot before tying a string into another type of knot.
VI. DISCUSSION
The central idea of our method is to compactly represent the conformation space of proteins. Until now, the primary roadblocks to such an approach were the immensity and
high dimensionality of the space, and the expensive energy computations involved in mapping it.
Our new approach addresses these issues by characterizing the clash-free conformation space, which discards protein-specific energy information. We also exploit the fact that the folding process involves increasingly compact structures, and concentrate on characterizing the compact structures in the space. To further reduce the representation of the space, we group similar structures into a single fold, and identify these folds using bifurcations.
By focusing on compactness and connectivity, our method produces not only a compact representation of samples in the conformation space, but also a compact representation of a large number of folding trajectories or pathways for any protein of a given size.
Our future work will concentrate on ensuring adequate coverage of the clash-free conformation space using better sampling techniques. In addition, biasing the sampling using common torsional angles could be an interesting experiment. As we have shown, the number of bifurcations, and hence our representation grows larger as we sampling more and more compact conformations. It will be useful to investigate what is the optimal compactness at which we need to stop sampling in order to get useful structures while keeping the folding graph compact.
Our approach is different from traditional approaches be-cause it constructs a generic representation of the conformation space which applies to all proteins of a given size. One possible application is the protein structure prediction by exploring the space using protein energy functions to steer the folding trajectory of a particular protein toward its native structure.
Until now, evolutionary relationships between proteins have been based on sequence identity or basic structural parameters such as RMSD and so on. Since our representation of confor-mation space independent of protein sequence, it may be a useful tool to compare different protein structures. Observing the relative positions of two proteins in a folding graph that encodes folding pathways can potentially offer insights into structural relationships.
REFERENCES
[1] A. Fiser and A. Sali, “Comparative protein structure modeling,” in Protein Structure: Determination, Analysis, and Applications for Drug Discovery, D. I. Chasman, Ed. Marcel Dekker, 2003, ch. 7, pp. 167– 206.
[2] D. J. Osguthorpe, “Novel fold and ab initio methods for protein structure generation,” in Protein Structure: Determination, Analysis, and Applications for Drug Discovery, D. I. Chasman, Ed. Marcel Dekker, 2003, ch. 9, pp. 251–276.
[3] H. M. Berman, J. Westbrook, Z. Feng, G. Gilliland, T. N. Bhat, H. Weissig, I. N. Shindyalov, and P. E. Bourne, “The protein data bank.” Nucleic Acids Res, vol. 28, no. 1, pp. 235–242, January 2000. [4] M. Levitt and A. Warshel, “Computer simulation of protein folding.”
Nature, vol. 253, no. 5494, pp. 694–698, February 1975.
[5] C. M. Dobson and M. Kaplaus, “The fundamentals of protein folding: bringing together theory and experiment,” Current Opinion in Structural Biology, vol. 9, no. 1, pp. 92–101, 1999.
[6] J. Moult, “A decade of casp: progress, bottlenecks and prognosis in protein structure prediction.” Curr Opin Struct Biol, vol. 15, no. 3, pp. 285–289, June 2005.
[7] M. A. Miller and D. J. Wales, “Energy landscape of a model protein,” Journal of Chemical Physics, vol. 111, no. 14, pp. 6610–6616, 1999. [8] C. A. Rohl, C. E. Strauss, K. M. Misura, and D. Baker, “Protein structure
prediction using rosetta.” Methods Enzymol, vol. 383, pp. 66–93, 2004. [9] D. A. Hinds and M. Levitt, “Exploring conformational space with a simple lattice model for protein structure.” J Mol Biol, vol. 243, no. 4, pp. 668–682, November 1994.
[10] L. E. Kavraki, P. Svestka, J. C. Latombe, and M. H. Overmars, “Prob-abilistic roadmaps for path planning in high-dimensional configuration spaces,” Robotics and Automation, IEEE Transactions on, vol. 12, no. 4, pp. 566–580, 1996.
[11] N. M. Amato, K. A. Dill, and G. Song, “Using motion planning to map protein folding landscapes and analyze folding kinetics of known native structures.” J Comput Biol, vol. 10, no. 3-4, pp. 239–255, 2003. [12] M. S. Apaydin, D. L. Brutlag, C. Guestrin, D. Hsu, J. C. Latombe, and
C. Varma, “Stochastic roadmap simulation: an efficient representation and algorithm for analyzing molecular motion.” J Comput Biol, vol. 10, no. 3-4, pp. 257–281, 2003.
[13] N. Singhal, C. D. Snow, and V. S. Pande, “Using path sampling to build better markovian state models: predicting the folding rate and mechanism of a tryptophan zipper beta hairpin.” J Chem Phys, vol. 121, no. 1, pp. 415–425, July 2004.
[14] J. Corts, T. Simon, R. V. de Angulo, D. Guieysse, M. Remaud-Simon, and V. Tran, “A path planning approach for computing large-amplitude motions of flexible molecules.” Bioinformatics, vol. 21, no. Suppl 1, pp. i116–i125, June 2005.