HAL Id: inserm-00681614
https://www.hal.inserm.fr/inserm-00681614
Submitted on 22 Mar 2012
HAL is a multi-disciplinary open access
archive for the deposit and dissemination of
sci-entific research documents, whether they are
pub-lished or not. The documents may come from
teaching and research institutions in France or
abroad, or from public or private research centers.
L’archive ouverte pluridisciplinaire HAL, est
destinée au dépôt et à la diffusion de documents
scientifiques de niveau recherche, publiés ou non,
émanant des établissements d’enseignement et de
recherche français ou étrangers, des laboratoires
publics ou privés.
BRCA1 and/or BRCA2 mutation carriers.
Antonis Antoniou, Karoline Kuchenbaecker, Penny Soucy, Jonathan Beesley,
Xiaoqing Chen, Lesley Mcguffog, Andrew Lee, Daniel Barrowdale, Sue Healey,
Olga Sinilnikova, et al.
To cite this version:
Antonis Antoniou, Karoline Kuchenbaecker, Penny Soucy, Jonathan Beesley, Xiaoqing Chen, et al..
Common variants at 12p11, 12q24, 9p21, 9q31.2 and in ZNF365 are associated with breast cancer risk
for BRCA1 and/or BRCA2 mutation carriers.. Breast Cancer Research, BioMed Central, 2012, 14
(1), pp.R33. �10.1186/bcr3121�. �inserm-00681614�
R E S E A R C H A R T I C L E
Open Access
Common variants at 12p11, 12q24, 9p21, 9q31.2
and in ZNF365 are associated with breast cancer
risk for BRCA1 and/or BRCA2 mutation carriers
Antonis C Antoniou
1*, Karoline B Kuchenbaecker
1, Penny Soucy
2, Jonathan Beesley
3, Xiaoqing Chen
3,
Lesley McGuffog
1, Andrew Lee
1, Daniel Barrowdale
1, Sue Healey
3, Olga M Sinilnikova
4, Maria A Caligo
5,
Niklas Loman
6, Katja Harbst
6, Annika Lindblom
7, Brita Arver
8, Richard Rosenquist
9, Per Karlsson
10, Kate Nathanson
11, Susan Domchek
11and Tim Rebbeck
11Abstract
Introduction:
Several common alleles have been shown to be associated with breast and/or ovarian cancer risk
for BRCA1 and BRCA2 mutation carriers. Recent genome-wide association studies of breast cancer have identified
eight additional breast cancer susceptibility loci: rs1011970 (9p21, CDKN2A/B), rs10995190 (ZNF365), rs704010
(ZMIZ1), rs2380205 (10p15), rs614367 (11q13), rs1292011 (12q24), rs10771399 (12p11 near PTHLH) and rs865686
(9q31.2).
Methods:
To evaluate whether these single nucleotide polymorphisms (SNPs) are associated with breast cancer
risk for BRCA1 and BRCA2 carriers, we genotyped these SNPs in 12,599 BRCA1 and 7,132 BRCA2 mutation carriers
and analysed the associations with breast cancer risk within a retrospective likelihood framework.
Results:
Only SNP rs10771399 near PTHLH was associated with breast cancer risk for BRCA1 mutation carriers (per-allele
hazard ratio (HR) = 0.87, 95% CI: 0.81 to 0.94, P-trend = 3 × 10
-4). The association was restricted to mutations proven or
predicted to lead to absence of protein expression (HR = 0.82, 95% CI: 0.74 to 0.90, P-trend = 3.1 × 10
-5, P-difference =
0.03). Four SNPs were associated with the risk of breast cancer for BRCA2 mutation carriers: rs10995190, P-trend = 0.015;
rs1011970, P-trend = 0.048; rs865686, 2df-P = 0.007; rs1292011 2df-P = 0.03. rs10771399 (PTHLH) was predominantly
associated with estrogen receptor (ER)-negative breast cancer for BRCA1 mutation carriers (HR = 0.81, 95% CI: 0.74 to
0.90, P-trend = 4 × 10
-5) and there was marginal evidence of association with ER-negative breast cancer for BRCA2
mutation carriers (HR = 0.78, 95% CI: 0.62 to 1.00, P-trend = 0.049).
Conclusions:
The present findings, in combination with previously identified modifiers of risk, will ultimately lead
to more accurate risk prediction and an improved understanding of the disease etiology in BRCA1 and BRCA2
mutation carriers.
Introduction
Pathogenic mutations in BRCA1 and BRCA2 confer high
risks of breast and ovarian cancers [1,2]. Several lines of
evidence suggest that these risks are modified by other
genetic or environmental factors that cluster in families.
Direct evidence for genetic modifiers of risk has been
provided through studies that investigated the
associa-tions between common breast and ovarian cancer
sus-ceptibility variants, identified through genome-wide
association studies (GWAS) or candidate gene studies in
the general population, and cancer risk for BRCA1 and
BRCA2
mutation carriers [3-8] and through GWAS in
BRCA1
and BRCA2 mutation carriers [9-11]. Six loci (at
TOX3
, 2q35, 6q25.1, 19p13, CASP8 and wild-type copy
of BRCA1) are now known to be associated with breast
cancer risk for BRCA1 mutation carriers; a further 10
loci (at FGFR2, TOX3, MAP3K1, LSP1, 2q35, SLC4A7,
* Correspondence: antonis@srl.cam.ac.uk
1Centre for Cancer Genetic Epidemiology, Department of Public Health and
Primary Care, University of Cambridge, Worts Causeway, Cambridge CB1 8RN, UK
Full list of author information is available at the end of the article
© 2012 Antoniou et al.; licensee BioMed Central Ltd. This is an open access article distributed under the terms of the Creative Commons Attribution License (http://creativecommons.org/licenses/by/2.0), which permits unrestricted use, distribution, and reproduction in any medium, provided the original work is properly cited.
5p12, 1p11.2, ZNF365 and RAD51) have been associated
with breast cancer risk for BRCA2 carriers. The
associa-tion patterns between these common variants and breast
cancer risk for BRCA1 and BRCA2 mutation carriers are
in general different, and mostly reflect differences in the
associations of these single-nucleotide polymorphism
(SNPs) with estrogen receptor (ER) status of breast
can-cer [12-14].
GWAS in the general population have recently
identi-fied eight additional breast cancer susceptibility loci
which have not been previously investigated in BRCA1
and BRCA2 mutation carriers. Turnbull et al. [15]
iden-tified five susceptibility loci on chromosomes 9
(rs1011970), 10 (rs2380205, rs10995190, rs704010) and
11 (rs614367) through a GWAS of breast cancer cases
with a family history of the disease and unrelated
con-trols. In a further follow-up of additional promising
associations from that GWAS, the Breast Cancer
Asso-ciation Consortium (BCAC) has identified two
addi-tional loci at 12p11 (rs10771399) and 12q24 (rs1292011)
which were associated with breast cancer risk in the
general population [16]. The estimated odds ratios (OR)
for ER-positive breast cancer for four of these SNPs
(rs1011970 near CDKN2A/CDKN2B at chromosome 9,
rs10995190 in ZNF365 at chromosome 10, rs614367 at
11q13 and rs1292011 at 12q24) were higher than the
OR estimates for ER-negative breast cancer. In contrast,
the OR estimates were similar for positive and
ER-negative breast cancer for SNPs rs2380205 (near
ANKRD16
and FBXO18), rs704010 (upstream of
ZMIZ1) and rs10771399 near PTHLH. In a separate
GWAS that included mainly cases with two primary
breast cancers or a family history of the disease, SNP
rs865686 at 9q31.2 was found to be associated with risk
for breast cancer, OR = 0.89 (95% CI: 0.85 to 0.92), but
no estimates by ER status were reported [17].
The associations of these eight loci with breast cancer
risk for BRCA1 and BRCA2 mutation carriers are still
unknown. To evaluate these associations, we genotyped
the eight SNPs in BRCA1 and BRCA2 mutation carriers
participating in the Consortium of Investigators of
Modifiers of BRCA1/2 (CIMBA). We further
investi-gated the associations with the risks of developing
ER-positive and ER-negative breast cancer and the risk of
ovarian cancer.
Materials and methods
Subjects
All carriers participated in clinical or research studies at
the host institutions which have been approved by local
ethics committees (list provided in Additional file 1
Table S1). Informed consent was obtained from all
study participants. Subjects were BRCA1 and BRCA2
mutation carriers recruited by 40 study centres in 28
countries through CIMBA (Additional file 1 Table 2).
The majority of carriers (97.58%) were recruited through
cancer genetics clinics offering genetic testing, and
enrolled into national or regional studies. Some carriers
were identified by population-based sampling of cases
(2.38%), and some by community recruitment (0.04%).
Eligibility to participate in CIMBA is restricted to female
carriers of pathogenic BRCA1 or BRCA2 mutations age
18 years old or older at recruitment. Information
col-lected included the year of birth; mutation description,
including nucleotide position and base change; self
reported ethnic ancestry, age at last follow-up; ages at
breast or ovarian cancer diagnoses; and age or date at
bilateral prophylactic mastectomy and oophorectomy.
Related individuals were identified through a unique
family identifier. Women were included in the analysis if
they carried mutations that were pathogenic according
to generally recognized criteria [18]. Further details on
CIMBA can be found elsewhere [19].
Women who carried pathogenic mutations in both
BRCA1
and BRCA2 were excluded from the current
analysis. The primary analysis was restricted to women
self-reported as “white of European ancestry”. The
num-ber of mutation carriers of non-white ancestry was too
small to allow separate analysis. We investigated
possi-ble overlap of carriers between studies by comparing the
year of birth, exact mutation description and the
reported ages, to identify potential duplicate individuals.
Where possible we also used other genotype data on
SNPs genotyped in the current round (at least 26 SNPs),
in previous genotyping rounds or as part of GWAS to
find hidden duplicates. When a potential duplicate was
identified, we contacted the relevant centres for further
information about these individuals, in a manner that
protected the identity of the individuals in question, in
order to determine precisely the extent of true overlap
in subjects and families appearing more than once in
the data set. Duplicate mutation carriers were included
only once in the analysis. When in doubt, and when
centres could not clarify a potential duplication, one of
the samples was excluded from the analysis.
Genotyping
DNA samples (in almost all cases, obtained from blood)
were genotyped using the iPLEX Mass Array platform at
four genotyping centres (Additional file 1 Table S2); the
iPLEX included 26 SNPs as part of a larger study. All
centres included at least 2% of the samples in duplicate,
no template controls in every plate, and a random
mix-ture of affected and unaffected carriers. Samples that
failed for ≥ 20% of all the SNPs typed (that is, five or
more) were excluded from the analysis. A study was
included in the analysis only if the call rate was over
95%, after samples that failed at multiple SNPs had been
excluded. For each study, genotypes for at least 98% of
the duplicate samples had to be concordant. To assess
the accuracy of genotyping across genotyping centres,
the four centres genotyped 95 DNA samples from a
standard test plate (Coriell Institute) for all SNPs. If the
genotyping was inconsistent for more than one sample
in the test plate, all the studies genotyped at the centre
were excluded from the analysis of that SNP. No SNPs
failed this criterion. The present study included eight
SNPs: rs1011970 (9p21, near CDKN2A/B), rs10995190
(10q21, near ZNF365), rs704010 (10q22, near ZMIZ1),
rs2380205 (10p15), rs614367 (11q13), rs1292011
(12q24), rs10771399 (12p11 near PTHLH) and rs865686
(9q31.2). Based on the quality control criteria, 4 studies
were excluded from the analysis of rs2380205 (one due
to low duplicate concordance, 3 due to low call rate), 2
studies were excluded from the analysis of rs704010
(low call rate) and 13 studies were excluded from the
analysis of rs1292011 (all due to low call rates). As an
additional genotyping quality-control check, we also
evaluated the deviation from Hardy-Weinberg
equili-brium (HWE) for unrelated subjects separately for each
SNP and study. Nine studies had HWE P-values in the
range 0.005 to 0.05 (two studies for rs10995190, two
studies for rs704010, one study for rs10771399, two for
rs1292011 and two for rs865686). Upon examination of
the cluster plots for these studies and SNPs, none
revealed any unusual patterns and these studies were
included in all the analyses. After the above exclusions,
a total of 19,731 unique mutation carriers (12,599
BRCA1
and 7,132 BRCA2) from 40 studies had an
observed genotype for at least 1 of the SNPs and were
included in the primary analysis.
Statistical analysis
The aim of the primary analysis was to evaluate the
association between each genotype and breast cancer
risk within a survival analysis framework. The time
vari-able for each individual was defined to be the time to
breast cancer diagnosis. Each individual was followed
until the first breast cancer diagnosis, ovarian cancer
diagnosis, or bilateral prophylactic mastectomy or the
age at last observation. Only those with a first breast
cancer diagnosis were considered as affected in the
ana-lysis. Mutation carriers censored at ovarian cancer
diag-nosis were considered unaffected. Analysis was
conducted by modelling the retrospective likelihood of
the observed genotypes conditional on the disease
phe-notypes as previously described [18]. The effect of each
SNP was modelled either as a per-allele hazard ratio
(HR) (multiplicative model) or as separate HRs for
het-erozygotes and homozygotes, and these were estimated
on the logarithmic scale. The HRs were assumed to be
independent of age (that is, we used a Cox
proportional-hazards model). The assumption of
pro-portional hazards was tested by adding a “genotype x
age” interaction term to the model in order to fit
mod-els in which the HR changed with age. Analyses were
carried out with the pedigree-analysis software
MEN-DEL [20]; details of this approach have been described
previously [18,21]. We examined between-study
hetero-geneity by comparing the models that allowed for
study-specific log-hazard ratios against models in which the
same log-hazard ratio was assumed to apply to all
studies.
To investigate whether our results were influenced by
any of our assumptions we performed additional
sensi-tivity analyses. If a SNP is associated with disease
survi-val, the inclusion of prevalent cases may influence the
HR estimates. Current data indicate that five-year
survi-val after a breast cancer diagnosis is over 80% (Cancer
Research - UK, Breast cancer survival statistics) and
stu-dies have suggested no difference in survival between
mutation carriers and non-carriers [22]. We, therefore,
repeated our analysis by excluding mutation carriers
diagnosed more than five years prior to recruitment into
the study. To examine whether SNP associations
dif-fered by type of mutation, we classified BRCA1
muta-tions according to their potential functional effect
[23-26]. Class 1 mutations were those likely to lead to
the absence of protein expression due to i) reduced
transcript level and/or degradation or instability of
trun-cated proteins, or ii) absence of transcription. Class 1
mutations comprise truncating mutations expected to
trigger nonsense-mediated mRNA decay (NMD) or
translation re-initiation but no production of stable
pro-tein, and deletion of transcription regulatory regions.
Class 2 mutations were those likely to generate stable
mutant proteins with partial or total loss of function
that might also have dominant negative effect. Class 2
mutations include missense substitutions, in-frame
dele-tions and inserdele-tions, as well as truncating mutadele-tions
with premature stop codons occurring in the last exon.
Mutations whose consequences at transcript or protein
level could not be inferred were not considered for this
classification. These were mainly mutations located in
splice sites but not characterised for their effect at the
transcript level, or large deletions or insertions with
undetermined boundaries.
The associations of these SNPs with ovarian cancer
risk were evaluated within a competing risk analysis
fra-mework [8,9,21], by estimating HRs simultaneously for
breast and ovarian cancers. In this model, each
indivi-dual was at risk of developing either breast or ovarian
cancer, by assuming that the probabilities of developing
each disease were independent conditional on the
underlying genotype. A different censoring process was
used for the competing risk analysis, whereby
individuals were followed up to the age of the first
breast or ovarian cancer diagnosis and were considered
to have developed the corresponding disease. No
follow-up was considered after the first cancer diagnosis.
Indi-viduals were censored for breast cancer at the age of
bilateral prophylactic mastectomy and for ovarian cancer
at the age of bilateral oophorectomy and were assumed
to be unaffected for the corresponding disease. The
remaining individuals were censored at the age at last
observation and were assumed to be unaffected for both
diseases.
We further evaluated the associations of these SNPs
with breast cancer subtypes defined by the estrogen
receptor (ER) status of the tumours in BRCA1 and
BRCA2
mutation carriers. The analysis was carried out
by an extension of the retrospective likelihood approach
to model the simultaneous effect of each SNP on more
than one tumour subtype [14]. Briefly, this involves
modelling the conditional likelihood of the observed
SNP genotypes and tumour subtypes, given the disease
phenotypes. Within this framework it is possible to
esti-mate simultaneously the HRs for each tumour subtype
and test for heterogeneity in the associations. Only
stu-dies that provided tumour pathology information and
had genotype information were included in the analysis.
To maximise the available information, genotyped
muta-tion carriers that were missing informamuta-tion on tumour
characteristics (within each study) were included in the
analysis, and their disease subtype was assumed to be
missing at random [14]. This is a reasonable assumption
given that more than 90% of mutation carriers in our
sample were recruited prior to 2007, when it was
uncommon to use tumour pathology in selecting
indivi-duals for BRCA1 and BRCA2 mutation screening.
To ensure a sufficiently large number of mutation
car-riers within each stratum, we grouped studies from the
same country. All analyses were stratified by country of
residence and used calendar-year- and cohort-specific
cancer incidences for BRCA1 and BRCA2 [27]. For
sen-sitivity analyses, strata with small numbers of mutation
carriers were grouped. We used a robust
variance-esti-mation approach to allow for the non-independence
among related carriers [28].
Results
The analysis included 12,599 BRCA1 and 7,132 BRCA2
mutation carriers who were genotyped successfully for
at least one of the eight SNPs. Table 1 summarises the
characteristics of the mutation carriers used in the
ana-lysis. In evaluating associations with breast cancer,
10,200 mutation carriers had been diagnosed with a first
breast cancer diagnosis, 1,869 were censored at an
ovar-ian cancer diagnosis, 561 at age of bilateral prophylactic
mastectomy and 7,101 at the age at last observation.
Associations with cancer risk for BRCA1 mutation carriers
Of the eight SNPs, only rs10771399 in PTHLH was
associated with breast cancer risk for BRCA1 mutation
carriers (P-trend = 3 × 10
-4, Table 2). The association
was consistent with a multiplicative model in which
each copy of the minor allele was estimated to confer a
HR of 0.87 (95% CI: 0.81 to 0.94). There was no
evi-dence of heterogeneity in the HR estimates across
stu-dies (P-het = 0.24, Additional file 1 Supplementary
Figure 1). There was no evidence that the HRs varied
with age (P = 0.68). The association remained
signifi-cant, with a similar HR estimate (HR = 0.85, 95% CI:
0.77 to 0.93, P-trend = 6 × 10
-4, Table 3), when
long-term survivors were excluded from the analysis,
suggest-ing no evidence of survival bias. Interestsuggest-ingly, the
asso-ciation was restricted to BRCA1 carriers of Class 1
mutations (HR = 0.82, 95% CI: 0.74 to 0.90, P-trend = 3
× 10
-5, Table 3) with no evidence of association for
Class 2 mutation carriers (HR = 1.00, 0.87 to 1.15,
P-trend = 0.99, P-difference between Class 1 and Class 2
= 0.03).
We found no evidence of association between breast
cancer risk for BRCA1 mutation carriers and any of the
other SNPs under the trend models (P-trend > 0.15).
There was, however, some suggestion of an association
under the genotype specific model for rs865686 (2df P =
0.06, Table 2), reflecting a lower HR for heterozygous
carriers than for either homozygote genotype. There was
marginal evidence of heterogeneity in the HRs across
countries for rs704010 and rs865686 (P-het = 0.04 for
both), but examination of the forest plots revealed that
in each case this was mainly due to a single
study/coun-try of relatively small sample size, with the majority of
the HR estimates being close to 1 (Additional file 1
Sup-plementary Figure 1). There was no evidence that the
HRs varied by age for any of the SNPs (P > 0.08 for all).
We further evaluated the SNP associations with breast
and ovarian cancer risk simultaneously (Table 4). The
associations with breast cancer risk remained essentially
unchanged in the competing risk analysis, with only the
PTHLH
SNP rs10771399 being significantly associated
with breast cancer risk. There was some suggestion of a
possible association between this SNP and ovarian
can-cer risk for BRCA1 mutation carriers with risk in the
opposite direction (HR for ovarian cancer = 1.14, 95%
CI: 1.00 to 1.30, P-trend = 0.06) especially among rare
homozygotes (ovarian cancer HR for GG = 1.67, 95%
CI: 1.05 to 2.64, P-homozygotes = 0.03). This analysis
also provided some weak evidence for an association
between SNP rs614367 at 11q13 and ovarian cancer risk
for BRCA1 mutation carriers under the
genotype-speci-fic model (2df P-value = 0.03). There was no evidence
that any of the other SNPs are associated with ovarian
cancer risk for BRCA1 mutation carriers.
Associations with cancer risk for BRCA2 mutation carriers
There was evidence of association with breast cancer
risk for BRCA2 mutation carriers for four SNPs (Table
2). The minor allele of rs10995190 in ZNF365 was
asso-ciated with a reduced risk of breast cancer, where each
copy of allele “A” was estimated to confer a HR of 0.90
(95% CI: 0.82 to 0.98, P-trend = 0.015). There was also
some marginal evidence that the minor allele of
rs1011970 near CDKN2A/CDKN2B was associated with
increased breast cancer risk (HR = 1.09, 95% CI: 1.00 to
1.18, P-trend = 0.048). None of the other
polymorph-isms was associated with breast cancer risk for BRCA2
mutation carriers under the multiplicative model.
How-ever, SNPs rs865686 and rs1292011 were associated
with risk under the genotype specific model (2df-P =
0.007 and 0.03 respectively, Table 2). There was some
evidence of heterogeneity in the HRs across countries
for rs1011970 (P-het = 0.005). This appeared to be
mainly due to the USA stratum. The heterogeneity was
no longer significant after removal of that stratum
(P-het = 0.42) and the HR estimate for the association with
breast cancer risk increased to 1.20 (95% CI: 1.09 to
1.32, P-trend = 1 × 10
-4). There was no heterogeneity
for any of the other SNPs (P-het > 0.12 for all,
Additional file 1 Supplementary Figure 2). The HR
esti-mates for the four associated SNPs were similar when
long-term survivors were excluded from the analysis
(Table 3). Consistent with the results of the main
analy-sis, rs10995190 in ZNF365 and rs1011970 near
CDKN2A/CDKN2B
provided marginal evidence of
asso-ciation using the trend-test statistic (P-trend = 0.05 for
both) and SNPs rs865686 was associated with breast
cancer risk under the genotype specific model (2df-P =
0.03). SNP rs1292011 was not associated with breast
cancer risk in this analysis. A somewhat smaller HR
estimate was obtained for the PTHLH SNP rs10771399
compared to the main analysis (per-allele HR = 0.89,
95% CI: 0.78 to 1.00, P-trend = 0.06). The attenuation
of the association in the overall analysis could have
occurred if the SNP is also associated with prognosis.
However, the difference in the HRs was small. The
results for the remaining SNPs were similar and
non-significant. None of SNPs were associated with ovarian
cancer risk for BRCA2 mutation carriers (Table 4).
Associations by tumour ER-status
Table 5 summarises the associations of the eight SNPs
with breast cancer ER status in BRCA1 and BRCA2
Table 1 Summary characteristics for the 19731 eligible BRCA1 and BRCA2 carriers* used in the analysis
Characteristic BRCA1 BRCA2
Unaffected Breast cancer Unaffected Breast cancer
Number 6,209 6,390 3,322 3,810
Person-years follow-up 264,903 263,068 147,053 168,201 Median age at censure (IQR1) 42 (34 to 50) 40 (34 to 47) 43 (34 to 53) 43 (37 to 50)
Age at censure, N (%) < 30 1,189 (19.2) 691 (10.8) 611 (18.4) 306 (8.0) 30 to 39 1,161 (26.8) 2,445 (38.3) 834 (25.1) 1,141 (30.0) 40 to 49 1,765 (28.4) 2,191 (34.3) 865 (26.0) 1,394 (36.6) 50 to 59 1,058 (17.0) 812 (12.7) 566 (17.0) 687 (18.0) 60 to 69 380 (6.1) 198 (3.1) 302 (9.1) 226 (5.9) 70+ 156 (2.5) 53 (0.8) 144 (4.3) 56 (1.5) Year of birth, N (%) < 1920 28 (0.5) 30 (0.5) 23 (0.7) 44 (1.2) 1920 to 1929 131 (2.1) 196 (3.1) 99 (3.0) 167 (4.4) 1930 to 1939 369 (5.9) 516 (8.1) 232 (7.0) 430 (11.3) 1940 to 1949 832 (13.4) 1,341 (21.0) 458 (13.8) 896 (23.5) 1950 to 1959 1,409 (22.7) 1,989 (31.1) 691 (20.8) 1,160 (30.5) 1960 to 1969 1,703 (27.4) 1,666 (26.1) 902 (27.2) 868 (22.8) 1970+ 1,737 (28.0) 652 (10.2) 917 (27.6) 245 (6.4) Mutation Class, N (%) Class 12 4,063 (65.4) 3,878 (60.7) 3,114 (93.7) 3,520 (92.4) Class 22 1,780 (28.7) 1,973 (30.9) 72 (2.2) 100 (2.6) Other 366 (5.9) 539 (8.4) 136 (4.1) 190 (5.0)
1IQR: Interquartile Range 2See methods for definitions
Table 2 SNP genotype distributions and associations with breast cancer risk.
Mutation Genotype Unaffected N (%) Affecteda N (%) HR 95% CI P-value CDK2NA/B - rs1011970 BRCA1 GG 4,318 (69.7) 4,460 (70.0) 1 GT 1,698 (27.4) 1,719 (27.0) 1.01 0.94 to 1.09 TT 180 (2.9) 195 (3.1) 1.11 0.91 to 1.35 2-df test 0.61 per allele 1.03 0.96 to 1.09 0.45 BRCA2 GG 2,279 (68.7) 2,586 (67.9) 1 GT 943 (28.4) 1,098 (28.9) 1.08 0.98 to 1.19 TT 94 (2.8) 123 (3.2) 1.23 0.95 to 1.59 2-df test 0.12 per allele 1.09 1.00 to 1.18 0.048 ZNF365 - rs10995190 BRCA1 GG 4,394 (70.9) 4,556 (71.5) 1 GA 1,656 (26.7) 1,662 (26.1) 0.98 0.91 to 1.06 AA 147 (2.4) 156 (2.5) 0.98 0.79 to 1.20 2-df test 0.89 per allele 0.99 0.93 to 1.05 0.64 BRCA2 GG 2,334 (70.4) 2,802 (73.7) 1 GA 913 (27.5) 923 (24.3) 0.86 0.78 to 0.96 AA 68 (20.1) 79 (2.1) 0.96 0.69 to 1.34 2-df test 0.019 per allele 0.90 0.82 to 0.98 0.015 ZMIZ1 - rs704010 BRCA1 CC 2,476 (40.3) 2,504 (39.8) 1 CT 2,814 (45.8) 2,894 (46.0) 1.03 0.96 to 1.10 TT 855 (13.9) 888 (14.1) 1.04 0.93 to 1.15 2-df test 0.69 per allele 1.02 0.97 to 1.07 0.42 BRCA2 CC 1,286 (39.3) 1,443 (38.4) 1 CT 1,496 (45.7) 1,779 (47.3) 1.07 0.97 to 1.18 TT 494 (15.8) 539 (14.3) 0.99 0.86 to 1.14 2-df test 0.32 per allele 1.01 0.95 to 1.08 0.73 10p15 - rs2380205 BRCA1 CC 1,609 (32.5) 1,710 (32.1) 1 CT 2,410 (48.7) 2,625 (49.3) 1.01 0.93 to 1.09 TT 933 (18.8) 990 (18.6) 1.02 0.92 to 1.13 2-df test 0.95 per allele 1.01 0.96 to 1.06 0.75 BRCA2 CC 1,013 (32.8) 1,163 (31.8) 1 CT 1,516 (49.1) 1,816 (49.7) 1.05 0.95 to 1.16 TT 560 (18.1) 681 (18.6) 1.03 0.90 to 1.17 2-df test 0.63 per allele 1.02 0.96 to 1.09 0.57 11q13 - rs614367 BRCA1 CC 4,516 (73.2) 4,581 (72.1) 1 CT 1,511 (24.5) 1,618 (25.5) 1.05 0.98 to 1.14 TT 146 (2.4) 154 (2.4) 1.07 0.87 to 1.32 2-df test 0.34 per allele 1.05 0.98 to 1.12 0.15 BRCA2 CC 2,432 (73.6) 2,723 (71.8) 1
mutation carriers. Only the PTHLH SNP rs10771399 was
associated with ER-negative breast cancer for BRCA1
mutation carriers (ER-negative HR = 0.81, 95% CI: 0.74
to 0.90, P-trend = 3.8 × 10
-5). There was also marginal
evidence that SNP rs704010 near ZMIZ1 was associated
with ER-positive breast cancer for BRCA1 mutation
car-riers (ER-positive HR = 1.12, 95% CI: 1.00 to 1.26,
P-trend = 0.046). However, the associations between
ER-negative and ER-positive breast cancer among BRCA1
mutation carriers were only significantly different for
SNP rs1292011 at 12q24 (P-heterogeneity = 0.045).
Despite the small number of BRCA2 ER-negative
breast cancers, there was a suggestion that the minor
allele of the PTHLH SNP rs10771399 is protective for
ER-negative breast cancer for BRCA2 mutation carriers
(HR for ER-negative = 0.78, 95% CI: 0.62 to 1.00,
P-trend = 0.049), but there was no association with
ER-positive breast cancer. There was evidence that SNPs
rs10995190 near ZNF365, rs865686 at 9q31.2 and
rs1011970 near CDKN2A/B are associated with
ER-posi-tive breast cancer for BRCA2 mutation carriers (P-trend
= 0.043, 0.028 and 0.05 respectively). However, the HR
Table 2 SNP genotype distributions and associations with breast cancer risk. (Continued)
CT 799 (24.1) 983 (26.0) 1.06 0.96 to 1.17 TT 76 (2.3) 83 (2.2) 0.97 0.72 to 1.30 2-df test 0.54 per allele 1.03 0.95 to 1.12 0.46 12q24 - rs1292011 BRCA1 AA 1,292 (34.3) 1,331 (35.4) 1 AG 1,825 (48.4) 1,775 (47.3) 0.98 0.89 to 1.07 GG 653 (17.3) 649 (17.3) 1.01 0.90 to 1.14 2-df test 0.80 per allele 1.00 0.94 to 1.06 0.99 BRCA2 AA 824 (35.2) 908 (35.9) 1 AG 1,095 (46.7) 1,225 (48.4) 1.03 0.92 to 1.16 GG 423 (18.1) 397 (15.7) 0.84 0.72 to 0.99 2-df test 0.03 per allele 0.94 0.87 to 1.01 0.10 PTHLH - rs10771399 BRCA1 AA 4,913 (79.4) 5,221 (82.0) 1 AG 1,194 (19.3) 1,082 (17.0) 0.87 0.80 to 0.95 GG 83 (1.3) 65 (1.0) 0.77 0.57 to 1.04 2-df test 1.5 × 10⁻³ per allele 0.87 0.81 to 0.94 3.2 × 10⁻⁴ BRCA2 AA 2,649 (80.0) 3,085 (81.2) 1 AG 620 (18.7) 679 (17.9) 0.95 0.85 to 1.07 GG 45 (1.4) 34 (0.9) 0.74 0.47 to 1.15 2-df test 0.31 per allele 0.93 0.84 to 1.04 0.20 9q31.2 - rs865686 BRCA1 TT 2,521 (40.1) 2,640 (41.4) 1 TG 2,872 (46.4) 2,849 (44.7) 0.95 0.88 to 1.01 GG 799 (12.9) 880 (13.8) 1.05 0.95 to 1.17 2-df test 0.06 per allele 1 0.96 to 1.05 0.85 BRCA2 TT 1,277 (38.6) 1,581 (41.6) 1 TG 1,610 (48.6) 1,717 (45.2) 0.86 0.78 to 0.95 GG 425 (12.8) 501 (13.2) 0.96 0.84 to 1.11 2-df test 7.3 × 10⁻³ per allele 0.95 0.89 to 1.01 0.10 aBreast Cancer HR, hazard ratio
Table 3 Associations with breast cancer risk, after excluding prevalent breast cancer cases, and BRCA1 mutation class.
Unaffected, N Affected, N HR 95% CI P-value Excluding prevalent breast cancer cases
CDK2NA/B -rs1011970 BRCA1 6,200 3,152 1.05 0.98 to 1.14 0.18 BRCA2 3,319 1,950 1.10 1.00 to 1.22 0.05 ZNF365 - rs10995190 BRCA1 6,201 3,151 0.96 0.89 to 1.04 0.34 BRCA2 3,318 1,949 0.90 0.81 to 1.00 0.05 ZMIZ1 - rs704010 BRCA1 6,149 3,094 1.02 0.96 to 1.08 0.53 BRCA2 3,276 1,919 0.98 0.91 to 1.06 0.64 10p15 - rs2380205 BRCA1 4,955 2,764 1.02 0.95 to 1.08 0.64 BRCA2 3,092 1,884 1.00 0.93 to 1.08 0.92 11q13 - rs614367 BRCA1 6,177 3,144 1.01 0.94 to 1.10 0.73 BRCA2 3,310 1,944 0.99 0.89 to 1.10 0.88 12q24 - rs1292011 BRCA1 3,773 1,798 1.04 0.97 to 1.12 0.29 BRCA2 2,345 1,220 0.96 0.88 to 1.06 0.41 PTHLH - rs10771399 BRCA1 6,194 3,152 0.85 0.77 to 0.93 5.8 × 10⁻⁴ BRCA2 3,317 1,944 0.89 0.78 to 1.00 0.06 9q31.2 - rs865686 BRCA1 6,196 3,149 1.01 0.95 to 1.07 0.72 BRCA2 3,315 1,946 0.94 0.87 to 1.02 0.15
BRCA1analysis by mutation class CDK2NA/B -rs1011970 Class1 4,040 3,843 1.01 0.94 to 1.10 0.72 Class2 1,771 1,958 1.03 0.91 to 1.16 0.66 ZNF365 - rs10995190 Class1 4,058 3,844 .99 0.92 to 1.07 0.80 Class2 1,774 1,957 0.97 0.86 to 1.09 0.59 ZMIZ1 - rs704010 Class1 3,998 3,787 1.04 0.98 to 1.10 0.22 Class2 1,767 1,936 1.01 0.92 to 1.11 0.85 10p15 - rs2380205 Class1 3,664 3,538 1.01 0.95 to 1.07 0.82 Class2 931 1,263 1.03 0.91 to 1.15 0.67 11q13 - rs614367 Class1 4,024 3,833 1.10 1.02 to 1.19 0.02 Class2 1,764 1,948 0.94 0.84 to 1.06 0.32 12q24 - rs1292011 Class1 2,812 2,521 0.99 0.92 to 1.06 0.71 Class2 642 797 0.97 0.84 to 1.12 0.68 PTHLH - rs10771399 Class1 4,035 3,841 0.82 0.74 to 0.90 3.1 × 10⁻⁵ Class2 1,770 1,953 1.00 0.87 to 1.15 0.99 9q31.2 - rs865686 Class1 4,038 3,840 0.98 0.92 to 1.04 0.48 Class2 1,769 1,957 1.03 0.94 to 1.14 0.49 HR, hazard ratio
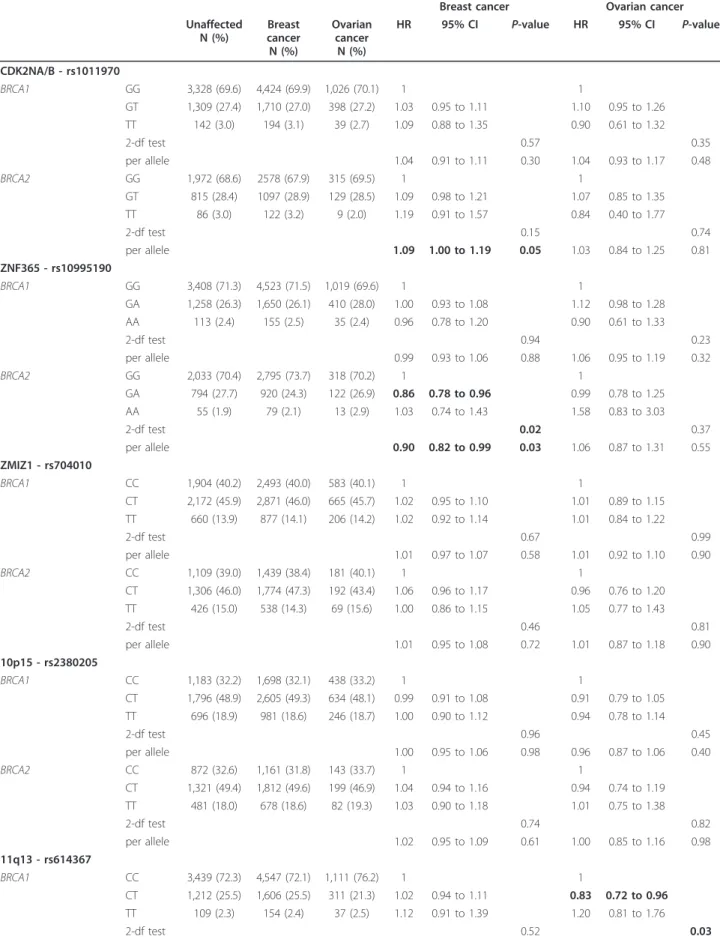
Table 4 Competing risk analysis*.
Breast cancer Ovarian cancer Unaffected N (%) Breast cancer N (%) Ovarian cancer N (%) HR 95% CI P-value HR 95% CI P-value CDK2NA/B - rs1011970 BRCA1 GG 3,328 (69.6) 4,424 (69.9) 1,026 (70.1) 1 1 GT 1,309 (27.4) 1,710 (27.0) 398 (27.2) 1.03 0.95 to 1.11 1.10 0.95 to 1.26 TT 142 (3.0) 194 (3.1) 39 (2.7) 1.09 0.88 to 1.35 0.90 0.61 to 1.32 2-df test 0.57 0.35 per allele 1.04 0.91 to 1.11 0.30 1.04 0.93 to 1.17 0.48 BRCA2 GG 1,972 (68.6) 2578 (67.9) 315 (69.5) 1 1 GT 815 (28.4) 1097 (28.9) 129 (28.5) 1.09 0.98 to 1.21 1.07 0.85 to 1.35 TT 86 (3.0) 122 (3.2) 9 (2.0) 1.19 0.91 to 1.57 0.84 0.40 to 1.77 2-df test 0.15 0.74 per allele 1.09 1.00 to 1.19 0.05 1.03 0.84 to 1.25 0.81 ZNF365 - rs10995190 BRCA1 GG 3,408 (71.3) 4,523 (71.5) 1,019 (69.6) 1 1 GA 1,258 (26.3) 1,650 (26.1) 410 (28.0) 1.00 0.93 to 1.08 1.12 0.98 to 1.28 AA 113 (2.4) 155 (2.5) 35 (2.4) 0.96 0.78 to 1.20 0.90 0.61 to 1.33 2-df test 0.94 0.23 per allele 0.99 0.93 to 1.06 0.88 1.06 0.95 to 1.19 0.32 BRCA2 GG 2,033 (70.4) 2,795 (73.7) 318 (70.2) 1 1 GA 794 (27.7) 920 (24.3) 122 (26.9) 0.86 0.78 to 0.96 0.99 0.78 to 1.25 AA 55 (1.9) 79 (2.1) 13 (2.9) 1.03 0.74 to 1.43 1.58 0.83 to 3.03 2-df test 0.02 0.37 per allele 0.90 0.82 to 0.99 0.03 1.06 0.87 to 1.31 0.55 ZMIZ1 - rs704010 BRCA1 CC 1,904 (40.2) 2,493 (40.0) 583 (40.1) 1 1 CT 2,172 (45.9) 2,871 (46.0) 665 (45.7) 1.02 0.95 to 1.10 1.01 0.89 to 1.15 TT 660 (13.9) 877 (14.1) 206 (14.2) 1.02 0.92 to 1.14 1.01 0.84 to 1.22 2-df test 0.67 0.99 per allele 1.01 0.97 to 1.07 0.58 1.01 0.92 to 1.10 0.90 BRCA2 CC 1,109 (39.0) 1,439 (38.4) 181 (40.1) 1 1 CT 1,306 (46.0) 1,774 (47.3) 192 (43.4) 1.06 0.96 to 1.17 0.96 0.76 to 1.20 TT 426 (15.0) 538 (14.3) 69 (15.6) 1.00 0.86 to 1.15 1.05 0.77 to 1.43 2-df test 0.46 0.81 per allele 1.01 0.95 to 1.08 0.72 1.01 0.87 to 1.18 0.90 10p15 - rs2380205 BRCA1 CC 1,183 (32.2) 1,698 (32.1) 438 (33.2) 1 1 CT 1,796 (48.9) 2,605 (49.3) 634 (48.1) 0.99 0.91 to 1.08 0.91 0.79 to 1.05 TT 696 (18.9) 981 (18.6) 246 (18.7) 1.00 0.90 to 1.12 0.94 0.78 to 1.14 2-df test 0.96 0.45 per allele 1.00 0.95 to 1.06 0.98 0.96 0.87 to 1.06 0.40 BRCA2 CC 872 (32.6) 1,161 (31.8) 143 (33.7) 1 1 CT 1,321 (49.4) 1,812 (49.6) 199 (46.9) 1.04 0.94 to 1.16 0.94 0.74 to 1.19 TT 481 (18.0) 678 (18.6) 82 (19.3) 1.03 0.90 to 1.18 1.01 0.75 to 1.38 2-df test 0.74 0.82 per allele 1.02 0.95 to 1.09 0.61 1.00 0.85 to 1.16 0.98 11q13 - rs614367 BRCA1 CC 3,439 (72.3) 4,547 (72.1) 1,111 (76.2) 1 1 CT 1,212 (25.5) 1,606 (25.5) 311 (21.3) 1.02 0.94 to 1.11 0.83 0.72 to 0.96 TT 109 (2.3) 154 (2.4) 37 (2.5) 1.12 0.91 to 1.39 1.20 0.81 to 1.76 2-df test 0.52 0.03
estimates were not significantly different from those for
ER-negative breast cancer.
Discussion
We have investigated eight novel breast cancer
suscept-ibility loci identified through breast cancer GWAS
[15-17] for their associations with breast cancer risk for
BRCA1
and BRCA2 mutation carriers using data from
the CIMBA. The estimated per-allele ORs associated
with the minor allele of each SNP from the
population-based studies varied from 0.85 to 1.15, and only four of
the eight SNPs had ORs of less than 0.90 or greater
than 1.10 (rs10995190, rs614367, rs865686 and
rs10771399) [15-17]. For BRCA1 mutation carriers, only
SNP rs10771399 at 12p11 was associated with the
over-all risk of breast cancer, whereas SNPs rs10995190 at
10q21, rs1011970 at 9p21, rs865686 at 9q31.2 and
rs1292011 at 12q24 were associated with breast cancer
Table 4 Competing risk analysis*. (Continued)
per allele 1.03 0.91 to 1.10 0.35 0.91 0.80 to 1.03 0.13 BRCA2 CC 2,106 (73.5) 2,716 (71.9) 333 (73.8) 1 1 CT 693 (24.2) 981 (26.0) 108 (24.0) 1.05 0.95 to 1.16 0.95 0.74 to 1.21 TT 66 (2.3) 83 (2.2) 10 (2.2) 0.96 0.71 to 1.28 0.87 0.46 to 1.63 2-df test 0.62 0.84 per allele 1.03 0.94 to 1.12 0.56 0.94 0.77 to 1.15 0.56 12q24 - rs1292011 BRCA1 AA 997 (34.1) 1,321 (35.4) 305 (34.9) 1 1 AG 1,406 (48.2) 1,765 (47.3) 429 (49.1) 1.00 0.90 to 1.10 1.11 0.93 to 1.31 GG 517 (17.7) 645 (17.3) 140 (16.0) 1.01 0.89 to 1.15 0.98 0.78 to 1.24 2-df test 0.97 0.39 per allele 1.00 0.94 to 1.07 0.91 1.01 0.91 to 1.13 0.82 BRCA2 AA 715 (35.0) 907 (35.9) 110 (36.5) 1 1 AG 961 (47.0) 1222 (48.4) 137 (45.5) 1.02 0.90 to 1.15 0.94 0.71 to 1.25 GG 370 (18.1) 396 (15.7) 54 (17.9) 0.83 0.70 to 0.97 0.89 0.61 to 1.28 2-df test 0.03 0.80 per allele 0.93 0.86 to 1.00 0.07 0.94 0.78 to 1.13 0.51 PTHLH - rs10771399 BRCA1 AA 3,810 (79.8) 5,179 (81.9) 1,145 (78.4) 1 1 AG 909 (19.0) 1078 (17.1) 289 (19.8) 0.89 0.81 to 0.97 1.09 0.93 to 1.26 GG 56 (1.2) 65 (1.0) 27 (1.9) 0.86 0.63 to 1.16 1.67 1.05 to 2.64 2-df test 0.02 0.06 per allele 0.90 0.83 to 0.97 6.4 × 10⁻³ 1.14 1.00 to 1.30 0.06 BRCA2 AA 2,289 (79.7) 3,076 (81.2) 369 (81.5) 1 1 AG 545 (19.0) 678 (17.9) 76 (16.8) 0.94 0.84 to 1.06 0.88 0.67 to 1.16 GG 37 (1.3) 34 (0.9) 8 (1.8) 0.79 0.49 to 1.26 1.48 0.63 to 3.46 2-df test 0.38 0.43 per allele 0.93 0.84 to 1.04 0.19 0.96 0.75 to 1.23 0.75 9q31.2 - rs865686 BRCA1 TT 1,935 (40.5) 2,621 (41.5) 605 (41.3) 1 1 TG 2,206 (46.2) 2,825 (44.7) 690 (47.1) 0.94 0.88 to 1.01 0.99 0.87 to 1.12 GG 633 (13.3) 877 (13.9) 169 (11.5) 1.03 0.93 to 1.15 0.85 0.70 to 1.03 2-df test 0.12 0.23 per allele 1.00 0.95 to 1.05 0.88 0.94 0.86 to 1.03 0.17 BRCA2 TT 1,103 (38.4) 1,576 (41.6) 179 (39.6) 1 1 TG 1400 (48.8) 1712 (45.2) 215 (47.6) 0.85 0.77 to 0.94 0.91 0.73 to 1.14 GG 367 (12.8) 501 (13.2) 58 (12.8) 0.97 0.84 to 1.12 0.98 0.71 to 1.35 2-df test 4.6 × 10⁻³ 0.70 per allele 0.94 0.88 to 1.01 0.10 0.97 0.83 to 1.13 0.67
Associations with breast and ovarian cancer risk for BRCA1 and BRCA2 carriers. *Censoring process described in the methods
risk for BRCA2 mutation carriers. The magnitude of the
estimated HRs for all these SNPs were consistent with
the OR estimates for the risk of breast cancer in the
general population. The power to detect associations
with SNPs conferring relative risks in the range of 0.90
to 1.10 was limited by our sample size, particularly
among BRCA2 mutation carriers [29].
Based on the HR estimates and associated 95%
confi-dence intervals, given our sample size of BRCA1
muta-tion carriers, it is unlikely that the relative risks for
overall BRCA1 breast cancer risk are of similar
magni-tude to those estimated in the general population for
SNPs rs10995190 at 10q21 (estimated odds ratio (OR)
from the replication stage of the GWAS = 0.76),
rs2380205 at 10p15 (OR = 0.94), rs614367 at 11q13 (OR
= 1.15), rs1292011 at 12q24 (OR = 0.92) and rs865686
at 9q31.2 (OR = 0.89), since the 95% confidence
inter-vals for the HRs do not include the estimated OR from
the population-based studies. Similarly, the HRs for
BRCA2
breast cancer risk exclude the ORs from the
general population for SNPs rs2380205 at 10p15 and
rs614367 at 11q13. Taken together, these findings
sug-gest that SNPs rs2380205 at 10p15 and rs614367 at
11q13 do not modify breast cancer risk in either BRCA1
or BRCA2 mutation carriers. A replication study by
BCAC, involving close to 50,000 breast cancer cases and
50,000 controls, found only weak evidence for
associa-tion of rs2380205 at 10p15 with breast cancer risk in
the general population [Lambrechts and Easton personal
communication, manuscript submitted] suggesting that
the original finding (OR = 0.94, P = 5 × 10
-7[15]) may
have been a false positive. If this were true, the absence
of an association in carriers would be expected. The
lack of evidence for an association with the 11q13 SNP
rs614367 with BRCA1 and BRCA2 breast cancer risk is
more surprising since the association in the general
population is relatively strong and consistently replicated
(OR 1.21, 95% CI 1.17 to 1.25 in the recent BCAC
Table 5 Associations with estrogen receptor-positive and estrogen receptor-negative breast cancer risk for BRCA1 and
BRCA2
carriers.
ER-positive ER-negative Unaffected
N
ER-positive N ER-negative N ER status unknown N HR 95% CI P -value HR 95% CI P-value P-dif CDK2NA/B -rs1011970 BRCA1 4,893 559 1,888 2,841 0.95 0.81 to 1.12 0.56 1.03 0.95 to 1.11 0.47 0.41 BRCA2 2,928 1,372 424 1,649 1.10 1.00 to 1.22 0.05 1.15 0.96 to 1.37 0.12 0.70 ZNF365 -rs10995190 BRCA1 4,895 559 1,887 2,843 0.88 0.74 to 1.04 0.14 1.01 0.94 to 1.10 0.75 0.16 BRCA2 2,927 1,370 406 1,648 0.89 0.80 to 1.00 0.043 0.87 0.71 to 1.07 0.19 0.84 ZMIZ1 - rs704010 BRCA1 4,842 548 1,846 2,811 1.12 1.00 to 1.26 0.046 1.00 0.94 to 1.06 0.91 0.08 BRCA2 2,887 1,347 401 1,636 1.01 0.93 to 1.09 0.91 1.00 0.87 to 1.14 0.95 0.91 10p15 -rs2380205 BRCA1 4,465 540 1,812 2,513 0.90 0.80 to 1.01 0.08 1.02 0.96 to 1.09 0.46 0.06 BRCA2 2,701 1,341 396 1,543 1.02 0.95 to 1.10 0.60 0.94 0.82 to 1.08 0.39 0.31 11q13 - rs614367 BRCA1 4,879 557 1,886 2,832 1.09 0.93 to 1.29 0.30 1.04 0.96 to 1.12 0.40 0.59 BRCA2 2,921 1,365 405 1,639 1.06 0.96 to 1.17 0.26 0.84 0.69 to 1.04 0.10 0.05 12q24 -rs1292011 BRCA1 3,429 308 1,043 2,031 0.87 0.74 to 1.02 0.09 1.05 0.98 to 1.13 0.12 0.046 BRCA2 2,065 813 239 1,170 0.95 0.86 to 1.04 0.28 0.98 0.82 to 1.16 0.78 0.79 PTHLH -rs10771399 BRCA1 4,889 557 1,887 2,842 0.94 0.78 to 1.13 0.52 0.81 0.74 to 0.90 3.8 × 10⁻⁵ 0.20 BRCA2 2,926 1,366 406 1,648 0.97 0.86 to 1.10 0.68 0.78 0.62 to 1.00 0.049 0.12 9q31.2 - rs865686 BRCA1 4,892 559 1,888 2,836 0.92 0.81 to 1.03 0.15 1.01 0.95 to 1.08 0.68 0.16 BRCA2 2,924 1,370 405 1,645 0.91 0.84 to 0.99 0.028 1.07 0.92 to 1.25 0.40 0.08
analysis [Lambrechts and Easton personal
communica-tion, manuscript submitted]). The association in the
general population appears to be restricted to
ER-posi-tive disease, which would explain the lack of association
for BRCA1 carriers but not BRCA2 carriers. This is
per-haps the clearest evidence so far of a departure from a
multiplicative interaction between a common
suscept-ibility locus and a BRCA2 mutation on the risk of
devel-oping breast cancer. The lack of an association in
BRCA1
carriers for rs1292011 and rs865686 is also
con-sistent with the observation that these associations are
stronger for ER-positive disease in the general
popula-tion [16]. The absence of an associapopula-tion for ZNF365
rs10995190 in BRCA1 carriers is more surprising since
this association appears to be unrelated to ER status in
the general population [Lambrechts and Easton personal
communication, manuscript submitted] [30].
Of the eight SNPs investigated, the strongest
associa-tion was found between SNP rs10771399 at 12p11 and
breast cancer risk for BRCA1 mutation carriers. Other
loci previously found to be associated with BRCA1
breast cancer risk include the 19p13 and 6q25.1 loci
[6,9], TOX3 and CASP8 [3,5,7]. Analysis by tumour
ER-status revealed that rs10771399 at 12p11 has a stronger
association with ER-negative than ER-positive breast
cancer for both BRCA1 and BRCA2 mutation carriers.
The ER-specific HRs were similar for both genes,
sug-gesting that this SNP is primarily associated with
ER-negative breast cancer, although results from the general
population suggested similar ORs for ER-positive and
ER-negative breast cancer (0.87 for ER-positive disease,
0.85 for ER-negative disease [16]). Interestingly, the
association among BRCA1 mutation carriers was
restricted to those carrying mutations proven or
pre-dicted to lead to absence of protein expression (Class 1)
with no evidence for an association in carriers of
BRCA1
mutations likely to generate stable mutant
pro-teins (Class 2) (P-diff = 0.03). This observation suggests
that the modifying effect of SNP rs10771399 at 12p11
might be attenuated for tumours that retain residual
BRCA1
function or that retain the capacity to bind to
some of its partners. rs10771399 lies in a region at
12p11 that contains PTHLH (parathyroid hormone-like
hormone isoform 1, also known as PTHRP - parathyroid
hormone-related protein) and CCDC91. PTHLH is a
plausible candidate cancer susceptibility gene. It encodes
a protein that regulates endochondral bone development
and epithelial-mesenchymal interactions during the
for-mation of the mammary glands. The receptor of this
hormone, PTHR1, is responsible for most cases of
humoral hypercalcemia of malignancy [31]. It is
pro-duced by various types of carcinomas [32], and is an
important factor in the development of bone metastasis
[33].
We found that SNP rs10995190 ZNF365 is associated
with BRCA2 breast cancer risk. A different SNP
(rs16917302) in ZNF365, which is only weakly
corre-lated with rs10995190 (pairwise r
2is approximately 0.10
in the present sample) was previously identified via a
GWAS of breast cancer in BRCA2 mutation carriers
[10]. These results suggest that there could be a causal
associated variant correlated with both rs10995190 and
rs16917302, or alternatively more than one causal
dis-ease variant in this locus. SNP rs10995190 has also
recently been found to be associated with
mammo-graphic density in the general population [34]. Previous
studies found that mammographic density modifies
breast cancer risk for BRCA2 mutation carriers [35],
raising the possibility that this locus modifies breast
cancer risk for BRCA2 mutation carriers through its
influence on mammographic density. However,
mam-mographic density has also been shown to modify the
breast cancer risk for BRCA1 carriers, which also makes
the absence of association for rs10995190 in BRCA1
car-riers somewhat surprising. Mammographic density data
are not available in the CIMBA sample to test this
hypothesis explicitly.
There was no evidence of association with ovarian
cancer risk for BRCA1 or BRCA2 mutation carriers for
any of the SNPs, with the exception of some weak
evi-dence for SNPs rs10771399 and rs614367 for BRCA1
carriers. This is not surprising, since all SNPs were
selected on the basis of prior evidence of association
with breast cancer risk in the general population and
none of these SNPs have so far been found to be
asso-ciated with ovarian cancer in general population
through the ongoing GWAS [36-38].
Conclusions
The per-allele HRs estimated for each of the associated
loci in the present report are modest, and in isolation
would have only a small impact on the absolute risks of
developing breast cancer. However, we have shown
pre-viously that modifier SNPs in combination can result in
large differences in the absolute risk of developing
breast cancer for carriers at the extreme percentiles of
the combined SNP distribution [5,39]. Furthermore, the
causal variants underlying these loci may confer larger
relative risks. Considering all reported modifying loci by
the CIMBA consortium, there are now six loci in total
that are associated with breast cancer risk for BRCA1
mutation carriers (19p13, 6q25.1, 12p11, TOX3, 2q35
and CASP8) and 13 loci which are known to be
asso-ciated with BRCA2 breast cancer risk (FGFR2, TOX3,
MAP3K1, LSP1
, 2q35, SLC4A7, 5p12, 1p11.2, ZNF365,
CDKN2A/B
, 9q31.2, 12q24 and RAD51). Ongoing
GWAS in BRCA1 and BRCA2 mutation carriers and in
the general population are likely to identify further
modifier loci and taken together, they may lead to more
accurate risk predictions in mutation carriers with
implications for clinical management, and to a better
understanding of the biology of tumour development in
mutation carriers.
Additional material
Additional file 1: Supplementary tables and figures. Table S1 List of local ethics committees that granted approval for the access and use of the data in current study. Supplementary figure 1 Forest plot of the country-specific per-allele HR estimates for breast cancer for BRCA1 mutation carriers. Supplementary figure 2 Forest plot of the country-specific per-allele HR estimates for breast cancer for BRCA2 mutation carriers.
Abbreviations
BCAC: Breast Cancer Association Consortium; CIMBA: Consortium of Investigators of Modifiers of BRCA1/2; ER: estrogen receptor; GWAS: genome-wide association studies; HR: hazard ratio; HWE: Hardy-Weinberg equilibrium; NMD: nonsense-mediated mRNA decay; OR: odds ratio; SNPs: single-nucleotide polymorphism.
Acknowledgements
This work was supported by Cancer Research UK grants C12292/A11174 and C1287/A10118. The research leading to these results has received funding from the European Community’s Seventh Framework Programme under grant agreement n° 223175 (HEALTH-F2-2009-223175), from the Canadian Institutes of Health Research for the “CIHR Team in Familial Risks of Breast Cancer” program and by the Canadian Breast Cancer Research Alliance-grant #019511. This research was also supported by NIH grant CA128978, an NCI Specialized Program of Research Excellence (SPORE) in Breast Cancer (CA116201), a U.S. Department of Defence Ovarian Cancer Idea award (W81XWH-10-1-0341) and grants from the Breast Cancer Research Foundation and the Komen Foundation for the Cure. ACA is a CR-UK Senior Cancer Research Fellow, DFE is CR-UK Principal Research Fellow, GCT is a NHMRC Senior Principal Research Fellow, J.S. is Chairholder of the Canada Research Chair in Oncogenetics.
Study specific
Baltic Familial Breast and Ovarian Cancer Consortium
We acknowledge the Genome Database of Latvian Population, Latvian Biomedical
Research and Study Centre and Ramunas Janavicius (Vilnius University Hospital Santariskiu Clinics, Lithuania) for data and DNA samples for BFBOCC. The work was supported in part by a grant from the European Social Fund Nr.2009/0220/1DP/1.1.1.2.0/09/APIA/VIAA/016.
BMBSA was supported by grants from the Cancer Association of South Africa (CANSA) to Elizabeth J. van Rensburg.
Breast Cancer Family Registry (BCFR)
This work was supported by the National Cancer Institute, National Institutes of Health under RFA-CA-06-503 and through cooperative agreements with members of the Breast Cancer Family Registry (BCFR) and Principal Investigators, including Cancer Care Ontario (U01 CA69467), Columbia University (U01 CA69398), Fox Chase Cancer Center (U01 CA69631), Huntsman Cancer Institute (U01 CA69446), Cancer Prevention Institute of California (formerly the Northern California Cancer Center) (U01 CA69417), University of Melbourne (U01 CA69638), and Research Triangle Institute Informatics Support Center (RFP No. N02PC45022-46). Samples from the FCCC, HCI and CPIC were processed and distributed by the Coriell Institute for Medical Research. The content of this manuscript does not necessarily reflect the views or policies of the National Cancer Institute or any of the collaborating centres in the BCFR, nor does mention of trade names, commercial products or organizations imply endorsement by the US Government or the BCFR.
CNIO
The research leading to these results has been partially funded by Mutua Madrileña Foundation, “Red de Investigación en Cáncer RD06/0020/1160” and Spanish Ministry of Science and Innovation (FIS PI08 1120 and SAF2010-20493).
Copenhagen Breast Cancer Study (CBCS)
We would like to thank Bent Ejlertsen for clinical data and acknowledge the NEYE foundation for financial support.
Deutsches Krebsforschungszentrum (DKFZ) study The DKFZ study was supported by the DKFZ.
Epidemiological study of BRCA1 & BRCA2 mutation carriers (EMBRACE) Douglas F. Easton is the PI of the study. EMBRACE Collaborating Centres are: Coordinating Centre, Cambridge: Susan Peock, Debra Frost, Steve D. Ellis, Elena Fineberg, Radka Platte, Clare Oliver. North of Scotland Regional Genetics Service, Aberdeen: Zosia Miedzybrodzka, Helen Gregory. Northern Ireland Regional Genetics Service, Belfast: Patrick Morrison, Lisa Jeffers. West Midlands Regional Clinical Genetics Service, Birmingham: Trevor Cole, Kai-ren Ong, Jonathan Hoffman. South West Regional Genetics Service, Bristol: Alan Donaldson, Margaret James. East Anglian Regional Genetics Service, Cambridge: Joan Paterson, Sarah Downing, Amy Taylor. Medical Genetics Services for Wales, Cardiff: Alexandra Murray, Mark T. Rogers, Emma McCann. St James’s Hospital, Dublin and National Centre for Medical Genetics, Dublin: M. John Kennedy, David Barton. South East of Scotland Regional Genetics Service, Edinburgh: Mary Porteous, Sarah Drummond. Peninsula Clinical Genetics Service, Exeter: Carole Brewer, Emma Kivuva, Anne Searle, Selina Goodman, Kathryn Hill. West of Scotland Regional Genetics Service, Glasgow: Rosemarie Davidson, Victoria Murday, Nicola Bradshaw, Lesley Snadden, Mark Longmuir, Catherine Watt, Sarah Gibson, Eshika Haque, Ed Tobias, Alexis Duncan. South East Thames Regional Genetics Service, Guy’s Hospital London: Louise Izatt, Chris Jacobs, Caroline Langman. North West Thames Regional Genetics Service, Harrow: Huw Dorkins. Leicestershire Clinical Genetics Service, Leicester: Julian Barwell. Yorkshire Regional Genetics Service, Leeds: Julian Adlard, Gemma Serra-Feliu. Cheshire & Merseyside Clinical Genetics Service, Liverpool: Ian Ellis, Catherine Houghton. Manchester Regional Genetics Service, Manchester: D Gareth Evans, Fiona Lalloo, Jane Taylor. North East Thames Regional Genetics Service, NE Thames, London: Lucy Side, Alison Male, Cheryl Berlin. Nottingham Centre for Medical Genetics, Nottingham: Jacqueline Eason, Rebecca Collier. Northern Clinical Genetics Service, Newcastle: Fiona Douglas, Oonagh Claber, Irene Jobson. Oxford Regional Genetics Service, Oxford: Lisa Walker, Diane McLeod, Dorothy Halliday, Sarah Durell, Barbara Stayner. The Institute of Cancer Research and Royal Marsden NHS Foundation Trust: Ros Eeles, Susan Shanley, Nazneen Rahman, Richard Houlston, Elizabeth Bancroft, Elizabeth Page, Audrey Ardern-Jones, Kelly Kohut, Jennifer Wiggins, Elena Castro, Anita Mitra, Lisa Robertson. North Trent Clinical Genetics Service, Sheffield: Jackie Cook, Oliver Quarrell, Cathryn Bardsley. South West Thames Regional Genetics Service, London: Shirley Hodgson, Sheila Goff, Glen Brice, Lizzie Winchester, Charlotte Eddy, Vishakha Tripathi, Virginia Attard. Wessex Clinical Genetics Service, Princess Anne Hospital, Southampton: Diana Eccles, Anneke Lucassen, Gillian Crawford, Donna McBride, Sarah Smalley. EMBRACE is supported by Cancer Research UK Grants C1287/A10118 and C1287/A11990. D. Gareth Evans and Fiona Lalloo are supported by an NIHR grant to the Biomedical Research Centre, Manchester. The Investigators at The Institute of Cancer Research and The Royal Marsden NHS Foundation Trust are supported by an NIHR grant to the Biomedical Research Centre at The Institute of Cancer Research and The Royal Marsden NHS Foundation Trust. Ros Eeles is supported by Cancer Research UK Grant C5047/A8385. GEORGETOWN
CI received support from the Familial Cancer Registry and the Tissue Culture Shared Registry at Georgetown University (NIH/NCI grant P30-CA051008), the Cancer Genetics Network (HHSN261200744000C), and Swing Fore the Cure. Gynecologic Oncology Group (GOG)
This study was supported by National Cancer Institute grants to the Gynecologic Oncology Group (GOG) Administrative Office and the GOG Tissue Bank (CA 27469), and to the GOG Statistical and Data Center (CA 37517 and CA 101165). We thank the investigators of the Australia New Zealand Gynaecological Oncology Group (ANZGOG). GOG’s participation was sponsored by GOG’s Cancer Prevention and Control Committee, and supported through funding provided by both intramural (Clinical Genetics Branch, DCEG) and extramural (Community Oncology and Prevention Trials Program - COPTRG) NCI programs.
The HCSC study was partially supported by Instituto de Salud Carlos III; RD06/0020/0021. We wish to thank Dr. Pedro Perez-Segura and Dr. Atocha Romero for their contribution to this study.
The Hereditary Breast and Ovarian Cancer Research Group Netherlands (HEBON)
HEBON Collaborating Centres: Coordinating center: Netherlands Cancer Institute, Amsterdam, NL: F.B.L. Hogervorst, S. Verhoef, M. Verheus, L.J. van ‘t Veer, F.E. van Leeuwen, M.A. Rookus; Erasmus Medical Center, Rotterdam, NL: M. Collée, A.M.W. van den Ouweland, A. Jager, M.J. Hooning, M.M.A. Tilanus-Linthorst, C. Seynaeve; Leiden University Medical Center, NL, Leiden: C.J. van Asperen, J.T. Wijnen, M.P. Vreeswijk, R.A. Tollenaar, P. Devilee; Radboud University Nijmegen Medical Center, Nijmegen, NL: M.J. Ligtenberg, N. Hoogerbrugge; University Medical Center Utrecht, Utrecht, NL: M.G. Ausems, R.B. van der Luijt; Amsterdam Medical Center, NL: C.M. Aalfs, T.A. van Os; VU University Medical Center, Amsterdam, NL: J.J.P. Gille, Q. Waisfisz, H.E.J. Meijers-Heijboer; University Hospital Maastricht, Maastricht, NL: E.B. Gomez-Garcia, C.E. van Roozendaal, Marinus J. Blok, B. Caanen; University Medical Center Groningen University, NL: J.C. Oosterwijk, A.H. van der Hout, M.J. Mourits; The Netherlands Foundation for the detection of hereditary tumours, Leiden, NL: H.F. Vasen. The HEBON study is supported by the Dutch Cancer Society grants NKI1998-1854, NKI2004-3088, NKI2007-3756 and the ZonMW grant 91109024.
Helsinki Breast Cancer Study (HEBCS)
HEBCS acknowledge Drs. Kristiina Aittomäki, Kirsimari Aaltonen and Carl Blomqvist and Tuomas Heikkinen and research nurse Irja Erkkilä for their help with the patient data and samples. The HEBCS study has been financially supported by the Helsinki University Central Hospital Research Fund, Academy of Finland (132473), the Finnish Cancer Society, and the Sigrid Juselius Foundation.
ICO
Contract grant sponsor: Asociación Española Contra el Cáncer, Spanish Health Research Fund; Carlos III Health Institute; Catalan Health Institute and Autonomous Government of Catalonia. Contract grant numbers: ISCIIIRETIC RD06/0020/1051, PI10/01422, PI10/31488 and 2009SGR290.
ILUH
The ILUH group was supported by the Icelandic Association “Walking for Breast Cancer Research” and by the Landspitali University Hospital Research Fund.
INHERIT
We would like to thank Stéphane Dubois, Dr Martine Dumont, Martine Tranchant (Cancer Genomics Laboratory, CRCHUQ) for sample management and skillful technical assistance, Sylvie Desjardins and Marc-André Rodrigue (Plateforme de séquençage et de génotypage des génome du CRCHUL/ CHUQ) for iPLEX genotyping and Pascal Belleau for data quality control analyses.
Istituto Oncologico Veneto Hereditary Breast and Ovarian Cancer Study (IOVHBOCS)
This study was supported by Ministero dell’Istruzione, dell’Università e della Ricerca (MIUR) and “Ministero della Salute” ("Progetto Tumouri Femminili and grant numbers RFPS 2006-5-341353, ACC2/R6.9”)
kConFab
We wish to thank Heather Thorne, Eveline Niedermayr, all the kConFab research nurses and staff, the heads and staff of the Family Cancer Clinics, and the Clinical Follow Up Study (funded 2001-2009 by NHMRC and currently by the National Breast Cancer Foundation and Cancer Australia #628333) for their contributions to this resource, and the many families who contribute to kConFab. kConFab is supported by grants from the National Breast Cancer Foundation, the National Health and Medical Research Council (NHMRC) and by the Queensland Cancer Fund, the Cancer Councils of New South Wales, Victoria, Tasmania and South Australia, and the Cancer Foundation of Western Australia. ABS is funded by an NHMRC Senior Research Fellowship.
Memorial Sloan-Kettering Cancer Center (MSKCC)
We acknowledge the Starr Cancer Consortium, the Breast Cancer Research Foundation, the Norman and Carol Stone Cancer Research Initiative, the Kate and Robert Niehaus Clinical Cancer Research Initiative, the Lymphoma Foundation, and the Sabin Family Research Initiative.
National Cancer Institute (NCI)
The research of Drs. Greene and Loud was supported by the Intramural Research Program of the US National Cancer Institute at the National
Institutes of Health, and by support services contracts NO2-CP-11019-50 and N02-CP-65504 with Westat, Inc, Rockville, MD.
N.N. Petrov Institute of Oncology (NNPIO)
This work has been supported by the Russian Federation for Basic Research (grants 10-04-92601, 10-04-92110, 11-04-00227) the Federal Agency for Science and Innovations (contract 16.512.11.2237) and through a Royal Society International Joint grant (JP090615).
The Hong Kong Hereditary Breast Cancer Family Registry thank Dr. Ellen Li Charitable Foundation for their support
Hungarian Breast and Ovarian Cancer Study (HUNBOCS)
The study was supported by Norwegian EEA Financial Mechanism (HU0115/ NA/2008-3/ÖP-9) and by Hungarian Research Grant KTIA-OTKA (CK-80745). Ohio State University Clinical Cancer Genetics (OSU-CCG)
Leigha Senter and Kevin Sweet were instrumental in accrual of study participants, ascertainment of medical records and database management. We thank the Human Genetics Sample Bank for preparation of samples. This study was supported by the Ohio State University Comprehensive Cancer Center.
Ontario Cancer Genetics Network Study (OCGN)
This work was supported by Cancer Care Ontario, the “CIHR Team in Familial Risks of Breast Cancer” program, and the US National Cancer Institute, National Institutes of Health under RFA # CA- 06-503 and through cooperative agreements with members of the Breast Cancer Family Registry (BCFR) and Principal Investigators. The content of this manuscript does not necessarily reflect the views or policies of the National Cancer Institute or any of the collaborating centres in the BCFR, nor does mention of trade names, commercial products, or organizations imply endorsement by the US Government or the BCFR. We wish to thank Teresa Selander, Nayana Weerasooriya and members of the Ontario Cancer Genetics Network for their contributions to the study.
Beckman Research Institute of City of Hope (BRICOH)
The study was supported by the National Institutes of Health (R01 CA74415 to SLN)) and the Morris and Horowitz Families Endowment.
SWE-BRCA
SWE-BRCA collaborators: Per Karlsson, Margareta Nordling, Annika Bergman and Zakaria Einbeigi, Gothenburg, Sahlgrenska University Hospital; Marie Stenmark-Askmalm and Sigrun Liedgren, Linköping University Hospital; Åke Borg, Niklas Loman, Håkan Olsson, Maria Soller, Helena Jernström, Katja Harbst and Karin Henriksson, Lund University Hospital; Annika Lindblom, Brita Arver, Anna von Wachenfeldt, Annelie Liljegren, Gisela Barbany-Bustinza and Johanna Rantala, Stockholm, Karolinska University Hospital; Beatrice Melin, Henrik Grönberg, Eva-Lena Stattin and Monica Emanuelsson, Umeå University Hospital; Hans Ehrencrona, Richard Rosenquist and Niklas Dahl, Uppsala University Hospital.
U.K. and Gilda Radner Familial Ovarian Cancer Registry (UKGRFOCR) UKFOCR was supported by a project grant from CRUK to Paul Pharoah. We thank Paul Pharoah, Susan Ramus, Carole Pye, Patricia Harrington and Eva Wozniak for their contributions towards the UKFOCR. We would like to acknowledge the Roswell Park Alliance Foundation for their continued support of the Gilda Radner Ovarian Family Cancer Registry. GRFOCR would like to acknowledge Kirsten Moysich and Lara Sucheston (Department of Cancer Prevention and Control).
University of Kansas Medical Center (KUMC)
We thank Ms. JoEllen Weaver for her help collecting patient data and samples. AKG was funded by U01CA69631, 5U01CA113916, and the Eileen Stein Jacoby Fund while at FCCC. The author acknowledges support from The University of Kansas Cancer Center and the Kansas Bioscience Authority Eminent Scholar Program. AKG is the Chancellors Distinguished Chair in Biomedical Sciences endowed Professor.
University of Pennsylvania (UPENN)
This research was supported by the Breast Cancer Research Foundation (to KLN) and the Komen Foundation for the Cure (to SMD).
Women’s Cancer Program - Cedars-Sinai Medical Center (WCRI) This work is supported by funding from the American Cancer Society Clinical Research Professorship (SIOP-06-258-COUN).
Author details
1Centre for Cancer Genetic Epidemiology, Department of Public Health and
Primary Care, University of Cambridge, Worts Causeway, Cambridge CB1 8RN, UK.2Cancer Genomics Laboratory, Centre Hospitalier Universitaire de