Publisher’s version / Version de l'éditeur:
Vous avez des questions? Nous pouvons vous aider. Pour communiquer directement avec un auteur, consultez la première page de la revue dans laquelle son article a été publié afin de trouver ses coordonnées. Si vous n’arrivez pas à les repérer, communiquez avec nous à [email protected].
Questions? Contact the NRC Publications Archive team at
[email protected]. If you wish to email the authors directly, please see the first page of the publication for their contact information.
https://publications-cnrc.canada.ca/fra/droits
L’accès à ce site Web et l’utilisation de son contenu sont assujettis aux conditions présentées dans le site LISEZ CES CONDITIONS ATTENTIVEMENT AVANT D’UTILISER CE SITE WEB.
Canadian Journal of Civil Engineering, 16, 1, pp. 16-21, 1989-02
READ THESE TERMS AND CONDITIONS CAREFULLY BEFORE USING THIS WEBSITE. https://nrc-publications.canada.ca/eng/copyright
NRC Publications Archive Record / Notice des Archives des publications du CNRC :
https://nrc-publications.canada.ca/eng/view/object/?id=2144a363-ced8-411c-87a4-2e44394d1d05
https://publications-cnrc.canada.ca/fra/voir/objet/?id=2144a363-ced8-411c-87a4-2e44394d1d05
NRC Publications Archive
Archives des publications du CNRC
This publication could be one of several versions: author’s original, accepted manuscript or the publisher’s version. / La version de cette publication peut être l’une des suivantes : la version prépublication de l’auteur, la version acceptée du manuscrit ou la version de l’éditeur.
For the publisher’s version, please access the DOI link below./ Pour consulter la version de l’éditeur, utilisez le lien DOI ci-dessous.
https://doi.org/10.1139/l89-003
Access and use of this website and the material on it are subject to the Terms and Conditions set forth at
Measurement of ridge sails in the Beaufort Sea
- SeT
T
31
g21a
National Research
Conseil national
no0
15
9
1
+
1
council ~anacia
de recherches Canada
C 0
2
BLOC
Institute for
lnstitut de
Research in
recherche en
-
Construction
construction
by M. Sayed and R.M.W. Frederking
Reprinted from
Canadian Journal of Civil Engineering
Vol. 16, No.
1,
February 1989
p. 16-21
(IRC Paper No. 1590)
Measurements of Ridge Sails in the
Beaufort Sea
NRCC 30249
N R C
-
ClSTlL I B R A R Y
This paper is being distributed in reprint form by the Institute for
Research in Construction.
Alist of building practice and research
publications available from the Institute may be obtained by writing to
the Publications Section, Institute for Research in Construction,
National Research Council of Canada, Ottawa, Ontario,
KIA
0R6.
Ce document est distribuk sous forme de tird-&-part par 1'Institut de
recherche en construction. On peut obtenir une liste des publications de
1'Institut portant sur les techniques ou les recherches en matitre de
bitiment en krivant h la Section des publications, Institut de recherche
en construction. Conseil
nsrinnal de rechewkc dur e Q t t a w a
Measurements of ridge sails in the Beaufort Sea
M. SAVED A N D R. M. W. FREDERKING
Institute for Research in Construction, National Research Council of Canada, Ottawa, Ont., Canada K I A OR6 Received February 24, 1988
Revised manuscript accepted July 18, 1988
Ice pressure ridges in the southern Beaufort Sea near Tuktoyaktuk were surveyed in April 1986. Sail cross-section profiles and ice-block dimensions of ridges of extreme heights were measured at several locations along the outer edge of the landfast ice. Slatistical distributions of sail heights as well as correlations between sail dimensions and between ice block dimensions are obtained. Geographical distribution of sail dimensions and longitudinal changes along individual ridges are examined.
Key words: ridges, landfast ice, sea ice, ridge sails, ridge statistics, Beaufort Sea.
Les crstes de pression des glaces dans le sud de la mer de Beaufort prks de Tuktoyaktuk ont C t t analysCes au mois d'avril 1986. Les profils en coupe des voiles et les dimensions des blocs de glace des crstes de trks grande hauteur ont C t t mesurCs a plusieurs endroits le long de la bordure exttrieure de la glace bordikre. La repartition statistique des hauteurs des voiles et les relations entre les dimensions des voiles et celles des blocs de glace ont CtC obtenues. La kpartition geographique des dimensions des voiles et les modifications longitudinales le long de crstes individuelles ont CtC examintes.
Mots clks : crstes de glace, glace bordiere, glace de mer, voiles de crste, statistiques des crstes, mer de Beaufort. [Traduit par la revue] Can. J. Civ. Eng. 16, 16-21 (1989)
Introduction
Pressure ridges usually develop during deformation of floating sea ice covers. Studies of the ridging processes are motivated by the need to understand large-scale ice movements and the forces producing them. As may be intuitively expected, compressive stresses in an ice cover are limited by the values associated with building of pressure ridges. The size of ridges would be proportional to normal stresses. Ridges can also exert relatively high forces on offshore structures and icebreakers.
An understanding of ridge building processes and forces is an important component in the study of the movement and deformation of the polar pack in the Arctic basin and the development of models to forecast ice movements. It also has application in the study of pack ice driving forces and the establishment of "limit-force loads" on offshore structures (Croasdale 1984).
Early observations of ridges and ice rubble hummocks were documented by Zubov (1 9 4 3 , and a brief historical account of ridge and ice rubble sightings was given by Kovacs and Sodhi (1980). Some field studies dealt with the statistical distribution of sail heights and keel depths (e.g., Hibler et al. 1972, 1974; Wadharns 1976, 1978, 1983; Weeks et al. 1980; Wadhams et al. 1985; Wadhams and Davy 1986). Others were concerned
with the geometry of ridges and produced typical cross sections of sails and keels (e.g., Weeks et al. 1971; Kovacs 1972; Kovacs et al. 1973; Rothrock and Thorndike 1980; Evers 1986). Results from a number of projects concerning ice ridging in the Canadian Beaufort Sea are presented in the "Beaufort Sea - Mackenzie Delta Environmental Impact Statement" (1982). Tucker and Govoni (198 1) and Tucker et al. (1984) examined ridge sail dimensions and structure in the Alaskan Beaufort Sea. They attempted to correlate sail geometry to ice block dimen- sions and investigated the geographical variations of ridges.
The first analytical study of pressure ridging was conducted by Parmerter and Coon (1972) who developed a kinematical model that apparently produced realistic ridge profiles. Con- tinuum models that consider the deformation of bulk rubble
(Sayed and Frederking 1986) as well as laboratory experiments (Timco and Sayed 1986) showed that the complex processes of ridge formation are not adequately described by the "averaged" idealized profiles. A better description of ridge geometries, particularly newly formed ridges, is still needed to guide the development of analytical models. One of the objectives of the present study was to clarify some of the above uncertainties. Detailed cross-section profiles and ice-block dimensions, as well as longitudinal variations along the ridges have been examined.
The present work also examined characteristics of newly formed ridges in the landfast ice of the Canadian Beaufort Sea. Only very limited and qualitative information about ridges in that region is currently available (Spedding 1982). Records from a number of seasons (Spedding and Hawkins 1985; Beaufort Sea - Mackenzie Delta Environmental Impact State- ment 1982) indicate that the landfast ice edge coincides with the 20 m water depth contour, and that artificial islands do not appear to influence its location. The behaviour of landfast ice, however, remains poorly understood. There are no available models that can predict ice extent offshore or its interaction with artificial islands. Knowledge of ridge properties at various locations can lead to estimates of the magnitude of stresses and deformation and, consequently, guide the modelling of the ice cover.
The site
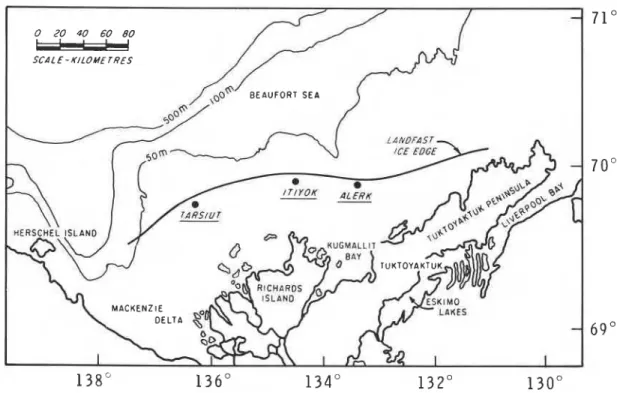
Measurements were conducted from 16 to 25 April 1986 before landfast ice breakup in the vicinity of Tuktoyaktuk. Ice edge location is shown in Fig. 1. The ice extended to approximately 60
km
from shore and was mostly flat with ridgesforming near the outer edge and around artificial island locations. Grounded rubble fields were established over the submerged berms of the islands, which were built as founda- tions for oil exploration caissons during previous winters. An open lead, approximately 30 km wide, was located adjacent to the landfast ice. Pack ice, consisting of numerous multi-year floes imbedded in first-year ice, drifted in a westerly direction beyond the lead.
NOTE: Written discussion of this paper is welcome and will be Surveyed ridges were chosen near the outer edge at various received by the Editor until June 30, 1989 (address inside front cover). distances from the grounded rubble fields. Measurements were
SAYED AND FREDERKING
E A U F O R T S E A
FIG. 1. The outer edge of landfast ice and some of the grounded rubble fields, April 1986.
conducted in the neighbourhood of Tarsiut, Itiyok, and Alerk (shown in Fig. 1) and along the ice edge, covering approximate- ly a 200-km line. One ridge in the pack ice was also included for comparison.
Measurements
Sites of the surveys were chosen where floating ridge sails were prominent during helicopter reconnaissance. Rubble sails higher than 1 m were considered to be ridges and only the maximum heights from each location were measured. Thus, the data represent ridges of extreme sail heights rather than an "unbiased" population of all ridges.
A chain and level survey instrument was used to determine sail cross-section profiles. The instrument consists of a liquid- filled hose and a pressure sensor calibrated to convert pressure difference between cable ends to elevation. Sail cross sections were surveyed by recording the inclined distance and elevation difference between pairs of points along each section. Elevation difference readings were accurate to within k0.01 m (for a range of 5 m), and length readings along the cable to within k0.05 m. This accuracy is adequate since variations in sail dimensions are much larger due to the relatively large block sizes (with the minimum dimension usually larger than 0.3 m). The use of this instrument proved to be considerably faster than the usual level and rod survey method.
For most ridges, two to four sections that appeared represen- tative of its sail were surveyed. In addition, a few ridges were profiled in more detail, taking about 10 sections along the sail's length to examine the longitudinal variation of geometry. Dimensions of several ice blocks were measured at each cross section. A total of 19 ridges was surveyed. This included 76 cross-section profiles and dimensions of 165 ice blocks.
Results Longitudinal variation of sail geometry
Variations in sail height, width, and shape of cross section
along the length of three ridges were examined. Cross-section profiles were spaced at 20-40 m intervals. The first ridge (Itiyok 1) was approximately 600 m long and adjacent to Itiyok rubble field. The second ridge (Itiyok 2), located 8 km west of Itiyok rubble field, traversed 300m along a meandering path with waves of approximately 60 m length and 30 m amplitude. The third ridge formed in first-year pack ice during two ice failure events along the boundary of a multi-year floe and had a total length of approximately 4 km. Cross sections covering a 2 km length of that ridge were surveyed.
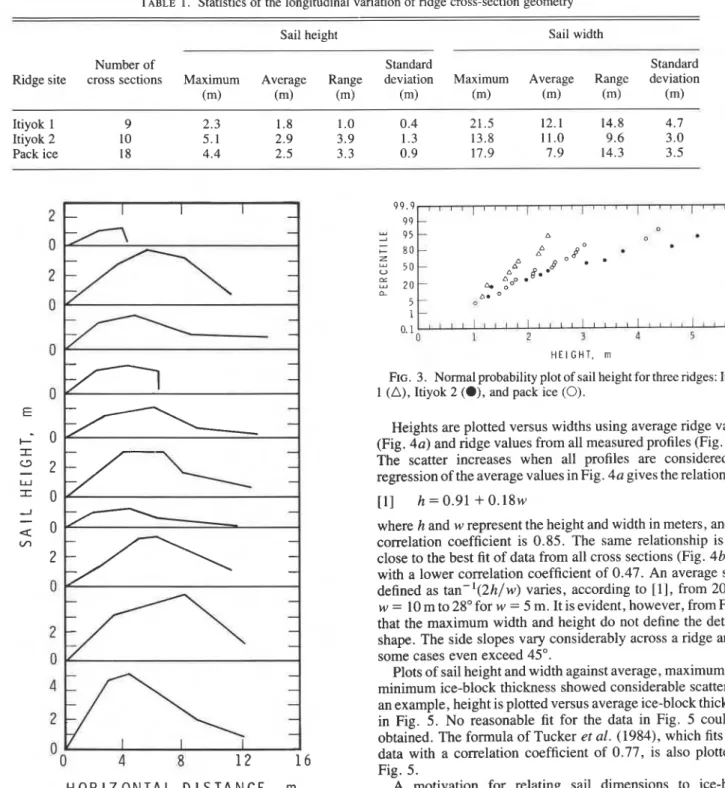
Examples of 10 sail profiles from the ridge "Itiyok 2" are shown in Fig. 2. These profiles clearly show the variability in height, width, and shape along the length of the ridge. Irregularity of the shapes is likely caused by the relatively large size of blocks compared to sail size.
The cross sections were surveyed between the intact, and nearly flat, ice sheets on both sides of the sail. Elevation of those ice sheets were usually different at the opposite sides of the sail (see Fig. 2). The direction of such
an
elevation difference (up or down) was maintained along the length of all ridges. The ice sheets probably tended to deflect upwards on one side of the ridge and downwards on the other side during ridge formation. Local modes of failure (e.g., bending or buckling), however, varied considerably along the length of a ridge.Summary statistics of sail height and width for each ridge are given in Table 1. Height values were relatively clustered around the average while width values showed more scatter. The heights may fit normal probability distributions as shown in Fig.
3. The number of points is too small, however, to obtain valid
quantitative measures of goodness of fit. The widths do not appear to fit such distributions.
It should be emphasized that observed sail geometries were not two-dimensional. In addition to changes of cross-section profiles, ridges usually followed irregular and sometimes meandering paths. Only a few ridges had axes that followed nearly straight lines.
18 CAN. J. CIV. ENG. VOL. 16, 1989
TABLE 1 . Statistics of the longitudinal variation of ridge cross-section geometry
Sail height Sail width
Number of Standard Standard
Ridge site cross sections Maximum Average Range deviation Maximum Average Range deviation
(m) (m) (m) (m) (m) (m) (m) (m)
Itiyok 1 9 2.3 1.8 1 .O 0.4 21.5 12.1 14.8 4.7
Itiyok 2 10 5.1 2.9 3.9 1.3 13.8 11.0 9.6 3.0
Pack ice 18 4.4 2.5 3.3 0.9 17.9 7 . 9 14.3 3.5
H O R I Z O N T A L D I S T A N C E ,
m
FIG. 2. Sail cross-section profiles of the ridge "Itiyok 2," spacing of the sections varies form 20 to 40 m.
Sail cross-section geometry
Two approaches are used to characterize sail geometries. The first examines the height and width measured at each surveyed cross section. For relatively long ridges, cross-section geometry can vary appreciably along the ridge's length as illustrated above. This variation permits the use of a large number of profiles (although more weight would be given to ridges that were surveyed in detail). The second approach employs the average values of height and width for each ridge and thus gives equal weight to all ridges.
H E I G H T , m
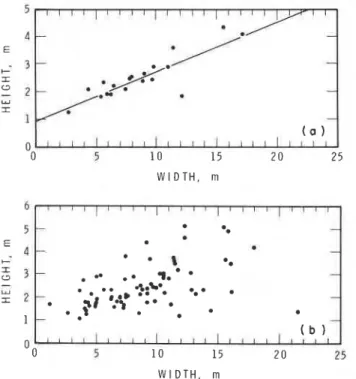
FIG. 3. Normal probability plot of sail height for three ridges: Itiyok 1 (A), Itiyok 2
(a),
and pack ice (0).Heights are plotted versus widths using average ridge values (Fig. 4a) and ridge values from all measured profiles (Fig. 4b). The scatter increases when all profiles are considered. A regression of the average values in Fig. 4a gives the relationship
where h and w represent the height and width in meters, and the correlation coefficient is 0.85. The same relationship is also close to the best fit of data from all cross sections (Fig. 4b) but with a lower correlation coefficient of 0.47. An average slope defined as tan-'(2hlw) varies, according to [I], from 20" for
w = 10 m to 28" for w = 5 m. It is evident, however, from Fig. 2
that the maximum width and height do not define the detailed shape. The side slopes vary considerably across a ridge and in some cases even exceed 45".
Plots of sail height and width against average, maximum, and minimum ice-block thickness showed considerable scatter. As an example, height is plotted versus average ice-block thickness in Fig. 5. No reasonable fit for the data in Fig. 5 could be obtained. The formula of Tucker et al. (1984), which fits their data with a correlation coefficient of 0.77, is also plotted in Fig. 5.
A motivation for relating sail dimensions to ice-block thickness has been the hypothesis that ridge height should be proportional to the force in the ice cover during the ridging process. The force in turn can be related to ice thickness. Thus, sail height would depend on the thickness if the driving forces act on the ice cover for relatively long periods. Since the forces on the ice cover may act intermittently or over relatively short periods, many ridges may not attain the maximum possible dimensions. Ice blocks also had several thicknesses in most sail cross sections, indicating that blocks originated from a number of ice sheets. Ice of the original sheets may have different mechanical properties. Therefore, a simple dependence of force on ice thickness may not exist. Failure modes during ridge formation are complex, which may contribute to the lack of a clear dependence of sail dimensions on ice thickness.
SAYED AND FREDERKING 19
-0 5 1 0 15 2 0 25
W I D T H , m H E I G H T , m
6 FIG. 6. Lognormal plot of sail heights.
O 0 5 1 0 15 2 0 25
W I D T H , m
FIG. 4. Height versus width: ( a ) average values of ridges and showing the best linear fit; ( b ) values measured at all cross sections.
5
.
TUCKER et a1.(19841.
0 . ..
'n 1
-
" 0 0.5 1. 0 1.5 2.0
I C E - B L O C K T H I C K N E S S , m
FIG. 5 . Sail height versus average block thickness. The curve-fit equation of Tucker et al. (1984) is also plotted ( h = 3 . 7 1 f i ) . Statistics of sail dimensions
Heights (measured at all surveyed cross sections) in landfast and pack ice follow a lognormal distribution as shown in Fig. 6. The mean height is 2.43 m, the standard deviation is 0.94 m, and the maximum is 5.09m. In spite of the reasonable correlation between height and width, attempts to fit width measurements to a number of statistical distributions were unsuccessful. The widths have an average of 8.87 m, a standard deviation of 3.93 m, and a maximum of 22 m. The standard values of the skewness and kurtosis coefficients are 3 . 3 and 0.6 respectively. A few large values near the maximum, as confirmed by the positive skewness coefficient, caused the deviation from normal and lognormal distributions. The small value of the kurtosis coefficient (a value of 3 corresponds to a normal distribution) indicates that the width probability distri- bution is relatively flat (of low "peakedness" compared to a normal distribution).
Although the ratios of mean to standard deviation are close for height and width values, the range of widths is relatively large (owing to a few large values). This observation may be explained by considering the following possible, albeit specula- tive, scenario of ridge formation. An early or "primary" stage of
ridging may correspond to a steady force acting on the ice cover and relatively uniform failure. The central part of a cross section, which usually includes the maximum height, will form during such a stage. Another "final" stage that corresponds to a decreasing force and nonuniform (or sporadic) failure of ice may follow. This later stage would not affect the maximum heights of a ridge, but may increase the width values at some locations, thus increasing their scatter.
As only sails higher than 1 m were measured, the measure- ments represent ridges of extreme heights in the region under study. An unbiased sample of all ridges might follow a different distribution. A large number of small ridges in such a case may lead to an exponential distribution of heights.
The only published data on landfast ice ridges for the present location were given by Spedding (1982). Heights were not fitted to statistical distributions, but the maximum values are in agreement with the present measurements. Kreider and Thor (1981) examined ridge height statistics in the neighbouring nearshore Alaskan Beaufort Sea. The heights followed a negative exponential distribution and the measured maximums were close to the present values.
Geographical distribution of ridges
Some qualitative observations regarding the geographical distribution of ridges can be made, although no measurements of ridge spacing or density were performed. Most of the ridges were located near the edge of landfast ice. The ice cover surface was flat, with no ridgesand only a few cracks, closer to shore. The number of ridges seemed to increase near grounded rubble fields that were close to the landfast ice edge.
Average sail height and width at various locations are given in Table 2. Heights showed a small increase towards the west along the outer edge of the landfast ice. There is no definitive explanation for this trend.
Ice-block dimensions
Dimensions of reuresentative ice blocks were measured at all cross sections. The frequency histogram of the thickness values is shown in Fig. 7. The average is 0.57 m, the standard deviation is 0.36 m, and the maximum is 1.70 m. The standard coeffic- ients of skewness and kurtosis are 4.28 and 0.87 respectively, which indicates that some relatively large thicknesses were present and that the distribution is flat (compared to a normal distribution). Since ice cover thickness usually ranges from 1.75 to 2 m at that time of year, it can be concluded that ridges formed either in the thinner ice of frozen leads or earlier in the winter.
Attempts to determine the statistical distribution of thickness values did not lead to a satisfactory result. For example, testing the goodness of fit of a normal distribution gave a X 2 value of
20 CAN. J. CIV. ENG. VOL. 16. 1989
I
TABLE 2. Geographical distribution of sail dimensions Location Average height Average width (listed from west to east) (m) (m) 1.5 km west of Tarsiut 300 m west of Tarsiut At Tarsiut 15 km east of Tarsiut 65 km east of Tarsiut 1 1 km west of Itiyok 8 km west of Itiyok At Itiyok 20 km west of Alerk 3 km west of Alerk At Alerk (near ice edge)
At Alerk (near the grounded rubble) Pack ice
B L O C K T H I C K N E S S , m
FIG. 7 . Histogram of ice-block thickness.
B L O C K T H I C K N E S S , m
FIG. 8 . Block length versus block thickness. Best linear fit (eq. [2]) and cantilever failure values (eq. [3]) are also shown.
35.3, with 15 degrees of freedom. The corresponding probabili- ty is 0.002, i.e., the fit is poor.
Block dimensions are correlated below to give a quantitative description of block geometry and some insight into failure modes. Block length (l), taken as the largest dimension, is plotted versus thickness (t) in Fig. 8. Linear regression gives the relationship
where dimensions are in meters and the correlation coefficient is
O O 2 4 6 8 10
B L O C K L E N G T H , m
FIG. 9. Block width versus block length. Best linear fit is shown.
0.69. Tucker et al. (1984) observed comparable values. They
calculated the characteristic length of the floating ice sheet and the length corresponding to maximum bending moment (con- sidering the case of a beam on elastic foundation) and found them both larger than the measured block lengths. A possible reason for this discrepancy, proposed by Tucker et al. (1984), is that further breaking of the blocks took place after initial failure of the ice sheet.
Failure of a beam on an elastic foundation (representing a floating ice sheet) would result in block lengths proportional
to (see, for example, Hettnyi 1946). Since ice blocks
apparently experienced further breaking, a simple scenario of block formation may be that of a cantilever beam failing under its own weight. In this case, block length would be proportional
to and the flexural strength of ice. Considering a specific
gravity of 0.9 and a flexural strength of 300 kPa for ice, the following relationship is obtained:
[3] 1 = 2.38toa5
where dimensions are in meters. The resulting values are close to those given by the linear fit in [2] for the present range of block dimensions. Therefore, block failure under its own weight may have occurred. This, however, does not exclude the possible occurrence of other more complex modes of block breakage inside the deforming bulk rubble.
Block width (b) is plotted versus length (I) in Fig. 9. Linear
regression gives
where dimensions are in meters and the correlation coefficient is 0.86. At present there is no hypothesis regarding the three- dimensional failure modes that can account for the above ice-block dimensions.
Conclusions
Ice ridging is a complex phenomenon that remains poorly understood. Only a few rudimentary analytical models of ridging are currently available. No theory thus far can ade- quately predict ridge geometry and ridging forces in the ice cover. The present study gives a detailed description of sail geometry statistics, although no physical or theoretical explana- tion for many of the empirical results is available.
The measurements were conducted in the southern Beaufort Sea. Sails of extreme heights were sampled along a 200-km length of the outer edge of the landfast ice, particularly near grounded rubble fields. Cross-section profiles and ice-block dimensions were measured along the sampled ridges.
Heights, measured at all ridges, followed a lognormal distribution with an average of 2.43 m. The maximum measured
SAYED AND FREDERKING 21 height was 5 . 0 9 m . Width values did not fit any distribution and
had an average of 8 . 8 7 m and a maximum of 22 m . Sail heights appeared to increase near grounded rubble fields and there was a
trend of slight height increase towards the west.
Geometry of cross-section profiles was irregular, and the maximum height at a cross section could not be correlated t o block thickness. T h e height, however, can be correlated to the width.
Measurements along individual ridges showed that heights of a ridge followed a normal distribution, with little scatter around the average, but widths d o not fit a statistical distribution and were more scattered.
Ice-block thicknesses (at a n average of 0 . 5 7 m ) were much smaller than the surrounding ice thickness (1.75-2 m). This indicates that ridges probably formed in ice from refrozen leads o r in early winter. Block lengths were correlated t o thicknesses and widths. T h e lengths were smaller than the values expected from initial ice sheet failure. Further breaking of the blocks, possibly under their o w n weight, must have occurred.
This study dealt only with sail geometry. Keels were not examined because of the difficulty and expense of conducting underwater measurements. Further study of keel properties is still needed. T h e observed geometries represent the final outcome of many complex processes of ice failure. They d o not definitively reveal the manner in which ridges form o r give direct estimates of forces in the ice cover. The preceding results can be used to verify the predictions of ridging models and as
input for studies of ridge interaction with offshore structures and landfast ice cover behaviour.
Acknowledgements
T h e support provided by the Polar Continental Shelf Project is gratefully acknowledged. Valuable assistance in the field was provided by P . Anhorn, Technical Officer, National Research Council of Canada.
This paper is a contribution from the Institute for Research in Construction, National Research Council of Canada.
BEAUFORT SEA - MACKENZIE DELTA ENVIRONMENTAL IMPACT STATEMENT. 1982. Volume 3A Submitted to the Environmental Assessment Review Panel, available at the Arctic Institute of North America, University of Calgary, Calgary, Alta.
CROASDALE, K. R. 1984. The limiting driving force approach to ice loads. Offshore Technology Conference, Houston, TX, Paper No. 4716.
EVERS, K.-U. 1986. Geometrie und konsolidierungsgrad der von "Polarstern" durchbrochenen presseisriicken. Chapter 13, Schluss- bericht Band 111. In Erste eisbrechtechnische expedition mit F. S.
Polarstern. Edited by J. Schwarz. Report to Bunderministerium fiir Forschung und Technologie by Hamburgische Schiffbau Versuch- sanstalt and Germanischer Lloyd, Hamburg, West Germany. H E T ~ N Y I , M. 1946. Beams on elastic foundations. The University of
Michigan Press, Ann Arbor, MI, p. 225.
HIBLER, W. D., 111, WEEKS, W. F., and MOCK, S. J. 1972. Statistical aspects of sea ice ridge distributions. Journal of Geophysical Research, 77: 5954-5970.
HIBLER, W. D., 111, MOCK, S. J . , and TUCKER, W. B., 111. 1974. Classification and variation of sea ice ridging in the western Arctic Basin. Journal of Geophysical Research, 79: 2735-2743.
K o v ~ c s , A. 1972. On pressured sea ice. In Sea ice. Edited by T.
Karlsson. National Research Council of Iceland, Roykjavik, Ice- land, pp. 276-295.
K o v ~ c s , A . , and SODHI, D. S. 1980. Shore ice pile-up and ride-up: field observations, models, theoretical analyses. Cold Regions Science and Technology. 2: 209-288.
K o v ~ c s , A., WEEKS, W. F., ACKLEY, S. F., and HIBLER, W. D., 111. 1973. Structure of multi-year pressure ridge. Arctic, %(I): 22-3 1. KREIDER, J. R., and THRO, M. E. 1981. Statistical techniques for the analysis of sea ice pressure ridge distributions. Proceedings of the 6th International Conference on Port Ocean Engineering Under Arctic Conditions, Quebec, Vol. 2, pp. 789-798.
PARMERTER, R. P., and COON, M. D. 1972. Model of pressure ridge formation in sea ice. Journal of Geophysical Research, 77: 6565-6575. ROTHROCK, D. A., and THORNDIKE, A. S. 1980. Geometric properties
of the underside of sea ice. Journal of Geophysical Research, 85: 3955-3963.
SAYED, M., and FREDERKING, R. M. W. 1986. On modelling of ice pressure ridges. Proceedings, International Association for Hydrau- lic Research (IAHR) Ice Symposium, Iowa City, I A , Vol. 1, pp. 603-614.
SPEDDING, L. G. 1982. Rule of thumb ridge height distributions. In
Proceedings of Workshop on Sea Ice Ridging and Pile-up. Compiled by R. M. W. Frederking andG. R. Pilkington, Associate Committee on Geotechnical Research, National Research Council of Canada, Ottawa, Ont., Technical Memorandum 134, pp. 62-82.
SPEDDING, L. G., and HAWKINS, J. R. 1985. A comparison of the effects of natural meteorological conditions and artificial islands on regional ice conditions in the Beaufort Sea. Proceedings of the 8th International Conference on Port Ocean Engineering Under Arctic Conditions, Narssarssauq, Greenland, Vol. 1, pp. 305-315. TIMCO, G. W., and SAYED, M. 1986. Model tests of the ridge-building
process in ice. Proceedings, International Association for Hydraulic Research (IAHR) Ice Symposium, Iowa City, Vol. 1, pp. 591-602. TUCKER, W. B., 111, and GOVONI, J. W. 1981. Morphological
investigations of first-year sea ice pressure ridge sails. Cold Regions Science and Technology, 5: 1- 12.
TUCKER, W. B., 111, SODHI, D. S., and GOVONI, J. W. 1984. Structure of first-year pressure ridge sails in the h d h o e Bay region. In The
Alaskan Beaufort Sea: Ecosystems and Environments. Edited by P. W. Barnes, D. M. Schell, and E. Reimnitz. Academic Press, New York, NY, pp. 115-135.
WADHAMS, P. 1976. Sea ice topography in the Beaufort Sea and its effect on oil containment. Arctic Ice Dynamics Joint Experiment (AIDJEX) Bulletin, No. 33, pp. 1-52, Division of Marine Resourc- es, University of Washington, Seattle, WA.
1978. Characteristics of deep pressure ridges in the Arctic Ocean. Proceedings of the 4th International Conference on Port Ocean Engineering Under Arctic Conditions. Edited by D. B. Muggeridge. Memorial University of Newfoundland, St. John's, Nfld., Vol. I , pp. 544-555.
1983. The prediction of extreme keel depths from sea ice profiles. Cold Regions Science and Technology, 6: 257-266. WADHAMS, P., and DAVY, T. 1986. On the spacing and draft
distributions for pressure ridge keels. Journal of Geophysical Research, 91: 10697-10708.
WADHAMS, P., MCLAREN, A. S . , and WEINTRAUBR. 1985. Ice thickness distribution in Davis Strait in February from submarine sonar profiles. Journal of Geophysical Research, 90: 1069-1077. WEEKS, W. F., KOVACS, A., and HIBLER, W. D., 111. 1971. Pressure
ridge characteristics in the arctic coastal environment. Proceedings of the 1st International Conference on Port Ocean Engineering Under Arctic Conditions, Technical University, Trondheim, Vol. 1, pp. 33-35.
WEEKS, W. F., TUCKER, W. B., 111, FRANK, M., and FUNGCHAROEN, S. 1980. Characterization of the surface roughness and floe geometry of the sea ice over the continental shelves of the Beaufort and Chukchi seas. In Sea ice processes and models. Edited by R. S. Pritchard. University of Washington Press, Seattle, WA, pp. 300-312.
ZUBOV, N. N. 1945. Arctic ice. Izdatel'stvo Glavsevmorputi, Mos- cow, U.S.S.R. (Translation AD 426972, National Technical Infor- mation Service, Springfield, VA).
![FIG. 8 . Block length versus block thickness. Best linear fit (eq. [2]) and cantilever failure values (eq](https://thumb-eu.123doks.com/thumbv2/123doknet/14271093.490401/8.896.91.473.101.658/block-length-versus-thickness-linear-cantilever-failure-values.webp)
