HAL Id: hal-02890254
https://hal.archives-ouvertes.fr/hal-02890254v2
Submitted on 9 Oct 2020
HAL is a multi-disciplinary open access archive for the deposit and dissemination of sci-entific research documents, whether they are pub-lished or not. The documents may come from teaching and research institutions in France or abroad, or from public or private research centers.
L’archive ouverte pluridisciplinaire HAL, est destinée au dépôt et à la diffusion de documents scientifiques de niveau recherche, publiés ou non, émanant des établissements d’enseignement et de recherche français ou étrangers, des laboratoires publics ou privés.
Effect of microstructure heterogeneity on the damage
resistance of nacre-like alumina: insights from
image-based discrete simulations
Kaoutar Radi, Hassan Saad, David Jauffrès, Sylvain Meille, Thierry
Douillard, Sylvain Deville, Christophe L. Martin
To cite this version:
Kaoutar Radi, Hassan Saad, David Jauffrès, Sylvain Meille, Thierry Douillard, et al.. Ef-fect of microstructure heterogeneity on the damage resistance of nacre-like alumina: insights from image-based discrete simulations. Scripta Materialia, Elsevier, 2021, 191 (15), pp.210-214. �10.1016/j.scriptamat.2020.09.034�. �hal-02890254v2�
Effect of microstructure heterogeneity on the damage resistance of
nacre-like alumina: insights from image-based discrete simulations
Kaoutar Radia, Hassan Saadb,c, David Jauffresa,∗, Sylvain Meilleb, Thierry Douillardb, Sylvain
Devillec,d, Christophe L. Martina
aUniv. Grenoble Alpes, CNRS, Grenoble INP, SIMaP, Grenoble, France bUniversité de Lyon, INSA Lyon, MATEIS CNRS UMR5510, Villeurbanne, France
cLaboratoire de Synthèse & Fonctionnalisation des Céramiques, UMR3080 CNRS-Saint-Gobain, 84306 Cavaillon,
France
dnow with: Université de Lyon, Université Claude Bernard Lyon1, CNRS, Institut Lumière Matière, 69622
Villeurbanne, France
Abstract
Recently, several types of nacre-like materials have been developed using various methods. However, the resulting materials exhibit a significant randomness and defects compared to natural nacre. Therefore, evaluating the influence of these microstructural variations on the material’s mechanical behavior is of high interest for the development of nacre-like materials and their industrial scale-up. In this work, we present an original method that allows the modeling of complex morphology of brick and mortar materials, by combining Discrete Element Method and Electron Backscatter Diffraction images. Using different realistic microstructures we studied the effect of the microstructural variations on crack propagation and damage resistance. The obtained results were compared to the regular microstructure of nacre and showed a non-negligible decrease of mechanical properties.
Keywords: Ceramics, toughness, DEM, nacre, EBSD
Owing to its unique microstructure, nacre, the inner part of some seashells, presents a toughness several orders of magnitude larger than that of its constituents. Using different fabrication tech-niques, scientists succeeded in developing bioin-spired brick-and-mortar nacre-like materials, ei-ther with a ductile [1,2,3,4] or a brittle interface [5,6,7], that provide promising mechanical prop-erties. However, the resulting microstructures, that mimic the brick and mortar architecture of natural nacre, are not as perfect as those pro-duced by seashells and exhibit a significant ran-domness and defects compared to natural nacre. Well-aligned periodic materials can be produced only at larger constituent length scales using
ei-∗Corresponding author
Email address: david.jauffres@grenoble-inp.fr (David Jauffres)
ther manual assembly [8], 3D printing [9] or laser engraving [10]. Reproducing the actual length scale of the biomaterial microstructure is nonethe-less a key point to maximize the bioinspired ma-terial performance [11, 12, 13]. Assessing the in-fluence of hardly avoidable microstructural varia-tions and alignment defects on mechanical behav-ior is thus of high interest for the development of nacre-like materials and their industrial scale-up. Most of the modeling studies conducted on nacre-like materials showed that introducing mi-crostructural variations degrades both strength [15] and toughness [16]. Nevertheless, it has been shown that in some configurations, microstruc-tural variations are beneficial. For example, in ductile crack growth, a non-uniform distribution of obstacles leads to higher toughness than when obstacles are equally distributed [17]. For
nacre-Fig. 1: The five microstructures used in our simulations a) The regular brick and mortar microstructure (M0) used in [14] and a close-up of the overlap region. b) Index quality map resulting from EBSD analysis of a nacre-like alumina sample showing the four images (1-4) that were used in DEM simulations to generate four notched numerical microstructures M1-M4. The dashed white squares highlight the zones ahead of the crack tip used to compute the local microstructure parameters reported in Tab. 2.
like materials, a recent study also suggests that some random variations in the microstructure can improve toughness [18]. All prior modeling stud-ies on the effect of microstructural variations were focused on materials with ductile interfaces and the microstructural variations considered were only the introduction of dispersion on the main mi-crostructural parameters characterizing the regu-lar structure. Also, most of those studies consider that the tablets are rigid, a questionable hypoth-esis in the case of low tablet/interface Young’s moduli contrast [14,6]. Here, we present an orig-inal method that allows modeling more realistic morphology of brick and mortar materials, by
com-bining Discrete Element Method (DEM) and Scan-ning Electron Microscopy (SEM) images from Elec-tron Backscatter Diffraction (EBSD) analysis. We investigate the effect of microstructural variations on crack propagation and damage resistance by analyzing the numerical mechanical response of four different realistic microstructures obtained by compaction and field-assisted sintering (FAST) as compared to a regular, numerically generated, microstructure.
To model crack propagation using realistic mi-crostructures of nacre-like alumina, we combine microscopy images originating from EBSD analy-sis with numerical DEM simulations. The DEM 2
formulation and the sample generation procedure are similar to our earlier study on a Represen-tative Volume Element (RVE)[19]. To model the mechanical behavior of continuous media with DEM, we consider the material as a random packing of spherical particles bonded by cylindrical beams that obey elastic interaction laws together with Rankine fracture criteria [20, 19]. After an in-dividual calibration procedure of the interaction laws for each constituent (tablet and interface) the model has been successfully confronted to ex-isting analytical shear-lag models at the scale of a single RVE [19]. As compared to analytical mod-els or finite element modmod-els the present approach allows fracture and damage processes within both the interfaces and the tablets to be easily accounted for by the fracture criteria at the scale of the DEM bond. Recently, the approach was extended to study crack propagation within a nacre-like mi-crostructure at a larger scale (about a hundred tablets)[14]. A typical packing contains about 1 million particles, the number of particles was cho-sen to get at least three particles per interface to ensure results convergence [19].
Once a random packing of particles has been generated, the second step is the image prepara-tion. The images used are shown in Fig.1. M0 (Fig.1a) is a regular microstructure numerically generated [14], where tablets and interface are perfectly aligned with a constant tablet aspect ratio and interface thickness. The overlap ratio (overlap length L0/ tablet length L) is set to 0.25
i.e. the mean value expected for a random distri-bution of overlaps [14]. Images 1 to 4 are from the EBSD analysis of a nacre-like alumina sample (Fig.1b). The sample was obtained by Field As-sisted Sintering Technique (FAST) with uniaxial pressure [6]. The initial powder is composed of anisotropic alumina platelets, alumina nanoparti-cles and glass-phase precursors (CaCO3, SiO2) [5].
During FAST treatment, the liquid glass assists the sintering and forms with alumina nanoparti-cles the "mortar" between tablets. The relative density of the material is 98 % [6]. The EBSD ac-quisition was performed using an Oxford Instru-ments detector installed on a Zeiss Supra 5S SEM microscope with a step size of 80 nm for the
anal-ysis. In this work we use the index quality map (Fig.1b) that displays an excellent contrast be-tween crystalline lamellae with a good indexing quality (white to light gray) and the amorphous interface material that cannot be indexed (black). The images are binarized and used as a mask on the discrete packings. For each particle in the packing, the color of the voxel geometrically cor-responding to the particle center defines the ma-terial type: tablet or interface. The contact law parameters are then calibrated to reproduce the mechanical behavior of each phase [20,21].
In order to assess the crack extension resis-tance (R-curve) of the microstructures, a Single Edge Notch Tensile (SENT) configuration was used. A notch is introduced in all samples and qua-sistatic tensile tests are applied under periodic conditions along the tablets direction (x axis) to study the evolution of crack propagation and tough-ness. In order to correctly ensure this periodic condition, a thin stripe of homogenized isotropic material is added on the left-side and right-side of the numerical sample. In line with our previ-ous work [14] and analytical models [22] a Young’s modulus ratio of Ei
Et = 0.1 is used with a Poisson’s
ratio of 0.21. Each sample is tested for various values of interface strength Σi while the tablet
strength Σt is set to 4 GPa [12].
The imposed strain is progressively increased along the x periodic axis to propagate the crack through the numerical sample. The tensile stress and the projected crack length are used to com-pute the R-curve or crack extension resistance curve, i.e. the stress intensity factor versus crack length, as detailed in [14]. For each simulation, we determine the crack initiation stress intensity factor (KI)init and the maximum stress intensity
factor (KI)maxover the crack extension resistance
curve [14] and calculate the difference ∆KI =
(KI)max − (KI)init. The crack propagates in a
very small numerical region compared to the real experiment. This means that (KI)max is not
rep-resentative of a typical crack growth toughness. Therefore, ∆KI which represents the initial slope
of the R-curve, is used as a measure of the tough-ening associated with crack propagation.
as-Microstructure Mean tablet aspect ratio (ρ) Tablet volume fraction (φ) Mean tablet orientation M0 14 0.852 90◦ M1 13.48 0.849 87.2◦ M2 13.62 0.852 83.4◦ M3 13.60 0.851 83.1◦ M4 13.52 0.850 86.8◦
Table 1: Microstructural parameters issued from image analysis for the five microstructures (M0-M4).
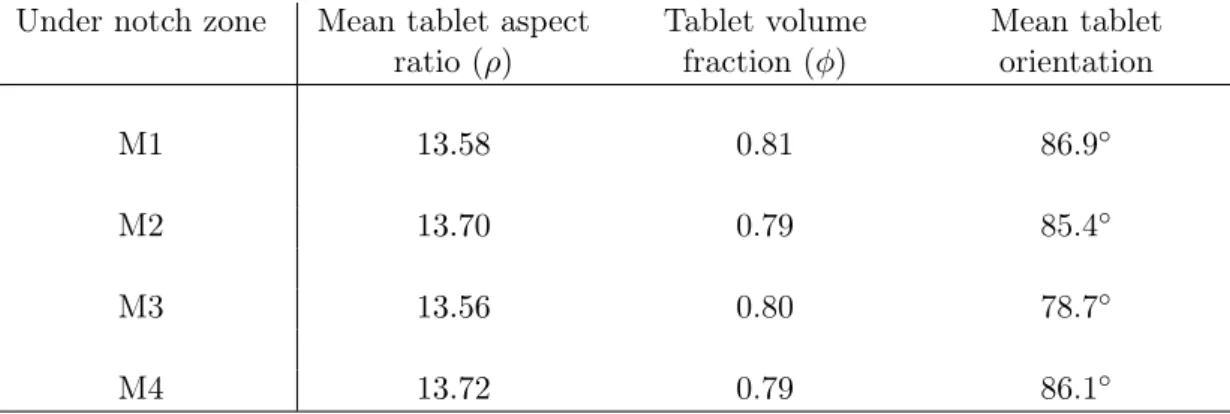
Under notch zone Mean tablet aspect ratio (ρ) Tablet volume fraction (φ) Mean tablet orientation M1 13.58 0.81 86.9◦ M2 13.70 0.79 85.4◦ M3 13.56 0.80 78.7◦ M4 13.72 0.79 86.1◦
Table 2: Microstructural parameters of the region ahead of notch obtained from image analysis for the four microstruc-tures (M1-M4).
pect ratio ρ, volume fraction φ and orientation along the y axis) of each image are quantified us-ing the imageJ plugin Analysis 3D developed by [23]. The microstructure analysis of the images reveals the average values of each microstructure (Tab.1). As the mechanical response in a SENB test is suspected to be influenced by the local fea-tures near the tip of the notch, we selected a 2ax2a sized zone ahead of the notch tip (Fig.1) to com-pute a local value for the microstructural param-eters, reported in Tab.2. In order to ensure that no bias is introduced because of truncated tablets, the total surface of the tablets intersecting the zone is considered for analysis.
Fig.2shows a histogram of the interface thick-ness of the EBSD generated microstructures. It is observed that microstructure M3 has a less ho-mogeneous distribution of the interface thickness with the presence of thick interfaces (500 nm to 700 nm) in contrast to the rest of the
microstruc-Fig. 2: Histogram of interfaces thickness for the EBSD mi-crostructures, showing the occurrence of thicker interfaces in M3.
tures. Some grain growth, that might be pro-moted by thin or nonexistant interfaces, is also noted, especially on M3. Still, the origin of the large tablets is not totally clear as large tablets have also been noticed in the powder i.e. before
sintering.
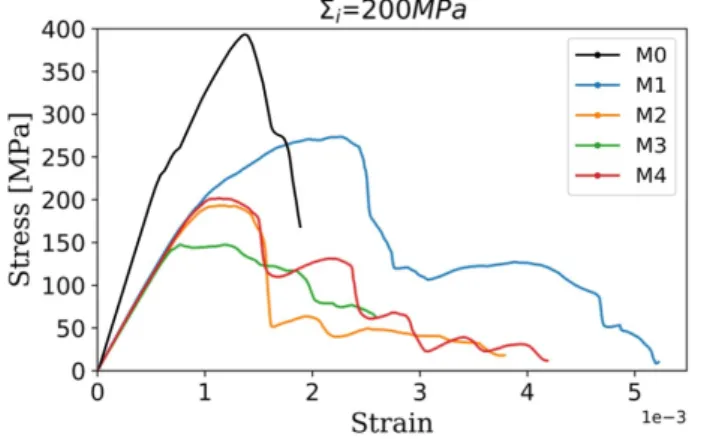
Fig.3 shows an example of the stress-strain evolution before and during crack propagation of the five microstructures for an interface strength Σi = 201Σt = 200 MPa. Stable crack propagation
is observed in the EBSD-generated samples as in the regular microstructure (M0). The deflection noticed on the curve of the regular microstruc-ture M0 that characterizes the simultaneous fail-ure of vertical interfaces is less obvious for the other curves (i.e microstructures M1-4). It cannot be discerned in EBSD-generated microstructures as interfaces are more randomly oriented. After reaching the maximum stress, the curves become rugged, which is coherent with the pulling out of tablets observed in DEM simulations. The lowest and highest values of stress - among the EBSD-generated microstructures (M1-4)- are reached by M3 and M1, respectively.
Fig. 3: An example of stress-strain curves of single edge notched samples for the five microstructures (M0-M4) with an interface strength Σi = 201Σt=200 MPa and a fixed
tablet strength of 4 GPa.
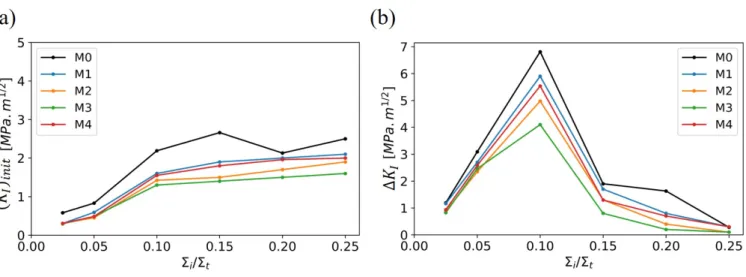
Note that regardless of the interface strength, the ranking of microstructures in terms of max-imum stress remains the same (M0> M1> M4> M2> M3). In Fig. 4a the crack initiation stress intensity factor (KI)initand the crack propagation
toughening ∆KI of the five samples as a function
of interface strengths are compared to the regu-lar sample (M0). Crack initiation stress intensity factor increases in a monotonic manner to reach a maximum value. The regular sample (M0) ex-hibits a (KI)init between 20% to 36% larger than
EBSD-generated microstructures.
In Fig.4b, ∆KI increases to reach an
opti-mum value at Σi = 101 Σt and decreases
after-wards. It is interesting to notice that the opti-mum value of ∆KI is reached at the same
inter-face strength for the regular microstructure (M0) and for the EBSD microstructures (M1-4). Sim-ilarly to crack initiation stress intensity factor, microstructures M2 and M3 exhibit lower crack propagation toughening than the other EBSD-generated microstructures. ∆KI is 15% to 42%
higher for the regular microstructure as compared to the real microstructures from EBSD. The mi-crostructure rankings observed for (KI)initand for
∆KI are the same than for maximum stress i.e.
M0> M1> M4> M2> M3.
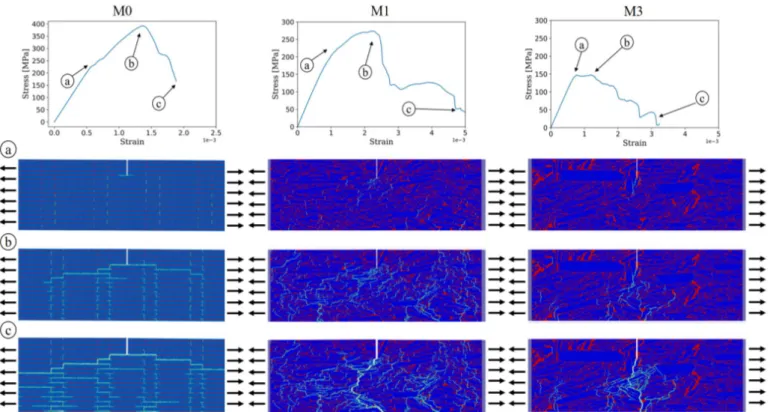
To understand this ranking and the differences showed in Fig.3 and Fig.4, we focus on the crack propagation in microstructures M0, M1 and M3 that lead to extrema in terms of mechanical re-sponse. Fig.5 shows the crack propagation along with the stress-strain plots of microstructures for an interface strength of 200 MPa. Similar rein-forcement mechanisms are noticed in the realistic and regular microstructures. First, microcrack-ing, which is the fracture of vertical or horizon-tal interfaces, participates in stress relaxation at the crack tip. This mechanism helps in preserving reasonable initiation toughness even with weak in-terfaces. By comparing microstructures M1 and M3, it is noticeable that more damage/microcracking is present in M1 prior to crack propagation, while in M3 a smaller number of interfaces are damaged before crack propagation. This logically leads to a higher stress concentration at the crack tip in M3 and lower crack initiation stress intensity factor (Fig.4a).
Typically, when the crack starts propagating in the material through the interfaces, it gets de-flected when encountering a tablet resulting in a non-straight crack pattern (M1). However, in M3, when the crack passes through the interface, it encounters two tablets with a favorable orienta-tion for the crack propagaorienta-tion. This leads to a straighter pattern of the crack. In other words, if the tablet had been better aligned along the x axis direction, the crack would have deviated
to-Fig. 4: a) Crack initiation stress intensity factor (KI)init and b) crack propagation toughening ∆KI of the regular
microstructure (M0) and the EBSD generated microstructures (M1-4) as a function of the normalized interface strength
Σi
Σt.
wards the x axis direction instead of continuing its path along the y axis direction. This contributes to the lower maximum stress (Fig.3) and crack propagation toughening (Fig.4b) reached by this microstructure.
To investigate the microstructural origins of differences in crack propagation and crack exten-sion resistance between samples, we compare the microstructural parameters of the four microstruc-tures. We notice that they have approximately the same tablet volume fraction, both globally (Tab. 1) and locally ahead of the crack tip (Tab.
2). However as seen in Fig 2, microstructure M3 has a less homogeneous distribution with the pres-ence of thick interfaces (500 nm to 700 nm) in contrast to the three other microstructures. The non-homogeneous distribution of interface thick-ness leads to a less homogeneous distribution of the local stress which explains the lower crack ex-tension resistance of those samples.
Tablet misorientation also plays a significant role. Indeed, as crack deviation is one of the jor reinforcement mechanisms in nacre-like ma-terials, a less deviated crack due to poorly ori-ented tablets results into lower crack extension resistance. Tablets in microstructure M1 have an average orientation of 87 ◦to the y axis, while in M3 tablets are oriented 83 ◦to the y axis (Tab.
1). The difference is even more marked for the
local orientation ahead of the crack tip where the average orientation of M3 falls to 79 ◦while M1 orientation stays nearly unchanged. On the con-trary, the noticeable difference in mean tablet ori-entation between M2 and M4 (Tab. 1) fades away locally (Tab. 2). As a consequence, M1 exhibits a better crack extension resistance than M3 while M2 and M4 have a similar behavior.
As we showed in [19], microcracking is another important reinforcement mechanism in nacre-like materials. Inspection of the crack propagation patterns in microstructure M1 indicates more mi-crocracking compared to M3. This can be ex-plained by the presence of thicker interfaces in M3, harder to break. The heterogeneity of in-terface thickness also impacts microcracking by inducing more stress localization which limits the size of the process zone. This demonstrates the possible effect of tablet orientation and interface thickness distribution on the overall behavior of this type of microstructure.
Microstructural variations play an important role in the nacre-like materials behavior. In this paper we introduced a new method to study the damage resistance of synthetic nacre-like materi-als by combining EBSD micrographs and DEM simulations. The simulations showed the impor-tant effect of tablet orientation and interface thick-ness distribution on both crack path and crack 6
Fig. 5: Crack propagation illustrations in microstructures M0, M1 and M3 for a low interface strength (Σi =1/20 Σt=
200 MPa). Stress-strain curves and snapshots of the three main events during SENT a damage initiation, b maximum stress and c sample failure.
extension resistance. A good alignment of tablets participates in the crack deviation which leads to higher crack extension resistance. Moreover, a non-homogeneous distribution of the interface can reduce microcracking and cause the crack to follow a straight path instead of a convoluted one. The results of the simulations performed on the EBSD-generated microstructures were compared to a numerically generated regular microstructure showing a non-negligible decrease of mechanical properties for real EBSD microstructures. Even if, as shown by [18], some of disorder might be beneficial, in the case of real microstructures as investigated here, the disorder is such that more homogeneous microstructures should be sought to improve the material damage resistance. Al-though they provide new valuable qualitative re-sults, a clear limitation of the discrete simulations presented here is that they apply on a much too small volume to yield unambiguous quantitative results. Thus, improvements in computing must be implemented in order to access larger volumes from images. Still, the simulations performed
us-ing EBSD microstructures can provide informa-tion unattainable by experiments and one of the short terms objectives could be the quantification of reinforcement mechanisms such as microcrack-ing and crack deflection in order to gain knowl-edge on their relative importance and quantify their impact on toughness.
Acknowledgements
We acknowledge the technical support of Saint-Gobain. The Agence Nationale pour la Recherche (ANR -16- CE08-0006 BICUIT, program DS0303-2016) and the AGIR-POLE-PEM 2016 project (OMicroN) are greatly acknowledged for their fi-nancial support.
Conflict of interest
The authors declare no conflict of interest.
[1] I. Corni, T. J. Harvey, J. A. Wharton, K. R. Stokes, F. C. Walsh, and R. J. K. Wood, Bioinspiration & Biomimetics 7, 031001 (2012).
[2] U. G. Wegst, M. Schecter, A. E. Donius, and P. M. Hunger, Philosophical Transactions of the Royal So-ciety A: Mathematical, Physical and Engineering Sci-ences 368, 2099 (2010).
[3] E. Munch, M. E. Launey, D. H. Alsem, E. Saiz, A. P. Tomsia, and R. O. Ritchie,Science 322, 1516 (2008), arXiv:NIHMS150003 .
[4] O. Oner Ekiz, A. F. Dericioglu, and H. Kakisawa, Materials Science and Engineering C 29, 2050 (2009). [5] F. Bouville, E. Maire, S. Meille, A. J. Stevenson, and
S. Deville,Nature Materials 13, 1 (2014).
[6] H. Saad, K. Radi, T. Douillard, D. Jauffres, C. L. Martin, S. Meille, and S. Deville,Materialia , 100807 (2020).
[7] M. Muñoz, M. Cerbelaud, A. Videcoq, H. Saad, A. Boulle, S. Meille, S. Deville, and F. Rossignol,
(2020), 10.26434/chemrxiv.12063183.v1.
[8] D. Zhu and F. Barthelat,Conference Proceedings of the Society for Experimental Mechanics Series 2, 181 (2011).
[9] R. Yadav, R. Goud, A. Dutta, X. Wang, M. Naebe, and B. Kandasubramanian,Industrial and Engineer-ing Chemistry Research 57, 10832 (2018).
[10] R. K. Chintapalli, M. Mirkhalaf, A. K. Dastjerdi, and F. Barthelat, Bioinspiration & biomimetics 3 (2014). [11] A. Doitrand, R. Henry, J. Chevalier, and S. Meille, Journal of the American Ceramic Society (2020), 10.1111/jace.17148.
[12] E. Feilden, T. Giovannini, N. Ni, C. Ferraro, E. Saiz, L. Vandeperre, and F. Giuliani, Scripta Materialia 131, 55 (2017).
[13] H. Gao, B. Ji, I. L. Jager, E. Arzt, and P. Fratzl, Pro-ceedings of the National Academy of Sciences 100, 5597 (2003).
[14] K. Radi, D. Jauffres, S. Deville, and C. L. Martin, Composites Part B 183, 107699 (2019).
[15] N. Abid, M. Mirkhalaf, and F. Barthelat,Journal of the Mechanics and Physics of Solids 112, 385 (2018). [16] J. William Pro, R. Kwei Lim, L. R. Petzold, M. Utz, and M. R. Begley, Journal of the Mechanics and Physics of Solids 80, 68 (2015).
[17] A. Needleman and V. Tvergaard, International Jour-nal of Fracture 49, 41 (1991).
[18] N. Abid, J. W. Pro, and F. Barthelat,Journal of the Mechanics and Physics of Solids 124, 350 (2019). [19] K. Radi, D. Jauffrès, S. Deville, and C. L. Martin,
Journal of the Mechanics and Physics of Solids 126, 101 (2019).
[20] R. Kumar, S. Rommel, D. Jauffrès, P. Lhuissier, and C. L. Martin,International Journal of Mechanical Sci-ences 110, 14 (2016).
[21] K. Radi, D. Jauffres, S. Deville, and C. L. Martin, Composites Part B , 107699 (2019).
[22] F. Barthelat, Journal of the Mechanics and Physics of Solids (2014), 10.1016/j.jmps.2014.08.008. [23] V. Boulos, V. Fristot, D. Houzet, L. Salvo, and
P. Lhuissier, in Proceedings of the 2012 Conference on Design and Architectures for Signal and Image Pro-cessing (2012) pp. 1–6.
![Fig. 1: The five microstructures used in our simulations a) The regular brick and mortar microstructure (M0) used in [14]](https://thumb-eu.123doks.com/thumbv2/123doknet/14206090.480968/3.892.203.670.128.696/fig-microstructures-used-simulations-regular-brick-mortar-microstructure.webp)