Publisher’s version / Version de l'éditeur:
ASHRAE Transactions, 96, 1, pp. 896-900, 1990
READ THESE TERMS AND CONDITIONS CAREFULLY BEFORE USING THIS WEBSITE. https://nrc-publications.canada.ca/eng/copyright
Vous avez des questions? Nous pouvons vous aider. Pour communiquer directement avec un auteur, consultez la première page de la revue dans laquelle son article a été publié afin de trouver ses coordonnées. Si vous n’arrivez pas à les repérer, communiquez avec nous à [email protected].
Questions? Contact the NRC Publications Archive team at
[email protected]. If you wish to email the authors directly, please see the first page of the publication for their contact information.
NRC Publications Archive
Archives des publications du CNRC
This publication could be one of several versions: author’s original, accepted manuscript or the publisher’s version. / La version de cette publication peut être l’une des suivantes : la version prépublication de l’auteur, la version acceptée du manuscrit ou la version de l’éditeur.
Access and use of this website and the material on it are subject to the Terms and Conditions set forth at
Joint Canadian/U.S. research project on window performance: Project
outline and preliminary results
Elmahdy, A. H.
https://publications-cnrc.canada.ca/fra/droits
L’accès à ce site Web et l’utilisation de son contenu sont assujettis aux conditions présentées dans le site LISEZ CES CONDITIONS ATTENTIVEMENT AVANT D’UTILISER CE SITE WEB.
NRC Publications Record / Notice d'Archives des publications de CNRC:
https://nrc-publications.canada.ca/eng/view/object/?id=1e7ff2e0-af98-4726-abd7-1ba02e0c9729 https://publications-cnrc.canada.ca/fra/voir/objet/?id=1e7ff2e0-af98-4726-abd7-1ba02e0c9729A N A L Y Z E D
Reprinted from
ASHRAE Transaction
1990
Vol.
96,
R.
1, 5 p.
.(IRC Paper No. 1672)
-NRCC 32340
Se
r
TH
1
N21dno .It32
National Research
Conseil national
c r
1
Council Canada
de recherches Canada
-
-
Institute for
lnstitut de
Research in
recherche en
Construction
construction
Joint
Canadian/U.S. Research
Project on
Window Performance:
Project
Outline
and
Preliminary Results
by
A.H. Elmahdy
Canad3
Un projet de recherche canado-amiricain a
CtC
mis sur pied en 1988 en vue de coordonner
les activitks de recherche menCes dans les deux pays dans le domaine de la performance des
fendtres. La nCcessite d'un tel projet a
CtC
reconnue par de nombreux chercheurs a
l'occasion d'une dunion tenue
A
Ottawa, en Ontario (Canada), en juin 1988.
Ce document est le premier issu de ce projet de recherche en collaboration. I1 expose les
objectifs gCnQaw et presente la premikre drie de dsultats.
Il
contient aussi un n5sumC des
travaux pdvus
pour
la premikre phase du projet.
La sine de rksultats presentee ici consiste en une comparaison entre les coefficients
U
globaux de sept fenttres dCterminCs lors d'essais en laboratoire rCalisCs au moyen d'une
enceinte
B
parois isothermes et les coefficients obtenus par modClisation informatique
B
l'aide des programmes VISION/FRAME et WINDOW3.1/ANSYS. On observe une
concordance assez bonne entre les coefficients
U
globaux des fendtres determinis au
moyen de l'enceinte
?parois isothemes et ceux obtenus par simulation
iti
l'aide des deux
progiciels mentionnes ci-dessus. Par ailleurs, on relkve des differences au niveau des
coefficients U du bord de la vitre et du cadre obtenus par simulation infonnatique.
JOINT CANAD1ANIU.S. RESEARCH PROJECT
ON WINDOW PERFORMANCE: PROJECT
OUTLINE AND PRELIMINARY RESULTS
A.H.Elmahdy,
Ph.D.ABSTRACT
A joint research project between Canada and the U.S. was initiated in 1988 to coordinate research activities on window performance in both countries. The need for such a project was recognized by many researchers at a meeting held in Ottawa, Ontario, Canada in June 1988. This is the first paper resulting from this joint research project. It outlines the overall project objectives and presents the first set of ~ s u l t s . It also provides a summary of the future work planned in the first phase of this project. The set of results presented in this paper is a com- parison of the overall U-value for seven windows obtained for laboratory testing using a guarded hot box and those from two sets of computer modeling using VISION/ FRAME and WINDOW3.1/A NSYS programs. The results indicate a reasonable agreement between the overall U-value of windows determined by guarded hot box measurements and those obtained by simulation using the two computer packages mentioned above. On the other hand, differences exist when comparing the edge of glass and frame U-values resulting from computer simulation.
INTRODUCTION
In a conference sponsored by the Solar Energy Socie- ty of Canada, Inc. (SESCI), and theCanadian Department of Energy Mines and Resources (EMR) (Enermodal Engi- neering Ltd. 1988a), several researchers from Canada and the U.S. working on the performance of fenestrat~on systems met in Ottawa, Ontarlo, Canada, to discuss the research pr~orities in that area. At the end of the meet~ng,
~t became clear that a great deal of research on fenestra- t~on systemsis under way in Canadaand the U.S. The main objective of these research activities is to develop standar- dized procedures for predicting and evaluating the thermal performance of window assemblies. It is worth noting that s~milar activities exist in Europe, where a standard calcu- lation procedure is being developed by the International Standards Organization (ISO) to determine the thermal performance of windows.
The Ottawa meeting recommeded a joint research
project between Canada and the U.S. to coordinate re- search on fenestration systems in both countries. The major funding agencies in Canada and the US.-namely the Department of Energy, Mines, and Resources Canada (EMR) and the U.S. Department of Energy (DOE), in asso- ciation with ASHRAE (TC4.5 Fenestration)-formed a man- agement committee to establish the broad objectives of a joint research project on window performance. In addi- tion, a technical committee was formed, consisting of research organizations, universities, testing agencies, and industry representatives, to perform the work and docu- ment the results.
As a part of Phase I of this project, seven windows were tested by IRCINRCC using the guarded hot box and were also simulated using VISION (Wright and Sullivan 1987)lFRAME (Enermodal 1988b) and WINDOW3.1 (LBL 1988)IANSYS (de Solda and Dorman 1987) computer pro- grams. These windows were selected as an initial set be- cause they were available at a U.S. laboratory and testing was already under way.
In June 1989, the management and technical commit- tees met to discuss the results of the first phase of this project. It was decided in that meeting to present a com- parison between IRC laboratory test results and tne output from the computer simulation using the above-mentioned computer packages.
This paper provides a brief outline of the overall objec- tives of the joint Canadian1U.S. research project on window performance, and a summary of the test and simulation results of the seven windows. The paper also outlines the tasks for the next step in this project. Additional test and simulat~on results of the seven windows land others) will be presented in the future.
PROJECT OBJECTIVE AND GOALS
The management committee, in consultation with the technical committee, has developed a statement outlining the overall project objective, which is to establish technically correct and unbiased procedures to evaluate and compare the energy performance of various types of windows. Initial- ly, the scope of th~s project is restricted to the thermal and optical properties of factory-assembled window units for use
A.H. Elmahdy is a Senior Research Officer, Institute for Research in Construction, National Research Council of Canada, Ottawa.
THIS PREPRINT IS FOR DISCUSSION PURPOSES ONLY, FOR INCLUSION IN ASHRAE TRANSACTIONS 1990. V. 96. Pt. 1. Not to be reprinted in whole or in part without written permission of the American Soc~ety of Heating. Refrigerating and AirGondition~ng Engineers. Inc.. 1791 Tullie Circle, NE. Atlanta. GA 30329. Opinions. findings, conclus~ons, or recommendations expressed in th~s paper are thoseof the author(s) and do not necessar~ly reflect the views of ASHRAE.
in residential and commercial buildings. In the future, it is expected that the scope will be expanded to include skylights, curtain walls, and other complex glazing systems.
The short-term goals of this project are:
1. to develop validated calculation procedures to deter- mink the thermal and optical properties of windows, in- cluding the center of glass, glass edge and frame, and the overall window assembly.
2. to correlate the calculation procedures, field testing, and laboratory tests and establish the magnitude of er- rors associated with these tests and calculation procedures.
3. to identify the research required to expand the initial priorities addressed (i.e., thermal performance and op- tical properties) to cover other issues such as durabili- ty, installation, operation, etc.
4. to improve the existing measurements and calculation procedures and to reduce the uncertainty levels in these methods.
5. to compare research laboratory test results with current commercial laboratory test results.
6. to develop design tools, handbooks, and other informa- tion required by architects and building and window designers and to generate window thermal and optical data to meet their selection and design needs.
The long-term goals of this project include:
1. the development of evaluation proceduresfor determin- ing the energy performance of complex window systems including skylights and curtain walls.
2. the development of a procedure for evaluating the long- term performance of complex window systems which includes installation, durability, and operation.
3. the development of advanced design tools that address complex window systemsfor commercial buildings and production of optimized designs based on trade-offs between cooling, heating, lighting, and non-energy- related benefits.
SAMPLES, TEST PROCEDURE, AND SIMULATION
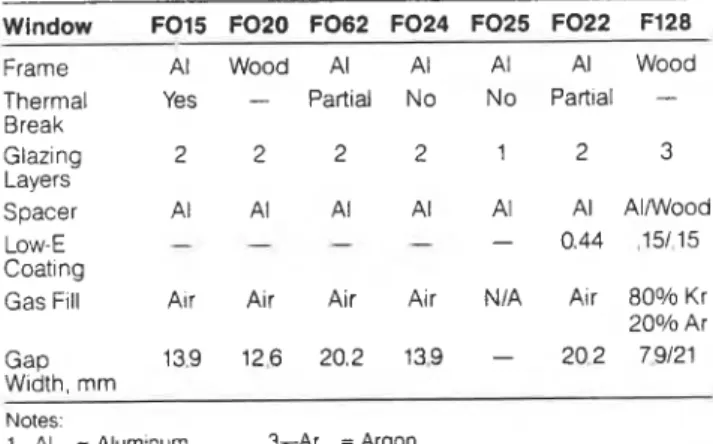
As indicated earlier, seven windows were sele$ted for testing and modeling because they were readily available at a U.S. laboratory. Table 1 gives a summary descrtption of the seven units, and Figure 1 shows a schematic dia- gram of the cross section of each unit.
TABLE 1 Summary Description of the Windows Tested
Window F015 FO2O F062 F024 F025 F022 F128
Frame Al Wood Al Al Al Al Wood Thermal Yes
-
Part~al No No Part~al-
Break Glaz~ng 2 2 2 2 1 2 3 Layers Spacer Al Al Al A1 Al A1 AllWood Low E-
-- -
- 0.44 15/15 Coat~ngGas Fill Air Air Air Air NIA Air 80% Kr 20% Ar Gap 139 126 20.2 13.9 - 20 2 7.9121 W~dth, mm
Notes
1-Al = Alurntnurn 3-Ar = Argon
2-Kr = Krypton 4-All units are 910 mrn w~de x 1213 mrn high
5.' -7
tt-
I
Figure I A schematic diagram showing the cross section of the seven windows (in mm)
The selected windows range from a thermally poor unit (#F025, single-glazed, aluminum frame without a ther- mal break) to an advanced unit (#Fl28, triple-glazed, wood frame, kryptonlargon filled, with two low-emissivity coatings on the glass). The other windows are: double-glazed, alu- minum frame with partial thermal break (#F062) and a similar unit with lwemissivity coating on the glass (#F022); double-glazed, aluminum frame with thermal break (#
F015);
double-glazed, aluminum frame, and aluminum spacer without a thermal break (#F024); and double- glazed, wood frame, aluminum spacer (#F020).All units were tested using the guarded hot box. Details about the test facility and the test procedure are documented in Bowen (1985). In the hot box test facility, temperatures are measured within +O.l°C and the power input is accurate within k0.3 W. The uncertainty level in the calculated heat flow through the sample is k0.01%, and the thermal resistance of the mask wall is calculated within +0.011 m2. KIW. Finally, the overall uncertainty level associated with the hot box measurements is *6% of the calculated overall U-value (Elmahdy 1988).
The units were also simulated using the VISION1 FRAME and WINDOW3.1lANSYS combinations. VISION is a computer program developed to evaluate the thermal performance of innovative glazing systems. FRAME is a computer program developed to determine the thermal characteristics of window frames. WINDOW3.1 is a com- puter model developed for analyzing the heat transfer through window systems, and ANSYS is a finite element program to calculate two-dimensional heat flow.
The data produced by VISIONIFRAME were prepared
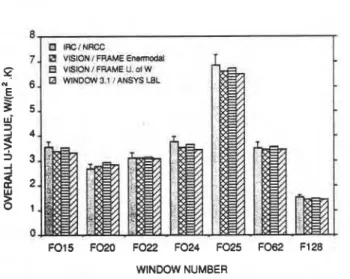
FOlS FOM F022 F024 F025 F062 F128
WINDOW NUMBER
Figure 2 Comparison of overall U-value
the data produced by WINDOW3.1lANSYS were prepared by a U.S. laboratory (Reilly and Arasteh 1989).
RESULTS
For comparison purposes, all units were tested (or simulated) under the following conditions:
-room-side temperature, 21°C . -weather-side temperature, -18OC -room-side film coefficient, 8.3 Wl(m2 K)
(natural convection)
-weather-side film coefficient, 30 Wl(m2. K) (forced convection)
TABLE 2 Summary of Test and Simulation Results U-value of the Overall Window, Wl(m2-K)
IRCINRCC Enerrnodal U. of W U.S. Lab Window (hot box) VISION1 VISION1 WINDOW3.11
FRAME FRAME ANSYS
F015 3.55 3.37 3.52 3.32 F020 2.70 2.8 2.93 2.84 F022 3.12 3.10 3.14 3.09 F024 3.75 3.53 3.65 3.43 F025 6.85 6.61 6.72 6.48 F062 3.51 3.43 3.57 3.45 F128 1.54 1,44 1.49 1.45 F15 FZO F22 F24 F25 F62 F128 WINDOW NUMBER
Figure 4 Comparison of edge-of-glass U-value
WINDOW NUMBER
Figure 3 Comparison of center-of-glass U-value
Table 2 and Figure 2 give a summary of the overall U- value of the windows determined by testing and simulation, as reported by the participants.
The breakdown of the U-value into components for center of glass (U,,), edge of glass (U,,), and frame (U,) was determined only by simulation. Values of U,,, U,,, and U, are given in Tables 3,4, and 5. The comparison of the U-values of the various components is shown in Figures 3, 4, and 5.
As mentioned earlier, the uncertainty level associated with the overall U-value obtained from the hot box mea- surements is &6%. It is, however, difficult to determine the uncertainty levels associated with component modeling because of the various possible sources of errors in win- dow simulation.
The major sources of error in the simulation may be due to approximations in the algorithms, inaccurate model- ing of the window and component profiles, and/or the use of different values for the same material property. For example, the thermal conductivity of materials used in the windows is usually supplied by the manufacturers. However, in some cases, researchers have assigned dif- ferent thermal conductivity values to the same material (see Table 6).
WINDOW NUMBER
TABLE 3
Summary of the Center-of-Glass U-value (U,,), Wl(m2 K)
Window # U. of W Enennodal U.S. Lab
F015 2.94 2.93 2.85 F020 2.94 2.93 2.86 F022 2.41 2.53 2.46 F024 2.96 2.96 2.85 F025 6.5 6.49 6.36 F062 2.96 2.95 2.88 F17A 0 95 0.94 0.89
Finally, another possible source of error in the com- puter modeling is the different criteria for convergence used in each program in the computation when multiple iteration is used.
DISCUSSION
The summary of the overall U-values of windows (shown in Table 2 and Figure 2) indicates that there is a good agreement between the test results (using the IRC hot box) and the computer prediction (for both computer combinations). Based on the limited number of units tested, the largest deviation in the simulation results is about 5% relative to an average U-value of a given unit (an average of four values for each unit).
As indicated earlier, component U-values were obtain- ed only by simulation. Good agreement exists between the VISIONIFRAME and WINDOW3.1lANSYS results for the center-of-glass U-values (U,,), as shown in Figure 3 and Table 3. On the other hand, some differences exist when comparing the results for edge-of-glass and frame U- values (U,, and U,, respectively)., For example, the largest deviation of U,, is about 8% of the average value calcu- lated for a given unit (an average of three simulation results). In the case of the frame U-value comparison, the largest deviation is about 10% of the average value for a given unit.
The edge-of-glass U-value, U,,, is calculated assum- ing a rectangular strip 64 mm wide from the sight line or frame edge. Comparison of U, values (shown in Table 4 and Figure4) shows that for the high-performance window (unit #F128) the results of both computer models are in good agreement, whereas differences exist for the other windows. Such differences may be due to inaccurate cal- culations of the heat transfer through the edge of glass, the assumed width of the edge, the use of different thermal properties of materials, andlor the use of different criteria for convergence in the iterative process. The "effective" edge-of-glass area may be ascertained experimentally by temperature mapping of the glass surface. It is expected that this area would vary according to the spacer and frame materials as well as the glazing system. Also, the thermal properties of materials used in making windows
TABLE 5
Summaw of the Frame U-value (UJ, Wl(m2.K)
Window # U. of W Enennodal U.S. Lab
TABLE 4
Summary of the Edge-of-Glass U-value (U,), W/(m2-K)
Window # U. of W Enennodal U.S. Lab
F015 3.59 3.74 3.24 F020 3.44 3.08 3.34 F022 3.09 3.29 2.97 F024 3.17 3.30 3.26 F025 6.44 6.82 6.28 F062 3.31 3.61 3.30 F128 1.23 1.22 1.20
may be determined more accurately by measurements us- ing a guarded hot plate apparatus.
In summary, the results of the computer simulations are in good agreement with each other. However, notice- able differences exist when comparing the frame and edge-of-glass U-values, as shown in Figures 4 and 5 and Tables 4 and 5. A number of possible reasons explain these differences:
1. there is a certain degree of approximation in evaluating U, using VISIONIFRAME programs because the heat flow through the frame isdetermined manually from the constant heat flow lines generated by the FRAME program.
2. the frame profile is modeled by the user, and curved profiles are either fitted into several rectangular sections or approximated by a single rectangular section. 3. as indicated earlier, the thermal and optical properties
of the materials used in making windows are usually provided by the manufacturers. Some of these proper- ties were not available to the programmers when the windows were modeled. As a result, for some materials, different values were assigned by the programmers to the same material.
4, the procedures used to calculate heat transfer in the FRAME and ANSYS programs are different. FRAME uses the finite difference method, whereas ANSYS uses the finite element technique.
FUTURE WORK
The results presented in this paper represent an initial step in the validation of two computer models to determine the thermal performance of windows. It is also intended to check on the accuracy of simulation when dealing with a very high U-value window (single-glazed, aluminum frame without thermal break, unit #F025), and a low U-value win- dow (triple-glazed, krypton-filled with low-emissivity coatings on the glass, unit #F128).
As a part of Phase I of the joint Canadian1U.S. research project, it is planned to compare the test results of various research laboratories and a commercial U.S. testing lab (using the AAMA test procedure). Most of the testing has already been performed, and a summary report will be prepared to document the results.
It is also planned to validate the computer programs using another set of windows that represent the most com- monly used units in the marketplace (to address ranges of important parameters, e.g., materials, coating, spacers, and unit size). In addition, some of the window types listed in the ASHRAE Handbook (ASHRAE 1985) will be model- ed to verifythe data in Table 13 of Chapter 27 in ASHRAE (1985).
TABLE 6
Summaty of the Material Thermal Conductivity Used in Modellng by the Program Users
Thermal Conductivity W/(m K)
MaterM U.S. Lab Enerrnodal U. of W
Alumlnum 22 1 160 1 60 Glass 0.76 1 .O 1 .O Polylsobutylene 0.3 0.21 0.24 Urethane Foam 0.17 0.08 0.24 Polpulphide 0.3 0.3 0.3 Butyl Tape 0.079 0.13 0.13 Wood 0.11 80.15 0.14 0.14 PVC
-
0.14 0.14on the predicted U-values using computer models, a sen- sitivity analysis is planned taking into account materials, range of the thermal properties, and thickness.
In an attempt to validate the computer results of U, and U,, the IRC may conduct research to determine the feasibility of extracting these values from the test results obtained by the guarded hot box.
Finally, validation of computer simulations may be extended to address the prediction of temperature distribu- tion over the window surfaces and the condensation resistance of the window assembly. Also, computer simula- tion of window assemblies may be used to determine the impact of variat~ons in material properties on the U-value
of the assembly and its components.
for a wide range of materials and systems and to ensure that the material properties used in the simulation are representative of commonly used window components. REFERENCES
ASHRAE. 1985. ASHRAE handbook-1985 fundamentals. Atlanta: American Society of Heating, Refrigerating, and Air- Conditioning Engineers, Inc.
Baker, J. 1989. Correspondence to A.H. Elmahdy, IRC/NRCC, July 5.
Bowen, R.P. 1985. "DBR's approach for determining the heat transmission characteristics of windows." BRN 234, Institute for Research in Construction, National Research Council of Canada.
de Solda, G.J., and Dorman, R.W. 1987, ANSYS engineering anal- ysissystem, user's manual, version 4.3. Huston, PA: Swanson Analysis Systems.
Elmahdy, A.H. 1988. "Laboratory determination of the thermal characteristics of glazing units." ASHRAE Transactions, Vol. 94. Part 2.
Enermodal Engineering Ltd. 1988a. Report on window research priorities meeting. A summary report prepared for the Renewable Energy Branch, Energy Mines and Resources Canada. August.
Enermodal Engineering Ltd. 1988b. FRAME: a finite difference computer program to evaluate thermal performance of win- dow frame systems, version 1.2. Prepared for Energy Mines and Resources Canada, September.
Enermodal Engineering Ltd. 1989. "VISION and FRAME simula- tion of seven windows." Prepared for the National Research
SUMMARY Council of Canada, April.
The first set of data resulting from the joint Canadian1 Lawrence Berkeley Laboratory. 1988. WINDOW 3.1-a PC pro- gram for analyzing window thermal performance. University U.S. research project on window performance showed of California. October.
good agreement between hot box measurements and two Reilly, S., and Arasteh, D. 1989. Correspondence to A.H. Elmahdy,
different computer simulation models when comparing the IRCINRCC, May 8.
overall U-values of windows. Wright, J.L., and Sullivan, H.F. 1987. VISION: a computerprogram Comparison of the components' U-values (e.g., U,, to evaluate the thermal performance of advanced glazing and U,) shoved some differences between the
two
models systems, reference manual. Mechanical Engineering Depart-This paper is being distributed in reprint fonn by the Institute for Research in Construction.
A list of building
practice and research publications available from the Institute may be obtained by writingto
Publications Section, Institute for Research in Construction, National Research Council of Canada, Ottawa, Ontario,KIA
OR6.
Ce document est distribue sous f o m de tir64-part par SInstitut de recherche
en
construction On peut obtenir une liste des publications de 1'Institut portant sur les techniques ou les recherches en rnatiPre de Mtimenten
krivant la Section des publications, Institut de recherche en construction, Conseil national de recherches du Canada,