Analysis and Optimization of C[subscript
3] Photosynthetic Carbon Metabolism
The MIT Faculty has made this article openly available.
Please share
how this access benefits you. Your story matters.
Citation
Stracquadanio, Giovanni, Renato Umeton, Alessio Papini, Pietro
Liò, and Giuseppe Nicosia. “Analysis and Optimization of C3
Photosynthetic Carbon Metabolism.” 2010 IEEE International
Conference on BioInformatics and BioEngineering (2010).
As Published
http://dx.doi.org/10.1109/BIBE.2010.17
Publisher
Institute of Electrical and Electronics Engineers (IEEE)
Version
Author's final manuscript
Citable link
http://hdl.handle.net/1721.1/101094
Terms of Use
Article is made available in accordance with the publisher's
policy and may be subject to US copyright law. Please refer to the
publisher's site for terms of use.
Analysis and Optimization of
C
3
Photosynthetic Carbon Metabolism
Giovanni Stracquadanio
∗, Renato Umeton
†‡, Alessio Papini
§, Pietro Li`o
¶and Giuseppe Nicosia
∗∗Dept. of Mathematics & Computer Science – University of Catania, Italy,{stracquadanio, nicosia}@dmi.unict.it †Dept. of Biological Engineering – MIT, Cambridge, MA, USA, [email protected]
‡Dept. of Mathematics – University of Calabria, Italy
§Dept. of Plant Biology – University of Florence, Italy, [email protected] ¶Computer Laboratory – University of Cambridge, Cambridge, UK, [email protected]
Abstract—We have studied the C3 photosynthetic carbon metabolism centering our investigation on the following four design principles. (1) Optimization of the photosynthetic rate by modifying the partitioning of resources between the different enzymes of the C3 photosynthetic carbon metabolism using a constant amount of protein-nitrogen. (2) Identify sensitive and less sensitive enzymes of the studied model. (3) Maximize photosynthetic productivity rate through the choice of robust enzyme concentrations using a new precise definition of robust-ness. (4) Modeling photosynthetic carbon metabolism as a multi-objective problem of two competing biological selection pressures: light-saturated photosynthetic rate versus total protein-nitrogen requirement. Using the designed single-objective optimization algorithms, PAO and A-CMA-ES, we have obtained an in-crease in photosynthetic productivity of the 135% from 15.486
µmol m−2s−1 to 36.382 µmol m−2s−1, and improving the previous best-found photosynthetic productivity value (27.261
µmol m−2s−1, 76% of enhancement). Optimized enzyme con-centrations express a maximal local robustness (100%) and a high global robustness (97.2%), satisfactory properties for a possible “in vitro” manufacturing of the optimized pathway. Morris sensitivity analysis shows that 11 enzymes over 23 are high sensitive enzymes, i.e., the most influential enzymes of the carbon metabolism model. Finally, we have obtained the trade-off between the maximization of the leaf CO2 uptake rate and the minimization of the total protein-nitrogen concentration. This trade-off search has been carried out for the three ci concentrations referring to the estimate of CO2concentration in the atmosphere characteristic of 25 million years ago, nowadays and in 2100 a.C. Remarkably, the three Pareto frontiers identify the highest photosynthetic productivity rates together with the fewest protein-nitrogen usage.
I. INTRODUCTION
Recently, a committee of the U.S. National Academy of Engineering has detected fourteen “Grand Challenges for Engineering” [1], 14 areas awaiting engineering solutions in the 21st century. Implicitly, two of these “Grand Challenges for Engineering” have been addressed in this research work: “develop carbon sequestration methods” and “manage the nitrogen cycle”. The growth in emissions of carbon dioxide is a prime contributor to global warming, in practice, for carbon dioxide (CO2) problem the challenge is to develop effective and efficient systems for capturing the CO2and sequestering it safely away from the atmosphere. The optimized management of the nitrogen cycle is crucial by all living things, in fact, nitrogen is an essential component of proteins and DNA/RNA.
Indirectly, the maximization of the leaf CO2 uptake rate and the minimization of the total protein-nitrogen concentration obtained in this work go in the direction to improve CO2 capturing rate and to increase nitrogen use efficiency of natural leaf. This result has been reached thanks to specific optimization algorithms.
Numerous problems encountered in bioinformatics, systems biology and bioengineering can be modeled as optimization problems [2], [3] and, thus, lend themselves to the appli-cation of effective heuristic search methods and derivative-free global optimization algorithms [4]. The optimization task is conducted with respect to a single objective function or a set of competing, conflicting, and non-commensurate objectives having nonlinear interdependence. It is necessary, hence, the usage of proper heuristics and algorithms to op-timize the objective functions while satisfying several con-straints. Recently, in multi-objective optimization has been found important applications in a growing number of fields, for example, molecular biology, chemical engineering and biomedical engineering, and shown to have significant benefits compared to single-objective optimization, e.g., selection of single nucleotide polymorphisms [5], protein structure pre-diction [6], and estimation of intracellular fluxes [7]. In this research work, we have optimized the photosynthetic carbon metabolism in order to maximize the CO2 uptake rate, and investigated the Pareto frontiers in the carbon metabolism in terms of photosynthetic rate versus protein-nitrogen. Using the Morris method [8], we have evaluated the impact of enzymes on the model identifying the sensitive and insensitive enzymes. Moreover, we have performed a new robustness analysis detecting the robust and less robust enzymes in order to keep a maximal leaf CO2 uptake rate. The overall framework adopted to analysis photosynthetic carbon metabolism can be used to study large-scale metabolic networks, in particular, and biomolecular systems, in general. We believe that the algorithms and tools designed and introduced in this study, the derivative-free global optimization algorithms, the multi-objective optimality analysis, the sensitivity and robustness analysis, although general-purpose methods, could be effective in explain key properties of biological systems.
The carbon metabolism is largely influenced by the en-zyme concentrations [9]; changing the natural concentration
is crucial to improve the CO2 uptake rate of a plant. The atmospheric CO2 concentration has changed during the last 100 years more than in the past 25 million years, due to large changes in Earth environment; it seems to be reasonable that the evolutionary process cannot re-optimize the enzyme con-centrations in this tight period. Even if in the bioinformatics and bioengineering era we are able to work at the enzyme level, the exhaustive search of the optimal enzyme concentra-tions involved in the photosynthetic metabolism, taking into account only fixed increase and decrease steps, would require testing more than 109 possible values. Although an in-vivo optimization is intractable, we can effectively estimate in silico the optimal concentration of the enzymes of this metabolic pathway [10]. We have designed ad-hoc algorithms to optimize the enzyme concentrations in order to maximize the CO2 uptake rate. The metabolism has been modeled as a system of ODEs, where the inputs are the enzyme concentrations and the output is the CO2uptake. Firstly, we maximized the CO2 uptake rate using deterministic and stochastic optimization algorithms; we found that the designed algorithms, Advanced CMA-ES algorithm (A-CMA-ES) and Parallel Optimization Algorithms (PAO), are able to increase the photosynthetic rate of 135%, that is, the new best-known optimum. The Morris sensitivity analysis shows the complexity and non-linearity of the pathway; in fact Morris method unravels the insensitive and sensitive enzymes of the C3photosynthetic carbon metabolism model. In order to estimate the robustness of the found solu-tions, we have performed global and local robustness analysis using ad-hoc designed Monte-Carlo methods. According to which aspect or part of the dynamical system is mutated, it is possible to define four different types of robustness [11]: dynamical stability (mutation of initial conditions), constraint robustness (mutation of constraint values), parametric robust-ness (mutation of parameter values) and structural stability (mutation of the dynamical function). The designed robustness analysis is a parametric robustness: robustness to change of parameter values.
Finally, using an multi-objective optimization algorithm, we have discovered Pareto frontiers between two competing and conflicting objectives: the CO2uptake rate and the amount of protein-nitrogen. We maximized the CO2 uptake rate while minimizing the amount of used protein-nitrogen concentration. The paper is structured as follows: Section §II describes the framework here designed, Morris sensitivity analysis, single and multi objective optimization, local and global robustness analysis, for the study and optimization of carbon metabolism; Section §III presents the results obtained, the sensitive and insensitive parameters, nominal values, and robustness values, and the corresponding Pareto frontiers obtained, comparing the results with state-of-art optimization algorithms and the natural leaf CO2uptake rate. Discussion and concluding remarks are presented in Section §IV.
II. THEDESIGNEDFRAMEWORK
In this section we introduce the three tools adopted in the re-optimization of the photosynthetic carbon metabolism
pathway; sensitivity analysis, derivative-free optimization al-gorithms, and robustness analysis.
A. The method of Morris
The sensitivity analysis (SA) concerns the study of how uncertainty in the output of a model can be apportioned to dif-ferent sources of uncertainty in the model input. In particular, SA tries to identify the most influential parameters of a given model; understanding which are the most important parameters of a model could be extremely difficult since it is common to deal with non-linear, highly noise and computational expensive models. It is important to remark the differences between Robustness (RA) and SA; RA aims to evaluate which is the probability of a system to remain in a reference state under perturbations, while, SA perturbs a system in order to find which is the aspect that mainly affects its behavior and to detect the dependencies among input parameters and between input and output. In our research work, we want to assess which enzymes are crucial for the carbon metabolism; in order to perform this analysis, we used the Morris method, which is particularly suited when the number of uncertain parameters, called factors, is high and the model could be expensive to compute. The Morris method belongs to the class of the one-factor-a-time (OAT) methods [12]; OAT means that a factor is perturbed in turn while keeping all other factors fixed at their nominal value. In particular, the method varies one factor at time across a certain number of levels selected in the space of the input factors; this grid-like sampling makes the algorithm easily adaptable for discrete and continuous variables. For each variation, a factor elementary effect is computed as follows: ui = (Y (x1, x2, . . . , xi +
∆xi, . . . , xk)− Y (x1, x2, . . . , xi, . . . , xk))/∆xi where Y is
the model, x1, x2, . . . , xi + ∆xi, . . . , xk is the perturbed
parameters vector and x1, x2, . . . , xi, . . . , xk is the nominal
parameters vector. For each factor, at different levels, various estimates of the elementary effect ui are performed. In order
to study the importance of the parameters, the mean µi and
the standard deviation σi are computed over the elementary
effects ui of the i−th parameter. A high value of µi denotes
a high linear effect for a given factor, while a high value of σi denotes either non-linear or non-additive behavior. In our
experiments, we use the modulus version of µ∗i since it is better than µi in ranking factors in order of importance; for each
enzyme we use the five concentrations under consideration as the nominal values of the concentrations, and successively, we use 20 factor levels perturbed 10 times. Since the bounds on variables are not clearly defined, we set the lower and upper bounds using the±100% of the nominal value of each enzyme concentrations.
B. Derivative-Free Optimization Algorithms
One of the key points of the present research work is the CO2 uptake optimization of the carbon metabolism pathway. The optimization of the photosynthetic productivity rate has been tackled using state-of-the-art derivative-free optimiza-tion algorithms belonging to the classes of deterministic and
stochastic optimizers and a new optimization framework, Par-allel Optimization Algorithms (PAO). Stochastic algorithms taken into account are CMA-ES [13], Differential Evolution [14] and the hybrid particle swarm optimizer PPSwarm [15]. The deterministic optimizers belong to three broad sub-classes; pattern search methods are represented by the Hooke-Jeeves method [16], the Generalized Pattern Search [17] and the Mesh Adaptive Direct Search [18]. Finally, we use two branch-and-bound algorithms called Direct [19] and Multilevel Coordinate Search [20], and the Implicit Filtering [21] a line-search method.
The ODEs system input is a partitioning of the E = 23 enzymes involved in the metabolic pathway; the out-put is an evaluation in terms of CO2 uptake, predict-ing then, the photosynthetic/photo-respiratory properties of a leaf characterized by such a partitioning. This means that, abstracting the concentration of the enzymes in a vector x = [conc1, conc2, . . . , concE], the value f (x) is the
CO2 uptake coming from the solution of the ODEs system when the concentration x is adopted. To solve the system of ODEs we used the ODE15S MATLAB function as proposed in [22]; this ensures an acceptable accuracy with a moderated computational cost.
In order to consider biologically meaningful concentrations, the algorithms have to look for a partitioning of the enzymes, meaning that the total amount of protein-nitrogen has to remain constant among all vectors x and equal to the amount that characterizes the vector x0 corresponding to the enzyme concentrations measured in the natural leaf [22] (the initial concentrations). The long run comparison of the convergence processes of the algorithms reveals the presence of many local optima in the solution space; for this reason the designed algorithm, A-CMA-ES, introduces a set of cut-off criteria to CMA-ES and ensures with a constraint, a lower bound, for each enzyme concentration to be compatible with the smallest concentration observed in the natural leaf (vector x0). Parallel Optimization Algorithms (PAO) is an optimization framework that exploits coarse-grained parallelism to let a pool of solutions exchange promising candidate solutions in an archipelago fashion. Using evolutionary operators such as recombination, mutation and selection, the framework com-pletes with migration its approach based on islands. Each island is a virtual place where a pool of solutions is let evolve with a specific optimization algorithm; communications among islands in terms of solutions evolved by potentially different algorithms are arranged through a chosen archipelago topology. The island model outlines an optimization environ-ment in which different niches containing different populations are evolved by different algorithms and periodically some candidate solutions migrate in an other niche to spread their building block. In this archipelago approach different topolo-gies choices can raise to completely different overall solution introducing then another parameter that has to be chosen for each algorithm on each island. The PAO framework actually encloses two optimization algorithms and many archipelago topologies but its simplest configuration has been used to have
a comprehensible comparison with the other adopted strategies and to better understand the optimization capabilities of this approach. The adopted configuration has two islands with 2 optimization algorithms, A-CMA-ES and DE, that exchange candidate solutions every 200 generations with an all-to-all (broadcast) migration scheme at a 0.5 probability rate. Even in its simplest configuration this approach has shown enhanced optimization capabilities and an optimal convergence. After this phase, the NSGA-II [23] multi-objective optimization algorithm has been used to tackle the problem relaxing the natural constraint about the fixed amount of protein-nitrogen. The goal is now to optimize two conflicting objectives, that are, to maximize the CO2 uptake and at the same time to minimize the total amount of protein-nitrogen needed for that. Introducing then the function g(x) =∑Ei=1x[i]∗W Mi
BKi , where BKi are the catalytic number or turnover number, and W Mi
the molecular weight of each enzyme respectively, the problem is now defined as finding the leaf representing the best trade-off when maximizing CO2uptake rate, f (x), and at the same time minimizing the total amount of protein-nitrogen, g(x). In other words, we are looking for the best resulting leaf in terms of CO2uptake that uses the smallest amount of protein-nitrogen to gain that result. Quantitative evaluation of points obtained facing two competing and conflicting objectives is done using a Pareto front approach: non-dominated points are those solutions that are not outperformed in both objectives by other points and then represent the Pareto-optimal solutions. C. Local and Global Robustness
The robustness is a dimensionless metric that assesses the yield of a given system, it is the property of the system itself to undergo mutations remaining in a reference state and continuing to perform its tasks in a reliable way. In biology, robustness is generally regarded as a desiderable feature. The ability of a system to survive changes in the environment, and/or in the system itself, is one of the main driving forces of evolution [24]. By inspecting the photosynthesis process, it is extremely important to evaluate how the CO2 uptake rate changes due to perturbations in the enzyme concentrations; perturbations can be caused by many factors, like bias in the synthesis process and changes in the ground elements. For instance, by mutations of the promoter sequence or on the enzyme control sites (effector binding sites) in the case of allosteric enzymes. It is then obvious the importance of seeking concentrations that maximize the CO2uptake rate and maintain a quasi-ideal behavior in the presence of noise. In our research work, we define Ω ={{pi}mi=1,{ϕi}ni=1} as a system
with m parameters and n properties. We called nominal value (Nv) the value of a property for a given parameter set. A trial
τ is a perturbed system generated by an α function, also called α-perturbation, such that τ = α(Ω, σ). The α function applies a stochastic noise σ on the reference system Ω; without loss of generality, we assume that the noise is defined by a random distribution. In order to simulate a statistically meaningful perturbation phenomenon, we have generated an ensemble, T, of perturbed systems. A trial τ ∈ T is considered robust to a
perturbation (mutation) of the stochastic noise σ for a given property ϕ, if the following robustness condition is verified:
ρ(Ω, τ, ϕ, ϵ) = {
1 if | ϕ(Ω) − ϕ(τ) |≤ ϵ
0 otherwise
where Ω is the reference system and ϵ is a robustness threshold. The robustness of a system Ω is the number of robust trials in T (with respect to the property ϕ) over the total number of trials (| T |); we denote this measure as the robustness of the system. Formally, we define a robustness function Γ as follows:
Γ(Ω, T, ϕ, ϵ) = ∑
τ∈Tρ(Ω, τ, ϕ, ϵ)
|T |
The function Γ is a dimensionless quantity that assesses the probability that the nominal value of a property changes at most ϵ due to perturbations; high Γ values means high system robustness. Two kind of robustness analysis has been performed; the global robustness analysis applies a stochastic noise to each enzyme concentration; while, the local robust-ness analysis applies the noise one enzyme at time (this eval-uates the single robustness, that is, the robustness of a single enzyme). In other words, while the global robustness analysis studies global changes of the system, the local robustness analysis studies the relative robustness of a single enzyme. The ensemble T has been generated using a Monte-Carlo algorithm; we have fixed a maximum perturbation of 10% from the nominal value of each enzyme concentration, and we have generated an ensemble of 5× 10³ trial for the global robustness analysis and 200 trials for each enzyme for the local robustness.
III. Experimental Results A. Sensitivity Analysis
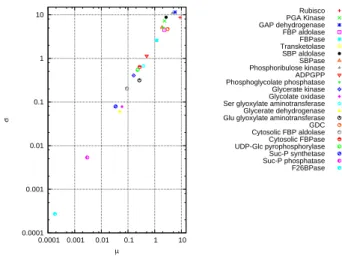
Sensitivity analysis perturbs a given system in order to discover which aspects primary affect its behavior, to detect the dependencies among input parameters and between in-put parameters and outin-put functions. In Fig.1 are reported the results of the Morris sensitivity analysis on the model of the carbon metabolism. High mean values mean linear enzymatic response, while high standard deviation values assess a non-linear (or non-additive) behavior or dependencies among enzymes. Inspecting Fig. 1 we can detect three distinct clusters, a) eleven high sensitive enzymes (i.e., enzymes with µ, σ > 1), b) five insensitive enzymes (µ, σ < 0.1), and c) seven low sensitive enzymes (0.09 < µ ≤ 1). Hence, the eleven high sensitive enzymes, Rubisco, PGA kinase, GAP dehydrogenase, FBP aldolase, FBPase, SBP aldolase, SBPase, Phosphoribulose kinase, ADPGPP, Phosphoglycolate phosphatase, and GDC, are the most important enzymes in the studied model of the carbon metabolism.
Six enzymes of the Calvin Cycle are known to be directly regulated by light [25]; among these six are present two enzymes (PGA Kinase and GAP dehydrogenase) responsible of energy-converting reactions, which are coupled to the light reactions in the thylakoids. Rubisco, Phosphoribulose kinase,
0.0001 0.001 0.01 0.1 1 10 0.0001 0.001 0.01 0.1 1 10 σ µ Rubisco PGA Kinase GAP dehydrogenase FBP aldolase FBPase Transketolase SBP aldolase SBPase Phosphoribulose kinase ADPGPP Phosphoglycolate phosphatase Glycerate kinase Glycolate oxidase Ser glyoxylate aminotransferase Glycerate dehydrogenase Glu glyoxylate aminotransferase GDC Cytosolic FBP aldolase Cytosolic FBPase UDP-Glc pyrophosphorylase Suc-P synthetase Suc-P phosphatase F26BPase
Fig. 1. Sensitive and Insensitive Enzymes. Morris sensitivity analysis of the carbon metabolism model. For each enzyme, we report the mean µ and standard deviation σ of the CO2 uptake rate on the x-axis and y-axis respectively. High mean values mean linear enzymatic response, while high standard deviation values assess a non-linear behavior or dependencies among enzymes.
FBPase and, with somewhat lower sensitivity values, FBPase as well are controlled (and activated) by light [25].
This means that 5 out of 6 of the enzymes with the larger sensitivity values (those with the largest standard deviation in Fig. 1) are controlled by light. The sixth enzyme with largest sensitivity value is the SBP aldolase (third position in sensitivity value). This enzyme is not light regulated but is responsible of two different reactions of the Calvin Cycle: the aldolase controlled reactions leading to the formation of SBP and FBP (SBP aldolase and FBP aldolase are the same enzyme [26]). The fact that the same enzyme is responsible of two reactions in the same cycle can explain its substantial sensitivity. The many enzymes with large mean and stan-dard deviation values reflect the complexity of the pathway and the non-linear interactions occurring among enzymes. For future improvements of the model we have to consider that some of the Calvin Cycle enzymes (particularly - and not surprisingly - those with higher sensitivity values) are allosteric enzymes. The use of Michaelis-Menten kinetics is, in this case, an approximation of the real situation. Moreover, we must consider that the regulatory networks in which the Calvin Cycle enzymes are involved, go far beyond the cycle itself. For instance, the impairment of the photorespiratory enzymes (one of the aim to be achieved in order to increase photosynthetic efficiency), could cause unexpected effects on the general efficiency since photorespiration is proposed to be important for avoiding photoinhibition of photosystem II, especially in C3 plants [27]. This implies that the variation in enzyme concentration is unlikely to be completely free (or exclusively linked to the total protein-nitrogen amount) as assumed in our model. The large variation in sensitivity of the Calvin Cycle enzymes could be linked not only to the
more or less important function of the cycle itself, but also to the contemporaneous involvement of some of these enzymes in other metabolic networks and then less influenced by the Calvin Cycle selective pressures. On the contrary, enzymes with high µ value of sensitivity analysis, see Fig. 1, are linked to the Calvin Cycle. For instance, FBPase activity and even its mRNA expression is light regulated and hence strictly linked to photosynthesis. In order to validate the results, we executed a preliminary bioinformatics analysis with a BLAST [28] search on the amino acid sequences (starting from Arabidopsis genome) of the Calvin Cycle enzymes that had the most extreme sensitivity values. We have taken into account the e-values calculated by BLAST as search result. The enzymes showing the highest sensitivity values, were also those with the lowest e-values in BLAST hits (corresponding to the most similar sequences found in the protein sequences database). A possible explanation of the result could be that the amino acid sequence variation in highly sensitive enzymes is low, even in hits less related to the query sequence.
Essentially, the e-value describes the random background noise. The lower the e-value, or the closer it is to zero, the more “significant” the match is (less different the sequences are). It is likely that the protein sequence is so optimized that the sequence variation is low, even in species scarcely related to the query sequence.
B. Maximal and Robust Photosynthetic Productivity
Initially, a larger family of optimization algorithms has been compared in CO2 uptake maximization at ci = 270 µmol
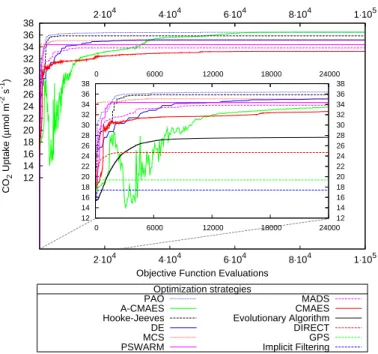
mol−1(reflecting the current CO2 atmospheric concentration of 360 parts per million, ppm) and by fixing the total protein-nitrogen in the enzymes of carbon metabolism to 1 gm−2 of leaf area. We allow 24000 objective function evaluations as in [22]; in Fig. 2, we report the convergence process of the tested derivative-free optimization algorithms. It is worth noting that the EA proposed in [22] is outperformed by eight algorithms, the EA seems to stack into a local optimum after 104objective function evaluations, while the designed algorithms, PAO and A-CMA-ES, achieve enhanced CO2 uptake rates. The most promising algorithms have been let continue the optimization process until 105 objective function evaluations; our PAO and A-CMA-ES algorithms found the best CO2 uptake and they outperform H-J and Differential Evolution (DE, [14]). From an optimization point of view, PAO and A-CMA-ES seem to be the most effective algorithms. The analysis of the PAO convergence shows that the algorithm rapidly reaches its best solution, and it is not able to improve it even if a large number of objective function evaluations is allowed. Surprisingly, among the three pattern search algorithms considered (H-J [16], GPS [17], MADS [18]), the simple H-J outperforms the other two claimed approaches. The data in Table I show the concentrations of the enzymes for the original leaf (the second column), for the optimized leaf as proposed by the evolution-ary algorithm used in [22] (the third column) and four best candidates obtained by our PAO and A-CMA-ES algorithms. The comparison among the robust optimized leaf (last column)
12 14 16 18 20 22 24 26 28 30 32 34 36 38 2⋅104 4⋅104 6⋅104 8⋅104 1⋅105 2⋅104 4⋅104 6⋅104 8⋅104 1⋅105 CO 2 Uptake ( µ mol m -2 s -1)
Objective Function Evaluations Optimization strategies PAO A-CMAES Hooke-Jeeves DE MCS PSWARM MADS CMAES Evolutionary Algorithm DIRECT GPS Implicit Filtering 12 14 16 18 20 22 24 26 28 30 32 34 36 38 0 6000 12000 18000 24000 12 14 16 18 20 22 24 26 28 30 32 34 36 38 0 6000 12000 18000 24000
Fig. 2. Convergence process of the derivative-free global optimization algorithms. Searching of the optimal partitioning of resources among the enzymes of carbon metabolism to maximize light-saturated photosynthetic rate (CO2 uptake) at ci= 270 µmol mol−1 (reflecting the current CO2
atmospheric concentration). State-of-the-art optimization algorithms have been adopted and compared (in the legend from best to worst).
and the natural leaf (second column) can help to detect the relevant enzymes in order to maximize the light-saturated photosynthetic rate (see Fig. 3). In fact, the robust optimized leaf brings coherent relative changes with respect to the natural leaf for most of the enzymes. In order to study the robustness of the proposed concentrations, we have performed a global and local robustness analysis in order to understand how the gained CO2Uptake rate is preserved under enzymes perturba-tions; the results are presented in Table I. Two major aspects should be remarked; firstly, the concentration that achieves the maximum CO2 uptake rate (36.495 µmol m−2s−1) is extremely sensitive, and its robustness values are all below the robustness of the other solutions. In particular, by inspecting the local robustness analysis it is possible to note that many enzyme concentrations are not robust, and many of them lead to a completely unreliable pathway. By inspecting the results of local robustness analysis, it is worth noting that the Rubisco and GAP dehydrogenase are the less robust enzymes for four over six candidate solutions. Using the designed optimization framework PAO (last column) we have obtained an increase in photosynthetic productivity of the 135% from 15.486 µmol m−2s−1 to 36.382 µmol m−2s−1, improving the previous best-found photosynthetic productivity value (27.261 µmol m−2s−1). Moreover, this new set of enzyme concentrations has a maximal local robustness (100%) and a high global robustness (97.2%). With respect to the initial concentration of enzymes, increases in Rubisco, FBP aldolase, SBPase, ADPGPP and a strong increases in Cytosolic FBP aldolase, Cytosolic FBPase, UDP-Glc pyrophosphorylase
Enzyme Name Initial Conc. mg N m−1 (S. Robustness %) Conc. mg N m−1 found in [22] (S. Robustness %) Opt. without constraints, Conc. mg N m−1 found by A-CMA-ES (S. Robustness %) Opt. with constraints, Conc. mg N m−1 found by A-CMA-ES (S. Robustness %) Opt. with constraints, Conc. mg N m−1 found by A-CMA-ES (S. Robustness %) Optimal and Robust Conc. mg N m−1 found by PAO (S. Robustness %) Rubisco 517.00 (100) 795.00 (87.5) 861.93 (39) 840.60 (87) 857.05 (63.0) 860.226 (100.0) PGA kinase 12.20 (100) 5.06 (100) 3.98 (0) 4.90 (100) 4.21 (100) 3.989 (100.0) GAP dehydrogenase 68.80 (100) 75.00 (76.5) 63.55 (17) 71.62 (87.5) 63.71 (51.0) 64.483 (100.0) FBP aldolase 6.42 (100) 11.70 (100) 9.29 (30.5) 10.38 (100) 10.77 (100) 9.050 (100.0) FBPase 25.50 (100) 35.90 (100) 27.03 (0) 32.07 (100) 31.78 (100) 26.889 (100.0) Transketolase 34.90(100) 18.40 (100) 16.98 (100) 19.46 (100) 15.93 (100) 8.247 (100.0) SBP aldolase 6.21(100) 7.43 (100) 5.94 (0) 6.95 (100) 5.58 (100) 6.661 (100.0) SBPase 1.29 (100) 4.90 (100) 4.31 (1) 5.03 (100) 4.26 (100) 4.397 (100.0) Phosphoribulose kinase 7.64 (100) 8.55 (100) 7.99 (22.5) 8.86 (100) 7.67 (100) 7.007 (100.0) ADPGPP 0.49 (100) 4.88 (100) 1.22 (0) 2.45 (100) 4.75 (100) 0.721 (100.0) Phosphoglycolate phos. 85.20 (100) 1.42 (100) 0.00 (0) 0.85 (100) 0.02 (100) 0.325 (100.0) Glycerate kinase 6.36 (100) 1.31 (100) 0.00 (100) 0.03 (100) 0.02 (100) 0.005 (100.0) Glycolate oxidase 4.77 (100) 1.49 (100) 0.00 (100) 1.17 (100) 0.02 (100) 0.019 (100.0) Ser glyoxylate aminotrans. 17.30 (100) 3.03 (100) 0.00 (100) 0.14 (100) 0.02 (100) 0.027 (100.0) Glycerate dehydrogenase 2.64 (100) 0.78 (100) 0.00 (100) 0.01(100) 0.02 (100) 0.003 (100.0) Glu glyoxylate aminotrans. 21.80 (100) 4.47 (100) 0.00 (100) 0.21(100) 0.02 (100) 0.00005 (100.0) GDC 179.00 (100) 18.60 (100) 0.00 (100) 1.88(100) 0.02 (100) 0.00003 (100.0) Cytosolic FBP aldolase 0.57 (100) 0.28 (100) 2.03 (0.5) 0.75 (100) 0.89 (100) 2.127 (100.0) Cytosolic FBPase 2.24 (100) 1.44 (100) 5.27 (30.5) 2.05 (100) 2.50 (100) 5.554 (100.0) UDP-Glc pyrophosphorylase 0.07 (100) 0.07 (100) 0.50 (0) 0.56 (100) 0.70 (100) 0.531 (100.0) Suc-P synthetase 0.20 (100) 0.15 (100) 0.03 (30.5) 0.09 (100) 0.03 (92.5) 0.034 (100.0) Suc-P phosphatase 0.13 (100) 0.07 (100) 0.03 (0) 0.01(100) 0.02 (100) 0.031 (100.0) F26BPase 0.02 (100) 0.01 (100) 0.00 (100) 0.03 (100) 0.02 (100) 0.0 (100.0) CO2Uptake µmolm2s 15.486 27.621 36.495 35.146 36.290 36.382 Local robustness % 100 76.50 0 87.0 51.0 100 Global robustness % 81.80 78.44 39.18 79.42 100.0 97.2 TABLE I
CONCENTRATIONS OF THE ENZYMES,ANDSINGLEROBUSTNESS(S. ROBUSTNESS), CO2UPTAKE, LOCAL ANDGLOBALROBUSTNESS(IN THE LAST THREE ROWS). THE SECOND AND THIRD COLUMNS REPORT THE INITIAL CONCENTRATIONS OF ENZYMES USED IN THE SIMULATION, (INITIAL LEAF,OR
NATURAL LEAF),AND THE OPTIMIZED LEAF AS PREDICTED BY THE EVOLUTIONARY ALGORITHM USED IN[22]. THE LAST FOUR COLUMNS SHOW THE BEST CANDIDATE SOLUTIONS OBTAINED BY THE DESIGNEDPAOANDA-CMA-ESALGORITHMS. THIS SET OF CANDIDATE SOLUTIONS HAS BEEN
OBTAINED ATci= 270 µmol mol−1(REFLECTING THE CURRENTCO2ATMOSPHERIC CONCENTRATION).
0 1 2 3 4 5 6 7 8 Rubisco PGA Kinase GAPDH FBP Aldolase FBPase Transketolase Aldolase SBPase PRK ADPGPP PGCAPase
GCEA Kinase GOA Oxidase
GSAT HPR reductas GGAT GDC Cytolic FBP aldolase Cytolic FBPase UDPGP SPS SPP F26BPase [Enzyme] CO 2 Uptake 36.382 /[Enzyme] CO 2 Uptake 15.486
Fig. 3. The ratio of the enzyme concentrations optimized by the PAO algorithm (36.382 µmol m−2s−1) at a ci= 270 µmol mol−1compared
to the initial concentrations (15.486 µmol m−2s−1).
were required to a large increase of CO2 uptake rate (see Fig. 3). Moreover, there are four enzymes, GAPDH, FBPase, SBP aldolase, and Phosphoribulose kinase, approximately maintaining the same values of the initial concentrations,
while PGA kinase, Transketolase, Suc-P synthetase and Suc-P phosphatase are under-expressed; the remaining enzymes are switched off. The under- and over- expressed pattern of Fig. 3 is well defined, the change of concentrations of the enzymes of carbon metabolism between optimized leaf and natural leaf does not show ambiguities.
As noted in [29], [30] SBPase is one enzyme where an approximately 10% increase in photosynthetic rate has been observed in transgenic plants over-expressing SBPase enzyme. It is crucial, hence, to verify if further gains could be obtained in transgenic plants if, in addition, Rubisco, FBP aldolase, ADPGPP, Cytosolic FBP aldolase, Cytosolic FBPase, and UDP-Glc pyrophosphorylase were over-expressed.
C. Multi-objective optimization of the carbon metabolism:
CO2 uptake vs. Protein-Nitrogen
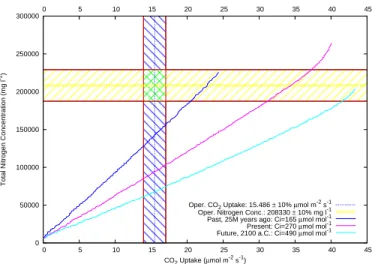
In this new optimization task, we tried to maximize the CO2uptake rate while minimizing the amount of used protein-nitrogen concentration; we have performed a multi-objective optimization by considering the actual CO2atmospheric con-centration, and the past and future concentrations; in Fig. 4, the three Pareto frontiers are reported.
It is interesting to note that for increasing atmospheric CO2 it is possible to obtain a major CO2 uptake rate with a
0 50000 100000 150000 200000 250000 300000 0 5 10 15 20 25 30 35 40 45 0 5 10 15 20 25 30 35 40 45
Total Nitrogen Concentration (mg l
-1)
CO2 Uptake (µmol m-2 s-1)
Oper. CO2 Uptake: 15.486 ± 10% µmol m -2
s-1 Oper. Nitrogen Conc.: 208330 ± 10% mg l-1 Past, 25M years ago: Ci=165 µmol mol-1
Present: Ci=270 µmol mol-1
Future, 2100 a.C.: Ci=490 µmol mol-1
Fig. 4. CO2uptake and protein-nitrogen concentration trade-off. Maximizing the CO2 uptake while minimizing the total amount of protein-nitrogen concentration; the operative area of natural leaves is located in the checked area.
nor protein-nitrogen concentration. To accomplish this multi-objective optimization task, we used the algorithm NSGA-II [23], whose main property is an elitist genetic strategy coupled with a fast non-dominated sorting procedure and a density estimation of individuals using the crowding distance. The natural operative range of the CO2 uptake is highlighted with a blue-striped pattern, while the natural operative range of the standard total protein-nitrogen concentration is highlighted with the yellow-striped pattern. Moving beyond these ranges, we set up a scheme to find the best trade-off between the max-imization of the CO2uptake and the minimization of the total protein-nitrogen concentration. This trade-off search has been carried out for the three ciconcentration referring to the
envi-ronmental condition in effect 25 million years ago, nowadays and in 2100 a. C. The three Pareto frontiers represent the best trade-offs that have been found for the three ciconcentrations;
each Pareto front has been obtained selecting over all solutions those non-dominated, that means non-outperformed in both objectives by others. From a leaf optimization point of view, the most interesting (and at same time difficult to reach) side of the chart is the bottom-right corner; in fact, leaves represented by points closer to this area have a higher CO2 uptake and a contextually lower total protein-nitrogen concentration, that means the best photosynthetic productivity rate with the fewest protein-nitrogen employment. These Pareto frontiers suggest that ad hoc manipulation of partitioning of enzymes could greatly increase the photosynthetic rate and decrease the total protein-nitrogen investment of the photosynthetic carbon metabolism of plants.
IV. DISCUSSION ANDCONCLUSIONS
Optimizing the CO2uptake rate is a complex task, that has been tackled by ad-hoc optimization algorithms, A-CMA-ES and PAO; the found solution is robust and assure a gained CO2 uptake rate of 135%. We used a multi-objective optimization
approach in order to maximize the CO2 uptake rate and minimizing the protein-nitrogen concentration; the analysis of the Pareto front shows that, for increasing CO2 atmospheric concentrations, it is possible to obtain an improved CO2 uptake rate with a decreasing protein-nitrogen concentration. From 1850 to 2006, fossil fuel and cement derived CO2 emissions, released a cumulative total of ∼ 330 petagrams of carbon (PgC) to the atmosphere. An approximately addi-tional 158 PgC came from land-use-change emissions, largely deforestation and wood harvest [31]. The growth rate of global average atmospheric CO2 for 2000–2006 was 1.93 ppmy−1 (parts per million per year) [31]. Primary production of world biomass, considering both marine and terrestrial sources, ro-bustness an estimated global net primary production of 104.9 petagrams of carbon per year [32], while Cellulose and Lignin, the most abundant organic resources in the world, exhibit an annual turnover rate of 4× 10¹⁰tonnes, or 40 petagrams [33]. Our results show that the potential increase in CO2 uptake obtainable by varying enzyme concentration of the Calvin Cycle might increase the current CO2uptake by 135%, hence a quantity potentially capable to counteract CO2 emission in atmosphere by human activities. Such an increase could be obtained partly naturally by varying gene expression of the involved enzymes, or by selecting individuals that could modify the expression hence increasing their Calvin Cycle efficiency. This second mechanism would require a long time unless we consider the hypothesis of artificially modifying of DNA involved in gene expression control. This last possibility would require careful evaluation of possible risks linked to introduction in the environment of organisms capable of fast growth in a CO2 rich atmosphere. The increase in biomass productivity and CO2uptake calculated by optimized enzyme partitioning might potentially counteract the current increase in atmospheric CO2.
From a methodological point of view, we are delighted to report that the optimization methodologies in the systems biology framework is a thriving field of research. It has two immediate and important benefits: the improved understanding of the processes that shape the evolution of energy collecting engine at the molecular level and the improved ability to use optimization methods to predict from molecular data directions where experiments should go and drive the decision process in biotechnology.
Finally, strengths of this work: 1) as far as we know it is the first time that the overall framework, sensitivity, optimization and robustness, is used for the study of biological pathways; 2) it is the first time that local and global robustness analysis has been defined and used to study molecular entities, and 3) for the first time, the C3 photosynthetic carbon metabolism has been characterized by CO2 uptake rate versus protein-nitrogen Pareto frontiers which we prove to be a meaningful and effective way to address this class of bioinformatics and bioengineering problems.
The integration of optimization methods with bioinformatics is shaping at growing pace our comprehension of biological processes Optimization methodologies provide an essential
tool to capture a set of assumptions and to follow them to their precise logical conclusions. They allow us to generate new hypotheses, suggest experiments, and measure crucial parameters. If the scientific progress relies on asking the right questions, we believe that the combination of optimization methods and bioinformatics will suggest more insightful ques-tions and answers than bioinformatics techniques alone.
REFERENCES
[1] U. S. National Academy of Engineering. Engineering’s grand challenges. [2] C. A. Floudas and P. M. Pardalos, editors. Optimization in
Computa-tional Chemistry and Molecular Biology: Local and Global Approaches.
Kluwer Academic Publishers, 2000.
[3] M. S. Dasika and C. D. Maranas. Optcircuit: An optimization based method for computational design of genetic circuits. BMC Systems Biology, 2:24, 2008.
[4] A. R. Conn, K. Scheinberg, and L. N. Vicente. Introduction to Derivative-Free Optimization. SIAM, 2009.
[5] R. M. Hubley, E. Zitzler, and J. C. Roach. Evolutionary algorithms for the selection of single nucleotide polymorphisms. BMC Bioinformatics, 4:30, 2003.
[6] V. Cutello, G. Narzisi, and G. Nicosia. A multi-objective evolutionary approach to the protein structure prediction problem. Journal of the
Royal Society Interface, 3(6):139–151, 2006.
[7] D. Nagrath, M. Avila-Elchiver, F. Berthiaume, A. W. Tilles, A. Messac, and M. L. Yarmush. Integrated energy and flux balance based mul-tiobjective framework for large-scale metabolic networks. Annals of
Biomedical Engineering, 35(6):863–885, 2007.
[8] M.D. Morris. Factorial sampling plans for preliminary computational experiments. Technometrics, 33(2):161–174, 1991.
[9] J. Barber. Photosystem II: the engine of life. Quarterly Reviews of
Biophysics, 36(01):71–89, 2003.
[10] L. Nedbal, J. ˇCerven`y, U. Rascher, and H. Schmidt. E-photosynthesis: a comprehensive modeling approach to understand chlorophyll fluores-cence transients and other complex dynamic features of photosynthesis in fluctuating light. Photosynthesis Research, 93(1):223–234, 2007. [11] J. Gunawardena. Elements of Computational Systems Biology, chapter
”Models in systems biology: the parameter problem and the meanings of robustness”, pages 21–43. John Wiley and Sons, 2010.
[12] A. Saltelli, S. Tarantola, and F. Campolongo. Sensitivity analysis in
practice: a guide to assessing scientific models. John Wiley & Sons
Inc, 2004.
[13] N. Hansen and A. Ostermeier. Completely derandomized self-adaptation in evolution strategies. Evolutionary Computation, 9(2):159–195, 2001. [14] R. Storn and K. Price. Differential evolution – a simple and efficient heuristic for global optimization over continuous spaces. Journal of
Global Optimization, 11(4):341–359, 1997.
[15] A. Vaz and L. Vicente. A particle swarm pattern search method for bound constrained global optimization. Journal of Global Optimization, 39(2):197–219, 2007.
[16] R. Hooke and T. A. Jeeves. “direct search” solution of numerical and statistical problems. Journal of ACM, 8(2):212–229, 1961.
[17] R.M. Lewis and V. Torczon. Pattern search algorithms for bound constrained minimization. SIAM Journal on Optimization, 9(4):1082– 1099, 1999.
[18] C. Audet and J. E. Dennis. Mesh adaptive direct search algorithms for constrained optimization. SIAM Journal on Optimization, 17(1):188– 217, 2007.
[19] D. R. Jones, C. D. Perttunen, and B. E. Stuckman. Lipschitzian optimization without the lipschitz constant. Journal of Optimization
Theory and Applications, 79(1):157–181, 1993.
[20] W. Huyer and A. Neumaier. Global optimization by multilevel coordi-nate search. Journal of Global Optimization, 14(4):331–355, 1999. [21] P. Gilmore and C. T. Kelley. An implicit filtering algorithm for
optimization of functions with many local minima. SIAM Journal on
Optimization, 5(2):269–285, 1995.
[22] X.-G. Zhu, E. de Sturler, and S. P. Long. Optimizing the distribution of resources between enzymes of carbon metabolism can dramatically in-crease photosynthetic rate: A numerical simulation using an evolutionary algorithm. Plant Physiology, 145:513–526, 2007.
[23] K. Deb, A. Pratap, S. Agarwal, and T. Meyarivan. A fast and elitist multiobjective genetic algorithm: NSGA-II. IEEE Transactions on Evolutionary Computation, 6(2):182–197, 2002.
[24] E. Jen. Robust Design: A Repertoire of Biological, Ecological, and
Engineering Case Studies. Oxford University Press, 2005.
[25] H. Mohr and P. Schopfer. Plant Physiology. Springer Verlag, 1995. [26] C. A. Raines. The calvin cycle revisited. Photosynthesis Research,
75:1–10, 2003.
[27] S. Takahashi, H. Bauwe, and M. Badger. Impairment of the pho-torespiratory pathway accelerates photoinhibition of photosystem II by suppression of repair but not acceleration of damage processes in Arabidopsis. Plant Physiology, 144(1):487–494, 2007.
[28] S. F. Altschul, T. L. Madden, A. A. Schaffer, J. Zhang, Z. Zhang, W. Miller, and D. J. Lipman. Gapped BLAST and PSI-BLAST: a new generation of protein database search programs. Nucleic Acids Research, 25(17):3389–3402, 1997.
[29] S. Lefebvre, T. Lawson, O. V. Zakhleniuk, J. C. Lloyd, and C. A. Raines. Increased sedoheptulose-1,7-bisphosphatase activity in trans-genic tobacco plants stimulates photosynthesis and growth from an early stage in development. Plant Physiology, 138(451–460), 2005. [30] M. Tamoi, M. Nagaoka, Y. Miyagawa, and S. Shigeoka. Contribution
of fructose-1,6-bisphosphatase and sedoheptulose-1,7-bisphosphatase to the photosynthetic rate and carbon flow in the calvin cycle in transgenic plants. Plant Cell Physiology, 47(380–390), 2006.
[31] J. G. Canadell, C. Le Qu´er´e, M. R. Raupach, C. B. Field, E. T. Buitenhuis, P. Ciais, T. J. Conway, N. P. Gillett, R. A. Houghton, and G. Marland. Contributions to accelerating atmospheric CO2 growth from economic activity, carbon intensity, and efficiency of natural sinks.
Proceedings of the National Academy of Sciences, 104(47):18866–
18870, 2007.
[32] C. B. Field, M. J. Behrenfeld, J. T. Randerson, and P. Falkowski. Primary production of the biosphere: integrating terrestrial and oceanic components. Science, 281(5374):237–240, 1998.
[33] M. P. Coughlan. The properties of fungal and bacterial cellulases with comment on their production and application. Biotechnology & Genetic

![[PDF] Visual Basic cours avance pour apprendre les bases de la programmation | Cours visual basic](data:image/gif;base64,R0lGODlhAQABAIAAAP///wAAACH5BAEAAAAALAAAAAABAAEAAAICRAEAOw==)