HAL Id: hal-03013469
https://hal.archives-ouvertes.fr/hal-03013469
Submitted on 23 Nov 2020
HAL is a multi-disciplinary open access
archive for the deposit and dissemination of
sci-entific research documents, whether they are
pub-lished or not. The documents may come from
teaching and research institutions in France or
abroad, or from public or private research centers.
L’archive ouverte pluridisciplinaire HAL, est
destinée au dépôt et à la diffusion de documents
scientifiques de niveau recherche, publiés ou non,
émanant des établissements d’enseignement et de
recherche français ou étrangers, des laboratoires
publics ou privés.
TCR signal diversification extent and dynamics
Guillaume Voisinne, Kristof Kersse, Karima Chaoui, Liaoxun Lu, Julie Chaix,
Lichen Zhang, Marisa Goncalves Menoita, Laura Girard, Youcef Ounoughene,
Hui Wang, et al.
To cite this version:
Guillaume Voisinne, Kristof Kersse, Karima Chaoui, Liaoxun Lu, Julie Chaix, et al.. Quantitative
interactomics in primary T cells unveils TCR signal diversification extent and dynamics. Nature
Immunology, Nature Publishing Group, 2019, 20 (11), pp.1530 - 1541. �10.1038/s41590-019-0489-8�.
�hal-03013469�
1Centre d’Immunologie de Marseille-Luminy, Aix Marseille Université, INSERM, CNRS, Marseille, France. 2Institut de Pharmacologie et de Biologie
Structurale, Département Biologie Structurale Biophysique, Protéomique Génopole Toulouse Midi Pyrénées CNRS UMR 5089, Toulouse, France.
3School of Laboratory Medicine, Xinxiang Medical University, Xinxiang, China. 4Laboratory of Mouse Genetics, Institute of Psychiatry and Neuroscience,
Xinxiang Medical University, Xinxiang, China. 5Centre d’Immunophénomique, Aix Marseille Université, INSERM, CNRS UMR, Marseille, France.
6Laboratory of Immunophenomics, School of Laboratory Medicine, Xinxiang Medical University, Xinxiang, China. *e-mail: [email protected];
[email protected]; [email protected]
T
cells express TCRs on their surface, through which they detect antigens. The initiation of TCR signals relies on the LCK and ZAP70 protein tyrosine kinases (PTKs) and gener-ates protein assemblages of considerable complexity1–3. Mostprevi-ous approaches aiming at disentangling such complexity addressed one protein at a time, with limited quantitative insight. As a result, it remains difficult to understand how the TCR signal-transduction network processes signals and to predict the effects resulting from a mutation or a drug.
Affinity purification of a protein of interest (the ‘bait’) with its interacting partners (the ‘preys’), coupled with mass spectrometry (AP–MS), permits the definition of the composition of the corre-sponding protein complex as a set of binary bait–prey interactions, termed an ‘interactome’. We provided proof-of-concept for interac-tomics in primary CD4+ T cells by determining the composition
of the multiprotein complexes that formed around ZAP70 and the adaptors LAT and SLP-76 (ref. 4). However, that pilot study was
lim-ited to three baits and relied on pervanadate-based T cell activation, a stimulation condition that is less physiological than that result-ing from engagement of the TCR in combination with CD4 or CD8 coreceptors. Here, we extended our interactomics approach to sig-naling complexes (‘signalosomes’) that assemble around 15 canoni-cal proteins used by the proximal TCR signal-transduction network. We avoided the pitfalls associated with transformed T cells5 by using
primary CD4+ T cells, and we captured signaling dynamics by
ana-lyzing each of the 15 signalosomes before and at four different time
points after anti-TCR plus anti-CD4 stimulation. A total of 277 unique proteins involved in 366 high-confidence protein–protein interactions (PPIs) were identified within the proximal TCR signal-transduction network, a complexity that led us to revisit the mode of action of several signalosomes used by the TCR.
TCR signals are classically described as proceeding from the TCR to the inside of T cells via the LAT transmembrane adaptor, which is thought to serve as the earliest and often sole point of sig-nal diversification downstream of the TCR2. In our original
interac-tomics study, we showed that the transmembrane receptor CD6 was also able to nucleate its own signalosome in response to TCR signal-ing, and independently of LAT4. However, the lack of information
on the numbers of complexes nucleating around LAT and CD6 pre-cluded assessing their respective quantitative contribution to early TCR signal propagation and diversification. Here, by capitalizing on the recent possibilities to measure both the numbers of copies per cell (cellular protein abundance) of each interacting protein, and the quantitative relationship existing between a bait and a prey in a given complex (interaction stoichiometry)6, we succeeded in
iden-tifying and quaniden-tifying the TCR-inducible signalosomes that form at the inner face of the plasma membrane. Unexpectedly, the CD5 and CD6 transmembrane receptors assembled signalosomes with kinetics and in numbers comparable to those nucleated by the LAT adaptor, demonstrating that the breadth of early TCR signal diversi-fication is larger than expected. Finally, to decipher the function of the poorly characterized interacting proteins identified within the
Quantitative interactomics in primary T cells
unveils TCR signal diversification extent
and dynamics
Guillaume Voisinne
1, Kristof Kersse
1, Karima Chaoui
2, Liaoxun Lu
3,4, Julie Chaix
1, Lichen Zhang
3,
Marisa Goncalves Menoita
1, Laura Girard
1,5, Youcef Ounoughene
1, Hui Wang
3, Odile Burlet-Schiltz
2,
Hervé Luche
5,6, Frédéric Fiore
5, Marie Malissen
1,5,6, Anne Gonzalez de Peredo
2, Yinming Liang
3,6*,
Romain Roncagalli
1* and Bernard Malissen
1,5,6*
The activation of T cells by the T cell antigen receptor (TCR) results in the formation of signaling protein complexes (signalo
somes), the composition of which has not been analyzed at a systems level. Here, we isolated primary CD4+ T cells from
15 genetargeted mice, each expressing one tagged form of a canonical protein of the TCRsignaling pathway. Using affinity puri fication coupled with mass spectrometry, we analyzed the composition and dynamics of the signalosomes assembling around each of the tagged proteins over 600 s of TCR engagement. We showed that the TCR signaltransduction network comprises at least 277 unique proteins involved in 366 highconfidence interactions, and that TCR signals diversify extensively at the level of the plasma membrane. Integrating the cellular abundance of the interacting proteins and their interaction stoichiometry provided a quantitative and contextual view of each documented interaction, permitting anticipation of whether ablation of a single interacting protein can impinge on the whole TCR signaltransduction network.
Cb l Inpp5d Lc k Ptpn6 Ptpn22 Nfatc 2 Itk Nck1 Fy b Grb 2 Lcp2 Cblb Vav1 Plcg 1 Themis Repeat Ribosomal protein Ribonucleoprotein Endosome Dynein
Guanine-nucleotide releasing factor SH2 domain
GRB2/sem-5/DRK family SH3 domain
VAMP-associated protein (VAP) (TC 9.B.17) family Tyrosine-protein kinase
Tyr protein kinase family SKAP family Ena/VASP family 14-3-3 family SH3-binding Immunoglobulin domain Signal DNA condensation Immunity Adaptive immunity Synapse Proto-oncogene Golgi apparatus Endocytosis 3D-structure Proteasome Prohibitin family PI3K p85 subunit family PI3/PI4-kinase family Mitochondrion inner membrane F-actin-capping protein alpha subunit family CRK family
CF(1) AccD/PCCB family AAA ATPase family
Rps17 Rps10 Lax1 Actr1a Rpl30 Atp5d Psmc1 Rpl23 Snrpd3 Gsr Ywhag Ywhab Ywhaq Ywhah Ywhaz Ptpn22 Cd6 Cd5 Csk Pstpip1 Nt5dc3 Dnah2 Vav3 Akap9 Ccm2l Smarca4 Dctn1 Arhgap27 Slp-76 Rps14 Rps19 Rps20 Ubash3b Cblb Rps16 Slc5a4b Crkl Eps15l1 Itsn2 Psmd11 Ywhae Ccar2 Sla Grap2 Themis Lat Map4k1 Hck Plcγ1 Vav1 Ubash3a Lrrc59 Ddost Ptprc Phb2 Phb Psmc2 Cd2 Hspa8 Rac2 Pdcd4 Psmd12 Slc25a5 Stat1 Psmc3 Gnai2 Ifggd1 Psmc5 Psmd13 Skap2 Nxt1 Rasa1 Gon4l Zscan29 Ppp1r12a Smg1 Khdrbs1 Sec11a Prrc2a Trim28 Cct5 Cd28 Ppp1cb Evl Ppil1 Fyb Snw1 Erich5 Gm9476 Mcm3 Kbtbd11 Pdzd8 Cd3g H2-K1 Fyn B4galnt1 Rasal3 Skap1 Vapa Nxf1 Ddx3x Mcm5 Prpf31 Vasp Traf7 Rnmt Abl1 Vapb Ppp3cb Ccdc146 Creb1 Xrcc6 Smarca5 Cct7 Nfatc2Hist1h2bc H2-D1 Acaca Capza1 Cbl Pik3r2 Hnrnpm Rpl7a Tubb4b Rpl10 Atp5a1 Tuba4a Mccc2 Pik3cb Hist1h1a Ptpra Dnm1 Wipf1 Sord Sos2 Kdelc1 Chd5 Sos1 Grb2 Shc1 Eif3c Shp1 Btla Nck1 Psmd3 Tubb5 Pcbp1 Pik3ca Mccc1 Tapbp Sh3kbp1 Capzb COX2 Itgb2 Uqcrc1 Psmc6 Phgdh Rpl27a Sdha Pccb Psmd6 Crk Tmpo Gnb2 Atp5c1 Atp5b Vdac1 Samhd1 Rpl6 Arap1 Inppl1 Ship1 Dbnl Dok2 Grap Gm10250 Vdac2 Pik3r1 Hspa9 Capza2 Pik3cd Rplp0 Tardbp Ruvbl1 Cd2ap Hsp90aa1 St13 Ncapd2 Faah Sugt1 Fkbp5 Hsp90ab1 Stoml2 Cdc37 Rpn1Rab5c Cand1 Ipo5 Sun2 Pgrmc2 Ptrh2 Smc2 Atp1a1 Mogs Tuba1b Rab11b Hsd17b12 Smc4 Esyt1 Ppp2r1a Copg1 Zap70 Trac Canx Hadhb Cd247 Cd3e Ptprcap Far1 Trbc1 Dock2 Elmo1 Ighv5-6 Lck Atp5f1 Cnp Lrpprc Ecm29 Sh2d2a Faf2 Ankrd13a Nucb1 Acadl Ly9 Ncaph Pds5a Hsdl1 Dnaja2 Rpn2 Slc25a12 Tmed10 Ostc Ipo7 Ifi47 Psmd7 Trim21 Xpo1 Fkbp8 Mlec Pfkp Nop9 Fmnl1 Cyb5b Raver1 Tap2 Gimap5 Tap1 Mms19 Mybbp1a Tmx1 M6pr Irgm1 Nfkb1 Tfrc Cd4 Dgka Psmd14 Lime1 Umps Tnpo1 b 0 100 200 0 30 120 300 600 c Nint (t ) Time (s) Reported Not reported Interaction Nck1 Themis Itk Plcγ1 Ptpn22 Shp1 Nfatc2 Vav1 Ship1 Slp-76 Grb2 Cblb Fyb Cbl Lck Time (s) 1 3 10 30 100 Number of bait–prey interactions Bait Reported Not reported Interaction Reported Not reported Bait Prey Interaction a Interaction stoichiometry Relative protein abundance Interaction specificity Time TCR Stimulation Ost Bait Prey A d Annotation term Enriched Not enriched Not represented Annotation term is Bait e norm_Nint 0.00 0.25 0.50 0.75 1.00 0 30 120 300 600
Gene-targeted mice expressing tagged form of 15 canonical
components of the TCR signaling pathway OST tag sequence -Primary CD4+ T cells
Affinity purification and quantitative proteomics analysis of the complexes
assembling around the tagged proteins over stimulation time
Composition, stoichiometry and dynamics of 15 signalosomes involved
in the propagation of proximal TCR signals at unprecedented resolution
Itk
Prey B
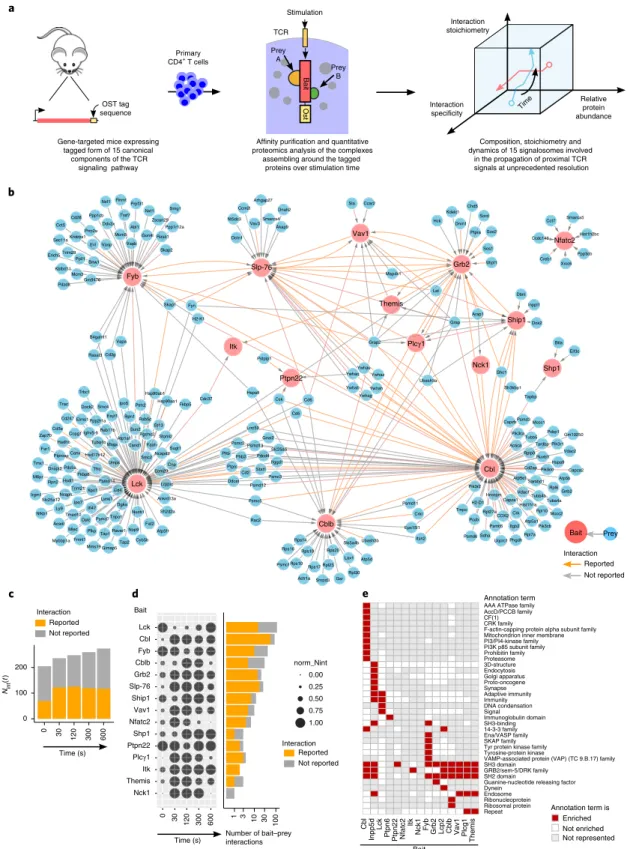
Fig. 1 | Composition of the protein–protein network assembling around 15 canonical proteins of the TCR-signaling pathway over 600 s of stimulation. a, Workflow schematic for mapping the composition, stoichiometry and dynamics of the signaling complexes assembling around 15 canonical proteins of
the TCR-signaling network of primary CD4+ T cells before and after TCR activation for 30, 120, 300 and 600 s. b, High-confidence interactome forming
around the 15 baits. High-confidence bait–prey interactions were defined as having an FDR value ≤3% for two consecutive time points of stimulation (see ‘Statistics and data reproducibility’ in Methods). OST-tagged baits and preys are represented in red and blue, respectively. Interactions already reported in databases are highlighted using orange arrows. In most interactomes, several preys associate to a given bait and might contact it directly or indirectly
through intermediary proteins. c, Evolution over the course of TCR stimulation of the number of high-confidence bait–prey interactions, a value termed
Nint(t) with ‘t’ corresponding to the time of stimulation. The proportion of these already reported in public databases is shown in orange. d, In the dot plot
(left), the Nint(t) values corresponding to each bait have been row-normalized to the maximum value it reached over the course of stimulation (see key).
Also shown (right) using a log10 scale is the number of high-confidence bait–prey interactions corresponding to each bait, and the proportion of these that
has been reported already. e, Annotation terms from Uniprot-Keywords and Uniprot-Protein families enriched in at least one of the 15 interactomes.
TCR-signaling network, we developed a CRISPR/Cas9-based pipe-line that requires no mouse breeding and permits us to analyze in 4 months and, at organismal levels, the immune phenotype of mice deprived of select interacting proteins.
Results
Mapping the TCR signal-transduction network of primary T cells. To make the TCR signal-transduction network of
pri-mary T cells amenable to quantitative AP–MS analysis, we devel-oped 15 lines of gene-targeted mice, each containing a canonical protein of the TCR-signaling network tagged at its amino (N) or carboxy (C) terminus with an affinity Twin-Strep-tag (OST) (Fig. 1a). Mice expressing the OST-tagged version of the cytosolic adaptors SLP-76 (LCP2) and GRB2, of the guanine nucleotide exchange factor VAV1 and of the evolutionarily related E3 ubiquitin-protein ligases CBL and CBLB have been described4,7–9. Here, we
intro-duced ten additional OST-tagged mouse lines corresponding to the phosphatidylinositol 3,4,5-trisphosphate 5-phosphatase 1 SHIP1 (INPP5D), the PTKs LCK and ITK, the phospholipase PLC-γ1, the cytosolic adaptors NCK1, THEMIS and FYB (ADAP), the PTPases SHP1 (PTPN6) and PTPN22, and the NFATc2 transcription factor (Supplementary Fig. 1a and Methods). Analysis of mice homozy-gous for each of the OST-tagged alleles showed that their T cells developed properly (Supplementary Fig. 1b), yielding normal num-bers of mature CD4+ and CD8+ T cells (Supplementary Fig. 1c) that
had no defect in proliferation (Supplementary Fig. 1d), cytokine production (Supplementary Fig. 1e) and tyrosine phosphoryla-tion (Supplementary Fig. 2) in response to TCR stimulaphosphoryla-tion. T cells expressed the bait proteins at physiological levels (Supplementary Fig. 3a), and, after lysing them with the nonionic detergent
n-dodecyl-β-d-maltoside, bait proteins were efficiently purified using Sepharose beads coupled to Strep–Tactin (Supplementary Fig. 3b,c), obviating potential variations resulting from the use of antibody specific for each bait.
Purified primary CD4+ T cells were briefly expanded in vitro
to reach the substantial cell numbers required for AP–MS (see Methods). Our results thus reflect the composition of the TCR-signaling network of antigen-experienced conventional CD4+
T cells. To capture signaling dynamics, we defined, by AP–MS, the preys assembling around each bait before or after stimulation through cross-linkage of the TCR and CD4 for 30, 120, 300 and 600 s (Fig. 1a). For each time point, three independent biological repli-cates were performed and each biological replicate was analyzed in duplicate or triplicate by MS (technical replicates). To distinguish truly interacting proteins from nonspecific contaminants, we com-pared our data with control AP–MS experiments involving wild-type CD4+ T cells (Supplementary Fig. 4a,b). Data corresponding
to 449 affinity purifications and 933 MS runs were analyzed using the MaxQuant software, and high-confidence interactors identified using a data-driven, false discovery rate (FDR)-controlled approach (ref. 6 and Methods). FDR values were used to evaluate the statistical
significance of the enrichment observed at a given time point for a considered bait–protein interaction between CD4+ T cells isolated
from OST-tagged and wild-type (control) mice (Supplementary Fig. 4c–e). High-confidence bait–prey interactions were defined as having FDR ≤ 3% for two consecutive time points of stimulation. We also measured the stoichiometry of bait–prey interactions using intensity-based absolute quantification (iBAQ)10, and determined
their changes after TCR engagement. The composition, stoichi-ometry and dynamics of the 15 interactomes are summarized in Supplementary Dataset 1.
Global analysis of the TCR signal-transduction network. Analysis
of the interactomes assembling around each of the 15 baits revealed a bait–prey network composed of 277 unique proteins connected via 366 high-confidence interactions (Fig. 1b). Among them, 162 interactions have already been reported in human and mouse PPI databases that compile several cell types (Fig. 1c). As expected for a ligand-inducible signal-transduction PPI network, most of the 15 interactomes reached their highest complexity after TCR triggering (Fig. 1d). Such complexity peaked between 30 and 300 s in the case of the CBLB, GRB2, SLP-76, VAV1 and PLC-γ1 interactomes, and persisted up to 600 s of stimulation for the CBL and SHIP1 interac-tomes. Conversely, several of the preys found in the LCK and FYB interactomes were quickly released on TCR triggering.
The numbers of high-confidence bait–prey interactions varied widely across the analyzed baits, ranging from 1 (NCK1 bait) to 117 (LCK bait) (Fig. 1d). Only 20% of the identified preys were found in more than one interactome, suggesting that each of the selected baits exerts specific functions within the TCR-signaling network. In line with this, annotation enrichment analysis showed that several inter-actomes were enriched for unique biological processes, molecular functions, interacting protein domains and families (Fig. 1e). The annotations ‘SH2 domain’ and ‘SH3 domain’ were, however, shared by 9 and 10 of the 15 interactomes, respectively, reflecting the key role both domains play in shaping the TCR PPI network. Therefore, by identifying 366 high-confidence PPI within the proximal TCR signal-transduction network our approach revealed a complexity that was higher than expected.
Bait–prey interaction stoichiometries over the course of TCR stim-ulation. The median value of the distribution of the stoichiometries
observed for all the documented bait–prey interactions increased following TCR activation (Fig. 2a), reflecting formation of protein
Fig. 2 | evolution over 600 s of TCR stimulation of bait–prey interaction stoichiometry among the 15 interactomes. a, Distribution of the interaction
stoichiometries of the 366 high-confidence bait–prey interactions observed for the 15 baits at each of the analyzed time points. Horizontal red lines
correspond to median values and previously reported interactions are highlighted in orange. Note that 100 = 1. b, Each dot plot corresponds to a given
bait (denoted in red) and shows its interaction stoichiometry over the course of TCR stimulation with its 16 highest confidence preys (denoted in black and ranked according to their FDR value and maximum enrichment; see key for FDR color code). The total number of high-confidence interactions (n) established by a given bait is shown at the top of each dot plot (for instance n = 87 in the case of the CBL bait, and the full list of the 87 interactions can be found in the worksheet tab labeled ‘CBL’ of Supplementary Dataset 1). For a given bait–prey interaction, the interaction stoichiometry has been row-normalized to its maximum value observed over the course of TCR stimulation (Normal. stoichiometry). For instance, the FYB and LAT preys show a maximal binding to SLP-76 before and after 30 s of activation, respectively. Also shown on the right side of each dot plot is the maximal interaction stoichiometry (Maximum stoichiometry) reached by each of the documented bait–prey interactions over the course of TCR stimulation (dot size is commensurate with the value of the maximal interaction stoichiometry; see key). Orange and gray dots correspond to previously reported and undocumented interactors, respectively. In the case of a ‘rich’ interactome, as exemplified by the CBL interactome, all the 16 represented preys qualify as high-confidence preys, in that they all show FDR ≤ 3% at two consecutive time points of stimulation. In contrast, in the case of a ‘sparse’ interactome, as exemplified by the NCK1 interactome, a single prey (ARAP1) fulfills our stringent high-confidence criteria. The ACTBL2, PLBD1 and TMED10 preys
interacted with NCK1 with an FDR ≤ 3% at a single condition of stimulation (t30s), whereas preys such as WAS and TTN have FDR ≤ 6%. Such bait–prey
interactions of lower confidence are listed in the tab ‘bait–prey interactions’ of Supplementary Dataset 1. Note that an FDR of 100% means that the prey does not interact with the bait at the considered time point.
assemblages of increasing complexity. The maximal interaction stoichiometries reached by the 366 documented bait–prey inter-actions over the course of TCR stimulation covered five orders of magnitude, ranging from 10–5 to 1.6, with a median value close
to 10–3. Among the PPIs described in the present study, those
not reported in public databases showed a bias toward lower stoichiometry (Fig. 2a), highlighting the increased analytical depth afforded by the sensitivity of AP–MS compared with con-ventional biochemical approaches. Therefore, low-stoichiometry PPIs play a central role in the organization of the TCR-signaling
0 30 120 300 600 Reported Not reported Interaction stoichiometry Time (s) a Crkl Ubash3a Pik3r1 Sh3kbp1 Fyn Ywhag Inpp5d Pik3r2 Pik3ca Pik3cd Grb2 Itsn2 Grap Ywhah Ywhab 0 30 120 300 600 Cbl
Time (s) Maximum stoichiometry Normal. stoichiometry (n = 87) Ubash3b Ubash3a Grap Crkl Grb2 Slc5a4b Itsn2 Cd5 Eps15l1 Csk Lax1 Rpl23 Cd6 Grap2 Rpl30 0 30 120 300 600 Cblb
Time (s) Maximum stoichiometry Normal. stoichiometry (n = 30) Skap2 Skap1 Fyn Nxf1 Ppp1r12a Grap2 Gon4l Snw1 Zscan29 Prpf31 Traf7 Prrc2a Cd28 Lck Ppp1cb 0 30 120 300 600 Fyb
Time (s) Maximum stoichiometry Normal. stoichiometry (n = 42) Time (s) Lat Shc1 Grap Themis Slp-76 Vav1 Grap2 Ship1 Chd5 Sos1 Kdelc1 Cblb Ptpra Ubash3a Sord 0 30 120 300 600 Grb2 Maximum stoichiometry Normal. stoichiometry Shc1 Grb2 Ship2 Sh3kbp1 Dok2 Grap Lat Cbl Ubash3a Dbnl Grap2 Fyn Wdr44 Crkl Lck 0 30 120 300 600 Ship1
Time (s) Maximum stoichiometry Normal. stoichiometry(n = 12) (n = 21) Cdc37 Grb2 Grap2 Tuba1c Dnaja1 Spcs2 Fyb Zranb1 Cry1 Smarcc1 Ttn Ipo5 M6pr Cpne1 Raver1 0 30 120 300 600 Itk
Time (s) Maximum stoichiometry
Normal. stoichiometry(n = 2) (n = 113) Cd4 Fyb Skap1 Zap70 Acadl Fyn Cd3g Cd3e Trim21 Lime1 Cd247 Cdc37 Trbc1 Cand1 Tnpo1 0 30 120 300 600 Lck
Time (s) Maximum stoichiometry Normal. stoichiometry Vav1 Cd6 Grap Grap2 Lat Plcg1 Nt5dc3 Map4k1 Fyb Skap1 Grb2 Ubash3a Ywhag Ywhab Ywhaq 0 30 120 300 600 Slp-76
Time (s) Maximum stoichiometry Normal. stoichiometry(n = 26) Arap1 Actbl2 Plbd1 Tmed10 Jak3 Was Ttn Rps24 Cd47 Cox6c Mpo Ltf Rpl18 Mical1 Ndufa4 0 30 120 300 600 Nck1
Time (s) Maximum stoichiometry Normal. stoichiometry (n = 1) Ccdc146 Ppp3cb Creb1 Cct7 Xrcc6 Smarca5 Hist1h2bc Prss1 Naglu Myh4 Cbx3 Actbl2 Top2b Hist1h2al Parp1 0 30 120 300 600 Nfatc2
Time (s) Maximum stoichiometry Normal. stoichiometry (n = 7) Grap Ship1 Grap2 Grb2 Slp76 Cblb Map4k1 Lat Actbl2 Spag5 Ranbp2 Mast2 Pdlim2 Dst Dnah2 0 30 120 300 600
Time (s) Maximum stoichiometry Normal. stoichiometry (n = 4) Eif3c Btla Tapbp Cdk5rap3 Rpl35a Mybbp1a Atp5k Isyna1 Atp5c1 Sf3a1 Qars Pgam5 Purb Ptpn12 Eif3a 0 30 120 300 600 Shp1 Time (s) Maximum stoichiometry Normal. stoichiometry (n = 3) Csk Pstpip1 Ywhaq Ubash3a Macf1 Ppp2r2a Ppp2cb Ppp2r1a Vapa Ywhah Mcm5 Sdhb Ptk2b Eif4e Dnaja1 0 30 120 300 600 Ptpn22 Time (s) Maximum stoichiometry Normal. stoichiometry (n = 3) Grb2 Grap Grap2 Acsbg2 Lat Eif4g1 Anxa6 Ahsa1 Bin1 Hspa8 Srprb Tacc1 H1f0 Hba−a2 Lrmp 0 30 120 300 600 Themis
Time (s) Maximum stoichiometry
Normal. stoichiometry (n = 3) Slp-76 Grap2 Map4k1 Grb2 Lat Sla Grap Cd6 Ccar2 Themis Plcg1 Fyn Anxa6 rhgdib Got2 0 30 120 300 600 Vav1
Time (s) Maximum stoichiometry
Normal. stoichiometry (n = 10) 1.00 0.75 0.50 0.25 0.00 ≤ 100% ≤ 12% ≤ 6% ≤ 3% 100 10–1 10–2 10–3 <10–4 Reported Not reported
Size code Color code
Size code FDR color code
Normal. stoichiometry Maximum stoichiometry
100 10–1 10–2 10–3 10–4 10–5 b Plcγ1
network, making them prone to disruption in experiments relying on bait overexpression.
Dot plots were used to depict the normalized interaction stoichi-ometry of each bait with its 16 most-enriched preys over the course of TCR stimulation (Fig. 2b). The maximum interaction stoichiom-etry value reached over the course of stimulation was also shown. Note that interaction stoichiometry values can be stoichiometric (the bait and the prey interact with a 1:1 ratio), superric (the bait and the prey interact with a greater than stoichiomet-ric ratio) or substoichiometstoichiomet-ric (only a fraction of the bait interacts with a given prey). For instance, a bait such as VAV1 established transient and substoichiometric interactions with most of its preys. In contrast, SLP-76 interacted with GRAP2 (GADS) in a superstoichiometric and constitutive manner, whereas SLP-76 interactions with LAT, VAV1 and PLC-γ1 were transient and sub-stoichiometric (Fig. 2b).
Integrating cellular protein abundances and interaction stoichi-ometries. CD4+ T cells isolated from the 15 OST-tagged mice and
from wild-type mice were briefly expanded, as for AP–MS analysis, and the copy numbers per T cell (cellular protein abundance) of the distinct proteins they expressed were determined using whole-cell proteome analysis11. We were able to quantify 6,343 proteins that
corresponded to 92% of the high-confidence preys identified here (Supplementary Dataset 2). The cellular abundances of the proteins used as baits were spread over two orders of magnitude, ranging from 1.3 × 10³ for ITK to 2.6 × 10⁵ for SHP1 (Fig. 3a). Consistent
with immunoblot analysis (Supplementary Fig. 3a), the OST-tagged
proteins showed cellular abundances comparable to those of their wild-type counterparts (Supplementary Fig. 5).
By combining cellular protein abundances and interaction stoichiometries, each of the 15 signalosomes was organized into a ‘stoichiometry plot’6. Accordingly, for each documented bait–prey
interaction the ratio of the bait to prey cellular abundance was plot-ted as a function of the maximal interaction stoichiometry reached by the considered bait–prey interaction over the course of TCR stim-ulation (Fig. 3b). This showed that a few (7%) of the identified high-confidence bait–prey interactions fell within a confined zone that is denoted as the ‘core interactions area’ and encompasses most of the permanent mammalian protein complexes collated in the CORUM database12 (Fig. 3b). Among these are the FYB–SKAP1 (ref. 13) and
the SLP-76–GRAP2 (ref. 14) permanent complexes, as well as
TCR-inducible complexes that remained stable for several minutes after TCR stimulation as illustrated by phosphoserine-based complexes involving SLP-76 and three members of the 14-3-3 protein family (YWHAG, YWHAB and YWHAQ), and a complex involving CBLB and the PTPases UBASH3A and UBASH3B (Fig. 3c).
A region corresponding to bait–prey interactions involving at least 10% of the bait or prey expressed in a given T cell is also highlighted (Fig. 3b,c; light gray). The functional relevance of such interactions can be illustrated by the interaction observed between SHIP1 and its close relative SHIP2 (INPPL1) (Fig. 4), a PPI pre-viously reported in platelets15. By catalyzing the hydrolysis of the
phosphatidylinositol 3-kinase (PI3K) product, PtdIns(3,4,5)P3,
into PtdIns(3,4)P2, SHIP1 and SHIP2 regulate effectors
contain-ing PtdIns(3,4,5)P3- or PtdIns(3,4)P2-selective pleckstrin homology −2 −1 0 1 2 −4 −3 −2 −1 0 1 0 20 40 0 20 40 100% of prey is bound to bait Core interactions area Interactions involving more than 10% of prey
or bait Ratio of prey to bait abundance (log
10
)
Maximal interaction
stoichiometry (log10) Counts
Counts Sord Arap1 Kdelc1 Grb2 Ship1 Chd5Map4k1 Lat Themis Shc1 Mccc1 Atp5b Fyn Mccc2 Tubb5 Pccb Cbl Pik3ca Crkl Acaca Grap2 Skap1 Hist1h2bc Skap2 Btla Lck Nfatc2 Fyb Lime1 Shp1 Cd4 Grap Hspa8 Ubash3a Pstpip1 Csk Ptpn22 Cblb Ubash3b Ship2 Ywhaz Ywhaq Slp-76 Ywhae Ywhah YwhagYY Ywhab
Interactions involving more than 10% of prey or bait
Protein abundance Itk Ptpn22Cblb Cbl Plcγ1 Nfatc2Fyb Nck1 Ship1Vav1 ThemisSlp-76 Lck Grb2 Shp1 0 200 400 600 800 Counts a b c Induced assembly Induced disassembly Not regulated 102 104 106 108
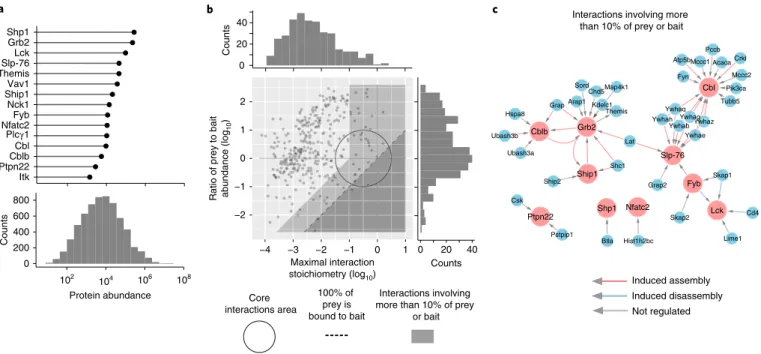
Fig. 3 | Organizing the 15 interactomes using cellular protein abundance and interaction stoichiometry. a, Cellular abundance distribution of the protein
baits used for AP–MS (upper panel) and of the 6,343 proteins that were quantified in CD4+ T cells used for AP–MS (lower panel). Cellular abundances
are shown as mean protein copy number per CD4+ T cell. b, Stoichiometry plot permits organization of each interactome. For each documented bait–prey
interaction the ratio of bait to prey cellular abundance (‘abundance stoichiometry’ in log10 scale) was plotted as a function of the maximal interaction
stoichiometry reached by the considered bait–prey interaction over the course of TCR stimulation (‘interaction stoichiometry’ in log10 scale)6.
The stoichiometry plot represented in this panel corresponds to an overlay of the stoichiometry plots generated for each of the 15 baits (see Fig. 4).
Each dot corresponds to one high-confidence bait–prey interaction. The circle (center: −0.5, radius: 1 in log10 scale) delimits the ‘core interactions area’
(see Results). The limit imposed on interaction stoichiometries by the relative bait–prey cellular abundance is shown by a dashed diagonal line that delimits a ‘forbidden’ area (dark gray). Dots lying on the dashed diagonal correspond to preys where 100% of them are bound to the corresponding bait in at least one of the stimulation conditions. The area including PPIs involving more than 10% of the prey, or of the bait, is also indicated (light gray). The distribution of the maximal bait–prey interaction stoichiometry and of the ratios of the prey to bait abundance are shown in the top and right margins,
respectively. c, Bait–prey interactions involving more than 10% of the prey or of the bait. Baits and preys are denoted in red and blue, respectively.
(PH) domains. Up to 1.3% of SHIP1 molecules were found associ-ated with SHIP2 (Fig. 4), and such low interaction stoichiometry can be viewed as functionally inconsequential. However, consider-ing that SHIP2 is 31-fold less abundant than SHIP1 in CD4+ T cells,
41% of the SHIP2 molecules available in a CD4+ T cell are thus
asso-ciated with SHIP1 (Fig. 4). Accordingly, a SHIP1 deficiency will not only ablate a key enzymatic activity, but also free approximately half of the SHIP2 molecules present in CD4+ T cells from their
interac-tion with SHIP1, allowing them to engage in rival interacinterac-tions that might be beneficial or detrimental. Therefore, the possibility of inte-grating interaction stoichiometries and cellular abundances permits us to anticipate whether genetic or pharmacological perturbation of a single PPI can result in global network rewiring.
Accounting for the distinct function of the CBL and CBLB E3 ubiquitin-protein ligases. Our quantitative approach also
per-mitted a high-resolution comparison of the signalosomes that form around CBL and CBLB (Fig. 4). Both comprised a receptor expressed at the plasma membrane (CD5), molecules involved in endocytosis (ITSN2, EPS15L1), adaptors (GRB2, GRAP, CRKL) and proteins (UBASH3A and the PTK CSK) that concur to the neg-ative regulatory role of CBL and CBLB. Consistent with the distinct phenotypes of T cells deprived of CBL or CBLB, only CBL asso-ciated with FYN, six 14-3-3 protein family members, SH3KBP1, SHIP1 and several catalytic and regulatory subunits of PI3K. The co-recruitment of PI3K and SHIP1 by CBL likely sets in action pro-teins containing PH domains selective for PtdIns(3,4)P2 (refs. 16,17).
Conversely, CBLB was the sole protein capable of sustained inter-action with the UBASH3B PTPase. Importantly, 120 s after TCR engagement, CBLB associated with 58% of the available UBASH3B molecules, suggesting that the CD5–CBLB–UBASH3B axis pro-vides a major quantitative contribution to TCR signal termination through ZAP70 dephosphorylation18.
Accurate ab initio prediction of the GRB2 signalosome. The
stoichiometry of a few bait–prey interactions identified here have been previously reported (FYB–SKAP1 (ref. 13), SLP-76–GRAP2
(ref. 14) and THEMIS–GRB2 (ref. 19)). Although our AP–MS-based
stoichiometric calculations agreed with those reported values (Fig. 4), we further challenged their accuracy by testing their predic-tive power. Considering that the GRB2 adaptor constitutes a high-confidence prey in 9 of the 15 analyzed interactomes, we attempted to predict, ab initio, the stoichiometry of a simulated GRB2 inter-actome in which the nine baits binding to GRB2 play the role of preys. By combining the experimentally determined interaction stoichiometry of the nine baits with the GRB2 prey with their corresponding cellular abundances, we calculated the stoichiom-etry of ‘reciprocal’ interactions in which GRB2 constituted the bait (Fig. 5a and Methods). The resulting GRB2 interactome showed interaction stoichiometries that were in good agreement with those of the actual GRB2 interactome over all time points (Fig. 5b). Similar analysis of all the high-confidence interactions involving protein pairs corresponding to the 15 baits further supported the accuracy of our measurements (Fig. 5c). Such accuracy allowed us
to quantify the numbers of TCR-inducible complexes involved in TCR signal propagation and diversification.
Extensive TCR signal diversification occurs at the level of LAT.
By combining interaction stoichiometries and cellular protein abundances, we enumerated the maximum number of copies of each high-confidence bait–prey interaction that forms per T cell over the course of TCR stimulation. Since TCR signals are initiated at the plasma membrane, we specifically focused on those high-confidence interactions that form at the inner face of the plasma membrane and constitute seeds for signal propagation (Fig. 6a). Consistent with the view that LAT serves as an early point of signal diversification downstream of the TCR2,20, constitutive binary
com-plexes made of GRAP2–SLP-76, GRB2–SHIP1 and GRB2–THEMIS docked onto LAT following TCR engagement and nucleated the assembly of SLP-76-, SHIP1- and THEMIS-based signalosomes (Fig. 6b). Such seeds reached maximal numbers of copies per T cell 30 s after TCR engagement, ranging from about a hundred (LAT– GRB2–THEMIS) to several hundred (LAT–GRAP2–SLP-76 and LAT–GRB2–SHIP1) (Fig. 6b).
The signalosome assembling around the LAT–GRAP2–SLP-76 seed comprised PLC-γ1, the serine–threonine protein kinase MAP4K1 (HPK1), the FYB–SKAP1 binary complex, UBASH3A, GRB2, GRAP, six members of the 14-3-3 protein family, NCK1 and VAV1 (Fig. 7). The SLP-76–NCK1 interaction was of low stoi-chiometry and led to recruitment of the ARAP1 RHO-GAP with high confidence, of the WASp actin nucleation-promoting factor (WAS; FDR value of 4.7% at t600 s), and of the beta-actin-like
pro-tein 2 (ACTBL2; FDR ≤ 3% at t30s). VAV1 recruited the SRC-like
adaptor protein 1 (SLAP-1), two RHO GDP-dissociation inhibitors (ARHGDIA and ARHGDIB; both with FDR ≤ 3% at t30s) and the
small GTPase RHOA (FDR ≤ 3% at t30s) (Supplementary Dataset 1).
Therefore, when probed by AP–MS under physiological conditions, the signalosome nucleating around the LAT–GRAP2–SLP-76 seed couples the TCR to the production of inositol trisphosphate and diacylglycerol and to F-actin dynamics, a finding consistent with recent imaging studies21,22.
The signalosome that forms around the LAT–GRB2–THEMIS seed is thought to play a key role during T cell development, in part due to its association with SHP1 (refs. 23–25). SHP1 was, however,
lacking in the THEMIS interactome of mature CD4+ T cells (Fig. 7
and Supplementary Dataset 1). To confirm such an unanticipated finding, we analyzed whether THEMIS was present in the SHP1 interactome of mature CD4+ T cells. As expected, the B and T
lym-phocyte attenuator (BTLA26,27) was found among the SHP1 preys,
but THEMIS was still absent (Fig. 7). Along the same lines, the GRB2 interactome of mature CD4+ T cells contained THEMIS but
lacked SHP1 (Fig. 7), suggesting that THEMIS–GRB2–SHP1 ter-nary complexes primarily form in developing thymic T cells.
Consistent with the compound enzymatic and scaffolding role of SHIP1, the signalosome assembling around the LAT–GRB2– SHIP1 seed comprised several adaptors (GRB2, GRAP, SH3KBP1 (CIN85), SHC1 and DOK2), and associated with a lower inter-action stoichiometry to molecules such as UBASH3A, DBNL
Fig. 4 | Stoichiometry plots of the 15 baits. For each bait, the 20 bait–prey interactions with the largest enrichment and FDR ≤ 6% for at least one condition of stimulation are shown, and each stoichiometry plot is ‘zoomed’ on the area that includes them. Baits are shown as yellow dots. Red and blue dots correspond to preys that show an increased or decreased binding to the bait following TCR engagement. Gray dots correspond to preys whose association with the bait were not regulated by TCR stimulation. The size of the dots is commensurate with the maximal protein enrichment observed in
OST-tagged CD4+ T cell samples compared with wild-type control CD4+ T cell samples. For instance, the SLP-76 stoichiometry plot shows that GRAP2
is more abundant than SLP-76 and that it binds to SLP-76 in a constitutive and superstoichiometric manner. The six documented 14-3-3 family members (YWHAB, YWHAE, YWHAG, YWHAH, YWHAQ and YWHAZ) are more abundant than SLP-76 and interact with it in a TCR-induced manner and a stoichiometry in the range 1.5–0.2. Cytosolic effectors, such as VAV1 and PLC-γ1, are slightly less abundant than SLP-76, and interact with it in a TCR-induced manner and a stoichiometry in the 0.008 range. Preys for which it was not possible to determine the cellular abundance are shown at the bottom
of each stoichiometry plot. See Fig. 3b for a definition of the specified stoichiometry plot areas.
(an adaptor protein that binds F-actin), FYN and SHIP2 (Fig. 7 and Supplementary Dataset 1). Therefore, our quantitative and qualitative analyses of the SLP-76-, SHIP1- and THEMIS-based signalosomes emphasizes the unique contribution of LAT to TCR
signal diversification, the breadth of which should be even greater when taking in account that the guanine nucleotide exchange fac-tors SOS1 and SOS2 are also recruited via GRB2 to phosphorylated LAT molecules4. Induced assembly Induced disassemby Not regulated Bait Cbl Crkl Ubash3a Pik3r1 Sh3kbp1 Fyn Ywhag Ship1 Pik3r2 Pik3ca P P Pik3cd Grb2 Itsn2 Grap Ywhah Ywhab Crk Eps15l1 Ywhae Cd5 −2 −1 0 1 2 −3 −2 −1 0 Cblb Ubash3b Ubash3a Grap Crkl Grb2 Slc5a4b Itsn2 Cd5 Eps15l1 Csk Lax1 Rpl23 Cd6 Grap2 Rpl30 Rps17 Rps20 R R Rps19 Snrpd3 −1 0 1 2 −3 −2 −1 0 Fyb Skap2 Skap1 Fyn Nxf1 Ppp1r12a Grap2 Gon4l Snw1 Zscan29 Prpf31 9 Traf7 Prrc2a w nnw Cd28 Lck Ppp1cb Nxt1 Evl Slp76 Cct5 −2 −1 0 1 −4 −3 −2 −1 0 S Grb2 Lat Shc1 Grap Themis Slp76 Vav1 Grap2 Ship1 Chd5 Sos1 Kdelc1 Cblb Ptpra Ubash3a Sord Map4k1 Arap1 Dnm1 Hck −4 −3 −2 −1 0 −3 −2 −1 0 Ship1 Shc1 Grb2 Ship2 Sh3kbp1 Dok2 Grap Lat Cbl Ubash3a Dbnl Grap2 Fyn Wdr44 Crkl Lck Cd2ap Cd247 Mars Copb2 −2 −1 0 1 −3 −2 −1 0 Ii Si hi (l ) Itk Cdc37 Grb2 Grap2 Tuba1c Dnaja1 GGGGGGG Spcs2 Fyb Zranb1 Cry1 Smarcc1 Ttn Ipo5 M6pr Cpne1 Raver1 Fis1 Cct5 Glg1 Rps27a −1 0 1 2 3 −4 −3 −2 −1 0 Lck Cd4 Fyb Skap1 Zap70 Acadl Fyn Cd3g Cd3e Trim21 Lime1 3gg Cd247 Z Z Cdc37 Trbc1 Cand1 Tnpo1 Ipo5 Ifi47 Cyb5b Csk −2 −1 0 −3 −2 −1 0 Slp76 Vav1 Cd6 Grap Grap2 Lat Plcg1 Nt5dc3 Map4k1 Fyb Skap1 Grb2 Ubash3a Ywhag Ywhab Ywhaq Ywhah Ywhae Ywhaz Ccm2l −1 0 1 −3 −2 −1 0 Nck1 Arap1 Actbl2 Plbd1 Tmed10 Jak3 Was Ttn Rps24 Cd47 Cox6c −2 −1 0 1 2 −4 −3 −2 −1 0 Nfatc2 Ccdc146 Ppp3cb Creb1 Cct7 Xrcc6 Smarca5 Hist1h2bc Prss1 Naglu Myh4 Cbx3 Actbl2 Top2b Hist1h2al 5 Parp1 Xrcc5 Serpinb12 Rfc3 Atad3 −1 0 1 2 −4 −3 −2 −1 0 S( ) Plcg1 Grap Ship1 Grap2 Grb2 Slp76 Cblb Map4k1 Lat Actbl2 Spag5 Ranbp2 Mast2 Pdlim2 Dst Dnah2 Arhgap9 −2 −1 0 1 −4 −3 −2 −1 0 Ptpn22 Csk Pstpip1 Ywhaq Ubash3a Macf1 Ppp2r2a Ppp2cb P Ppp2r1a Vapa Ywhah Mcm5 Sdhb Ptk2b Eif4e Dnaja1 Cyb5b Rpl38 Ruvbl1 Xpo1 0 1 2 −3 −2 −1 0 Shp1 Eif3c Btla Tapbp Cdk5rap3 Rpl35a Mybbp1a Atp5k Isyna1 Atp5c1 Sf3a1 Qars Pgam5 Purb Ptpn12 Eif3a Atp5f1 Pkp1 Tyw1 p Lbr −5 −4 −3 −2 −1 0 −4 −3 −2 −1 01 Themis Grb2 Grap Grap2 Acsbg2 Lat Eif4g1 Anxa6 Ahsa1 Bin1 Hspa8 −2 −1 0 1 2 −4 −3 −2 −1 0 Vav1 Slp76 Grap2 Map4k1 Grb2 Lat Sla Grap Cd6 Ccar2 Themis Plcg1 Fyn Anxa6 Arhgdib Got2 Gpi Samhd1 Mdh1 Ppia −1 0 1 2 −3 −2 −1 0
Interaction Stoichiometry (log10)
Abundance Stoichiometry (log
10
)
CD5, CD6 and LAX1 contribute to TCR signal diversification at the plasma membrane. Akin to LAT, several receptors and
adap-tors embedded in the T cell plasma membrane contain tyrosine residues that are capable of recruiting intracytoplasmic proteins fol-lowing TCR-induced phosphorylation. Congruent with that view, CD6 was found in the SLP-76 and VAV interactomes, whereas CD5 was present in the CBL and CBLB interactomes (Fig. 7). The LAX1 transmembrane adaptor and CD6 were also found in the CBLB interactome, however with lower stoichiometries than CD5. The role of CD6 in T cell activation continues to be debated, whereas CD5 and LAX1 negatively regulate TCR signaling. The numbers of copies per T cell of CD5–CBL (198), CD5–CBLB (329), CD6–SLP-76 (484) and CD6–VAV1 (214) complexes induced on TCR activa-tion were commensurate with those of LAT–SLP-76, LAT–SHIP1 and LAT–THEMIS complexes, unveiling their important quantita-tive contribution to TCR signal diversification. Moreover, the hun-dreds of copies of CBL- and CBLB-based signalosomes assembling around CD5 after 120 s of stimulation strengthened the view that CD5 constitutes a major mediator of TCR-induced ubiquitylation9.
Assessment of the function of novel interacting proteins at organ-ismal levels. Genomic editing by CRISPR/Cas9-based approaches
permits the study of gene function in ex vivo primary T cells28.
However, the role of genes involved in organismal function—such as lymphoid cell migration—cannot be assessed using ex vivo assays and requires development of mouse lines with homozygous loss-of-function mutations. To bypass such a fastidious approach, we used CRISPR/Cas9 to establish F0 mice with biallelic deletions of a
criti-cal exon of genes coding for five poorly characterized preys iden-tified in our interactomics dataset (see Methods). For each of the five tested genes (AI467606, Arap1, Arhgap45, Cep85l and Nap1l4), three single-guide RNAs were coinjected into zygotes and tail DNA from the five resulting F0 mouse cohorts were genotyped by PCR.
Of the resulting F0 mice, 74% showed the expected biallelic DNA
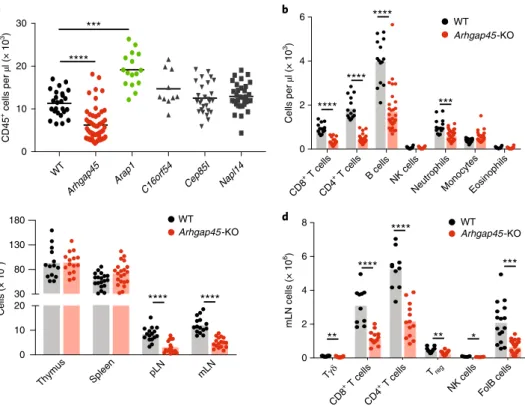
deletions and their blood was subjected to quantitative multipara-metric analysis of myeloid and lymphoid cells (Fig. 8a). For instance, biallelic inactivation of the Arghap45 gene, which codes for a func-tionally uncharacterized RHO GTPase-activating protein29 found
in the LCK interactome (Supplementary Dataset 1), produced the strongest phenotype among the five analyzed genes. Arghap45 inactivation resulted in a severe reduction in blood CD45+ cell
numbers (Fig. 8a). Consistent with the pattern of Arghap45 expres-sion (http://www.immgen.org/databrowser/index.html), lympho-cytes found in the blood were primarily affected by Arghap45 inactivation (Fig. 8b). Analysis of the progeny of F0 mice with
bial-lelic Arghap45 gene inactivation showed that their thymus and spleen were normal in terms of composition and absolute numbers, suggesting that ARGHAP45 has no detectable role during T and B cell development (Fig. 8c). In contrast, their lymph nodes showed a reduction in T and B cell numbers similar to that of F0 mice
(Fig. 8c,d). Considering that ARGHAP45 regulates actin cytoskel-eton and cell spreading in transfected HeLa cells29, our data suggest
that in the absence of ARGHAP45, T and B cells have a reduced ability to enter into lymph nodes via diapedesis. Therefore, our reverse genetics approach constitutes a decision support tool per-mitting identification, in 4 months and without mouse breeding, of preys where ablation results in T cell phenotypes of interest when analyzed at organismal levels.
Discussion
We assessed the dynamics of the signalosomes assembling around 15 canonical proteins used by the TCR signal-transduction network in primary CD4+ T cells. The unique possibility of integrating
inter-action stoichiometries and cellular abundances over the course of TCR stimulation allowed us to obtain key parameters for systems-level understanding of TCR signal propagation and diversification. For instance, we enumerated the number of signaling complexes that are used per T cell to convey TCR signals, and determined whether a fraction of the documented interacting proteins is left free to engage in alternative signalosomes over the course of stimu-lation. We also demonstrated that TCR signals divide into multiple branches at the level of the plasma membrane, resulting in the for-mation of CD5-, CD6-, BTLA- and LAX1-based signalosomes that assemble with kinetics comparable to the canonical LAT signalo-some, and that contribute to TCR signal diversification due to their unique composition in adaptor and effector molecules.
Our time-resolved analysis also illustrated the speed at which signalosomes assemble and disassemble following TCR triggering. For instance, full-blown LAT–SLP-76 signalosomes were already present 30 s after TCR triggering. A finding that is consistent with the view that TCR signals are transmitted in a rapid manner, result-ing in phosphorylation of TCR proximal components in 4 s, and
a b c –6 −4 −2 0 −6 −4 −2 0 Pearson R = 0.664 (n = 360)
Actual stoichiometry (log10)
Predicted stoichiometry (log
10 ) Themis Ship1 Slp-76 Cblb Vav1 Cbl Plcγ1 Lck Itk
Time (s) Maximum stoichiometry
0 30 120 300 600
Time (s) Maximum stoichiometry
0 30 120 300 600 Predicted Grb2 interactome Grb2 Sprey<bait =
Sbait<prey x Nbait Nbound
Nprey Nprey = −2 −1 0 1 2 −4 −3 −2 −1 0 1
Ratio of prey to bait abundance (log
10
)
Stoichiometry Sbait<prey (log10)
Nbait Actual Grb2 interactome 1.00 0.75 0.50 0.25 0.00 ≤ 100% ≤ 12% ≤ 6% ≤ 3% 100 10–1 10–2 10–3 <10–4 Reported Not reported Color code Normal. stoichiometry Maximum stoichiometry Size code
Size code FDR color code
Nbound
Nprey
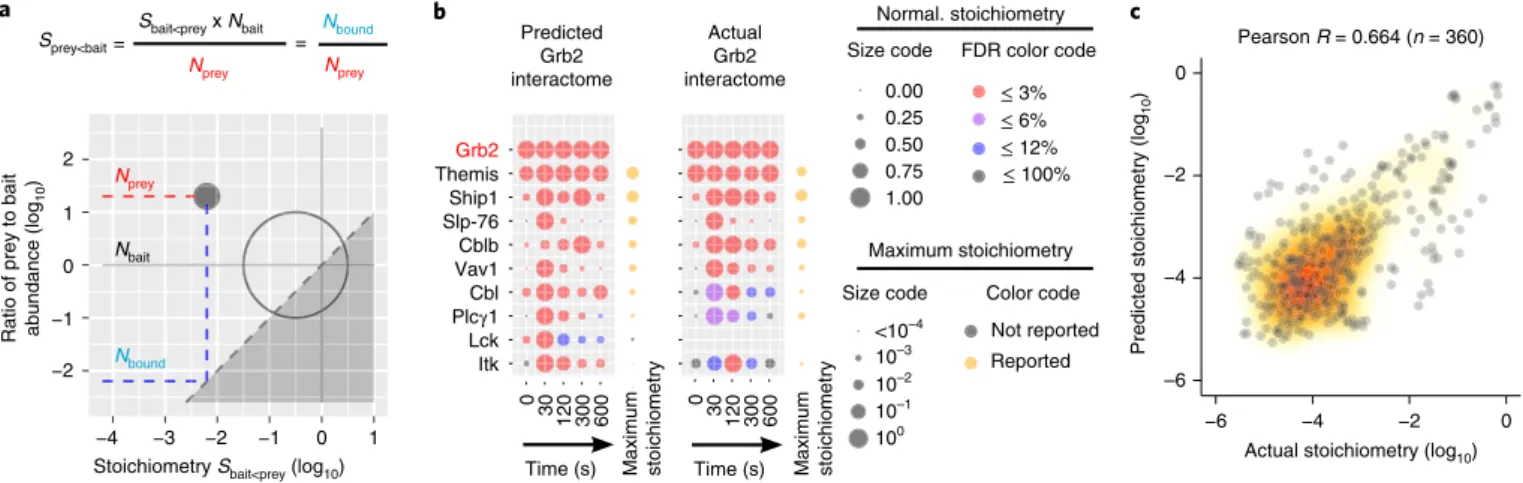
Fig. 5 | Ab initio prediction of the composition and stoichiometry of novel interactomes. a, By combining experimentally determined interaction
stoichiometry between a bait A and a prey B (SbaitA < preyB) and their cellular abundance it is possible to calculate a ‘reciprocal’ stoichiometry in which B
and A behave as the bait and the prey, respectively. b, Dot plots representing the interaction stoichiometries of the predicted GRB2 interactome (left,
FDR ≤ 3%, ranked by maximum predicted stoichiometries) and of the experimentally determined GRB2 interactome (right, no FDR restriction). Note that
the repertoire of preys of the predicted GRB2 interactome is confined to the repertoire of OST-tag baits capable of binding to GRB2. See key in Fig. 2b
legend. c, Global comparison of experimentally determined and of predicted interaction stoichiometries corresponding to the 15 baits show a correlation
coefficient of 0.66 and a median ratio of measured against predicted interaction stoichiometries of 3.7.
Cblb < Cd6 Vav1 < Cd6Cblb < Cd5 Vav1 < Lat Lck < Cd3e Cblb < Lax1 Cbl < Cd5 Shp1 < Btla Slp-76 < Cd6 Ship1 < Lat Slp-76 < Lat 0 10 20 30 40 50 60
Maximum number of copies of each high-confidence bait–prey interaction
that form per T cell 102 103 104 105 10 1 Counts a b LAX1 CD5 CD6 TCR LAT BTLA 389 794 110 VAV1 THEMIS 591 SLP-76 232 498 1,416 33 353 26 CBLB CBL 204 LCK ZAP70 SHP1 SHIP1
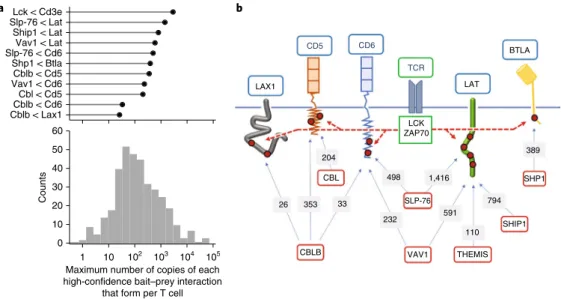
Fig. 6 | TCR signals branch at the level of the plasma membrane leading to the assembly of multiple signalosomes. a, For each of the 366
high-confidence bait–prey interactions, we calculated the maximum number of copies that form per CD4+ T cell over 600 s of TCR stimulation and show
their distribution in the lower panel. The distribution ranged from 0.4 to 7.0 × 10⁴ copies per T cell with a median close to 1.1 × 10² copies per T cell. The
high-confidence bait–prey interactions that involve a prey corresponding to a receptor (CD3ε, CD5, CD6, BTLA) or an adaptor (LAT, LAX1) associated
with the T cell plasma membrane are shown in the upper panel. b, Following TCR engagement, signalosomes involving CBL, CBLB and VAV1 nucleate
around the CD5 and CD6 transmembrane receptors in numbers comparable with those that form around the LAT adaptor via SLP-76, SHIP1 and THEMIS intermediates. Also shown are the BTLA coinhibitory receptor and the LAX1 adaptor that assemble signalosomes involving SHP1 and CBLB, respectively. Tyrosine residues (red dots) present in the intracytoplasmic segments of the depicted receptors and adaptors are phosphorylated by the LCK or ZAP70 PTK that associate with active TCR (dashed red arrows). Baits and preys are denoted using red and blue boxes, respectively. The maximum number (copies per T cell) of bait–prey complexes reached over the course of 600 s of TCR stimulation is specified over the arrows connecting the baits and the preys. For instance, the maximum number of CD5–CBLB complexes reached per T cell over 600 s of TCR stimulation is approximately 353.
SHIP2 LAT CBL MAP4K1 CBLB Proteasome ZAP70 VAV1 ITSN2 EPS15L1 THEMIS GRB2 PLCG1 SHIP1 CD6 SLAP1 SHC1 SOS1/2 LCK PTPN22 CSK CD5 FYN PSTPIP1 CD4 LIME1 LAX1 LCK CD4 LIME1 CDC37 FKBP5 YWHAH YWHAE YWHAQ YWHAZ
YWHAG PIK3R2 PIK3R1 SH3KBP1
CAPZA1 CAPZB CD2AP SLP76 GRAP2 ARHGDIA/B NCK1 ARAP1 RHOA WASp DOK2 TCR–CD3 complex DBNL UBASH3A/B GRAP CRKL SKAP1 SKAP2 FYB SKAP1 SKAP2 FYB PIK3CD PIK3CA PIK3CB CD247 CD3G CD3E TRBC1 Induced dissociation Induced association Not regulated Functional module inferred from co-recruitment analysis
Bait protein
Prey protein BTLA
SHP1
Fig. 7 | A model summarizing the protein–protein interactions occurring during the first 10 min of TCR activation. This diagram integrates data found in
Figs. 2b and 4 and in Supplementary Datasets 1 and 2. It focuses on those high-confidence bait–prey interactions that (1) are regulated on TCR activation,
(2) engage a large fraction of the bait or prey present in a given T cell or (3) are part of a functional module identified using co-recruitment analysis
(Supplementary Fig. 6). For a deeper exploratory analysis, we included interactions with an FDR ≤ 3% for one consecutive condition of stimulation.
production of intracellular second messengers such as Ca2+ in 6–7 s
(ref. 30). Binding of MAP4K1 to SLP-76 peaked 30 s after TCR
trig-gering. This led to serine–threonine phosphorylation of SLP-76 and GRAP2 (ref. 31), and, as documented here, to the interaction
of six 14-3-3 family members with SLP-76. These interactions were of high stoichiometry and correlated with dismantling of the LAT signalosome 120 s after TCR triggering, a finding that is consistent with the view that SLP-76 dissipates from TCR microclusters during their transport toward the center of the immunological synapse32.
We showed that the CD5–CBL and CD5–CBLB signalosomes that formed following TCR engagement, in numbers comparable to the LAT signalosome, are primarily endowed with a negative regula-tory role, likely contributing to the short temporal persistence of the LAT signalosome33. Smaller numbers of LAX1–CBLB complexes
assembled, probably accounting for the milder negative regulation of TCR signals by LAX1.
Models accounting for the function of ITK, LCK, FYB and PTPN22 need to be revisited on the basis of the present quantita-tive interactomics study. On production of PtdIns(3,4,5)P3, ITK is
recruited to the plasma membrane through its PH domain and, after associating to the LAT–GRAP2–SLP-76 signalosome, it phos-phorylates and activates PLC-γ1 (ref. 34). We found that LCK was
70-fold more abundant than ITK in CD4+ T cells, and that the LCK
interactome was 60-fold larger than that of ITK. A reason for this last difference stems from the association of LCK with multiple
transmembrane receptors and adaptors, among which we identified CD4, the TCR–CD3 complex, ZAP70, LAT, CD2, CD6, CD28, CD45 (PTPRC), the interleukin 2 receptor α and β subunits and LIME1. In contrast to ITK, which modulates the magnitude of calcium flux34,
LCK is responsible for initiating the entire TCR-signaling cascade and has T cell cancer-promoting activities. Accordingly, several of the molecules unique to the LCK interactome are likely to be devoted to controlling its high activity state and degradation. They corresponded to chaperones (CDC37, DNAJA1 and 2, FKBP5 and 8, HSP90AA1, HSP90AB1, ST13), several 26S proteasome subunits and CAND1, a member of the SCF E3 ubiquitin ligase complex. Moreover, the presence of RAB11B and of several GTP-binding pro-teins (IFI47, IRGM1, IFGGD) in the LCK interactome, likely fixes the activation threshold of naive T cells by controlling LCK subcel-lular localization35. The LCK interactome further differed from that
of ITK by the presence of several proteins involved in nuclear export and import, suggesting unidentified roles for LCK.
FYB is rather unique among the analyzed baits in that it inter-acted with a large number of preys before TCR activation. Some of them, including FYB–SKAP1 and FYB–SKAP2, persisted after TCR activation, whereas others involving FYN, LCK and SLP-76 decreased on TCR activation. Analysis of the LCK and SLP-76 inter-actomes confirmed that the FYB–LCK and FYB–SLP-76 interactions diminished after TCR engagement, a finding that contrasted with results that suggest that FYB binds to SLP-76 in a TCR-inducible
0 2 4 6 8 mLN cells (× 10 6) WT Arhgap45 Arap1
C16orf54 Cep85I Napl14 CD8 + T cells
CD4
+ T cells B cells NK cells
NeutrophilsMonocytesEosinophils 0 0 2 4 6 10 20 30 CD45 + cells per µl (× 10 3) Cells per µl (× 10 3) Tγδ CD8 + T cells CD4 + T cells Treg
NK cells FolB cells WT Arhgap45-KO WTArhgap45-KO WT Arhgap45-KO **** **** **** **** * *** ** ** **** **** **** **** *** *** a b d c Cells (× 10 6) Thymus Spleen pLN mLN 0 10 20 80 30 130 180
Fig. 8 | ARGHAP45 is crucial for proper T and B cell migration. a, Quantification of CD45+ cells in the blood of wild-type mice and of F
0 mice with biallelic
deletions of the Arap1, AI467606, Arhgap45, Cep85l and Nap1l4 genes. Each symbol corresponds to a mouse and the mean (horizontal bar) is indicated.
Among the analyzed Arghap45 F0 mice, six contain one Arghap45 allele with a small deletion preserving its open reading frame and were used as internal
control giving rise to normal blood phenotype. Wild type: n = 25; Arhgap45: n = 56; Arap1, n = 16; C16orf54: n = 27; Cep85l: n = 27; Nap1l4: n = 33. For each
mutation, comparison was done relative to wild-type (WT) mice using unpaired Mann–Whitney U-test. ***P = 0.0002; ****P = 0.000004. In a–d, only
significant values (P < 0.05) are specified. b, Quantification of CD8+ T cells, CD4+ T cells, B cells, NK cells, neutrophils, monocytes and eosinophils in the
blood of wild-type mice (n = 14) and of F0 mice with biallelic deletions in the Arghap45 gene (n = 32). ***P = 0.00021; ****P < 0.00001 (unpaired Holm–
Sidak’s multiple t-test corrected for multiple comparisons). c, Cellularity of the thymus, spleen, peripheral (pLN) and mesenteric (mLN) lymph nodes
of the progeny of wild-type mice (n = 20) and of F0 mice with biallelic deletions in the Arghap45 gene (n = 20). ****P < 0.00001 (unpaired Holm–Sidak’s
multiple t-test corrected for multiple comparisons). d, Quantification of γδ T cells (Tγδ), CD8+ T cells, conventional CD4+ T cells, regulatory CD4+ T cells
(Treg), NK cells and follicular B (FolB) cells in the mesenteric lymph nodes of wild-type mice (n = 16) and of F0 mice with biallelic deletions in the Arghap45
gene (n = 16). *P = 0.017; **P = 0.004; ***P = 0.00003; *****P < 0.00001 (unpaired Holm–Sidak’s multiple t-test corrected for multiple comparisons).
manner36. Unexpectedly, FYB constitutively interacted with several
proteins involved in pre-messenger RNA splicing (corresponding to the SNW1–PPIL1 complex, PRPF3 and PRRC2A), nuclear RNA export (corresponding to DDX3X3 and the NXF1 and NXT1 com-plexes) and mRNA stability (KHDRBS1–SAM68), a finding that is consistent with the presence of two nuclear localization sequences in FYB and its cytoplasmic and nuclear distribution37. Therefore,
the composition and dynamics of the FYB interactome point to as-yet-unidentified roles of FYB in T cells.
Genetic variants of PTPN22 are among the strongest genetic risk factors for several human autoimmune diseases, the reasons for which remain unknown. We confirmed here that the constitutive interaction between PTPN22 and the adaptor proline–serine–thre-onine phosphatase-interacting protein 1 (PSTPIP1)38. Moreover,
7% of the PTPN22 molecules were associated to CSK before TCR stimulation. UBASH3A was found among the low-stoichiometry PTPN22 interactors, an observation that can be related to genome-wide association studies in which UBASH3A variants were linked to autoimmunity39. Moreover, after slightly relaxing the cutoff
val-ues (FDR ≤ 3% for one condition of stimulation), the structural A (PPP2R1A), regulatory B (PP2R2A) and catalytic C (PP2CB) sub-units of the serine–threonine–protein phosphatase 2A (PP2A) were found constitutively associated to PTPN22. PP2A has recently been implicated in several autoimmune disorders40, suggesting that PP2A
contributes to the negative regulatory function of PTPN22 and its involvement in autoimmunity.
In conclusion, our study provides the most comprehensive analysis yet on the composition, stoichiometry and dynamics of the proximal TCR signal-transduction network in primary T cells. It illustrates the power of systems-level approaches to retrieve quan-titative information on how TCR signals propagate and diversify at the level of the T cell plasma membrane for successful initiation and termination of T cell activation. Moreover, the possibility of integrating the cellular abundance of the interacting proteins and their interaction stoichiometry provides a quantitative and con-textual picture of each documented PPI that supersedes the view resulting from conventional coimmunoprecipitation approaches. Importantly, it constitutes a framework that should help in rational-izing the phenotypic effect of genetic variations or drug treatments intended to block T cell activation, and in charting the redundant routes of signal propagation that a T cell might use to bypass a drug-targeted component, both of which constitute central issues in immune systems biology.
Online content
Any methods, additional references, Nature Research reporting summaries, source data, statements of code and data availability and associated accession codes are available at https://doi.org/10.1038/ s41590-019-0489-8.
Received: 8 May 2019; Accepted: 5 August 2019; Published online: 7 October 2019
References
1. Chakraborty, A. K. & Weiss, A. Insights into the initiation of TCR signaling.
Nat. Immunol. 15, 798–807 (2014).
2. Brownlie, R. J. & Zamoyska, R. T cell receptor signalling networks: branched, diversified and bounded. Nat. Rev. Immunol. 13, 257–269 (2013).
3. Shah, N. H. et al. An electrostatic selection mechanism controls sequential kinase signaling downstream of the T cell receptor. eLife 5, e20105 (2016). 4. Roncagalli, R. et al. Quantitative proteomics analysis of signalosome
dynamics in primary T cells identifies the surface receptor CD6 as a Lat adaptor-independent TCR signaling hub. Nat. Immunol. 15, 384–392 (2014). 5. Astoul, E., Edmunds, C., Cantrell, D. A. & Ward, S. G. PI 3-K and T-cell
activation: limitations of T-leukemic cell lines as signaling models. Trends
Immunol. 22, 490–496 (2001).
6. Hein, M. Y. et al. A human interactome in three quantitative dimensions organized by stoichiometries and abundances. Cell 163, 712–723 (2015).
7. Caron, E. et al. Precise temporal profiling of signaling complexes in primary cells using SWATH mass spectrometry. Cell Rep. 18, 3219–3226 (2017).
8. Gaud, G. et al. The costimulatory molecule CD226 signals through VAV1 to amplify TCR signals and promote IL-17 production by CD4+ T cells.
Sci. Signal. 11, eaar3083 (2018).
9. Voisinne, G. et al. Co-recruitment analysis of the CBL and CBLB signalosomes in primary T cells identifies CD5 as a key regulator of TCR-induced ubiquitylation. Mol. Syst. Biol. 12, 876 (2016).
10. Schwanhausser, B. et al. Global quantification of mammalian gene expression control. Nature 473, 337–342 (2011).
11. Wisniewski, J. R., Hein, M. Y., Cox, J. & Mann, M. A “proteomic ruler” for protein copy number and concentration estimation without spike-in standards. Mol. Cell. Proteomics 13, 3497–3506 (2014).
12. Ruepp, A. et al. CORUM: the comprehensive resource of mammalian protein complexes—2009. Nucleic Acids Res. 38, D497–D501 (2010).
13. Huang, Y. et al. Deficiency of ADAP/Fyb/SLAP-130 destabilizes SKAP55 in Jurkat T cells. J. Biol. Chem. 280, 23576–23583 (2005).
14. Seet, B. T. et al. Efficient T-cell receptor signaling requires a high-affinity interaction between the Gads C-SH3 domain and the SLP-76 RxxK motif.
EMBO J. 26, 678–689 (2007).
15. Giuriato, S. et al. SH2-containing inositol 5-phosphatases 1 and 2 in blood platelets: their interactions and roles in the control of phosphatidylinositol 3,4,5-trisphosphate levels. Biochem. J. 376, 199–207 (2003).
16. Liu, S. L. et al. Quantitative lipid imaging reveals a new signaling function of phosphatidylinositol-3,4-bisphophate: isoform- and site-specific activation of Akt. Mol. Cell 71, 1092–1104.e5 (2018).
17. Goulden, B. D. et al. A high-avidity biosensor reveals plasma membrane PI(3,4)P2 is predominantly a class I PI3K signaling product. J. Cell. Biol. 218, 1066–1079 (2018).
18. Yang, M. et al. K33-linked polyubiquitination of Zap70 by Nrdp1 controls CD8 T cell activation. Nat. Immunol. 16, 1253–1262 (2015).
19. Paster, W. et al. GRB2-mediated recruitment of THEMIS to LAT is essential for thymocyte development. J. Immunol. 190, 3749–3756 (2013).
20. Balagopalan, L., Kortum, R. L., Coussens, N. P., Barr, V. A. & Samelson, L. E. The linker for activation of T cells (LAT) signaling hub: from signaling complexes to microclusters. J. Biol. Chem. 290, 26422–26429 (2015). 21. Kumari, S. et al. Actin foci facilitate activation of the phospholipase C-gamma in primary T lymphocytes via the WASP pathway. eLife 4, e04953 (2015).
22. Ditliev, J. A. et al. A composition-dependent molecular clutch between T cell signaling condensates and actin. eLife 8, e42695 (2019).
23. Choi, S. et al. THEMIS enhances TCR signaling and enables positive selection by selective inhibition of the phosphatase SHP-1. Nat. Immunol. 18, 433–441 (2017).
24. Mehta, M. et al. Themis-associated phosphatase activity controls signaling in T cell development. Proc. Natl Acad. Sci. USA 115, E11331–E11340 (2018). 25. Zvezdova, E. et al. Themis1 enhances T cell receptor signaling during
thymocyte development by promoting Vav1 activity and Grb2 stability.
Sci. Signal. 9, ra51 (2016).
26. Murphy, T. L. & Murphy, K. M. Slow down and survive: enigmatic immuno-regulation by BTLA and HVEM. Annu. Rev. Immunol. 28, 389–411 (2010). 27. Celis-Gutierrez, J. et al. Quantitative interactomics in primary T cells
provides a rationale for concomitant PD-1 and BTLA coinhibitor blockade in cancer immunotherapy. Cell Rep. 27, 3315–3330.e7 (2019).
28. Seki, A. & Rutz, S. Optimized RNP transfection for highly efficient CRISPR/Cas9-mediated gene knockout in primary T cells. J. Exp. Med. 215, 985–997 (2018).
29. de Kreuk, B. J. et al. The human minor histocompatibility antigen 1 is a RhoGAP. PLoS ONE 8, e73962 (2013).
30. Huse, M. et al. Spatial and temporal dynamics of T cell receptor signaling with a photoactivatable agonist. Immunity 27, 76–88 (2007).
31. Lasserre, R. et al. Release of serine/threonine-phosphorylated adaptors from signaling microclusters down-regulates T cell activation. J. Cell. Biol. 195, 839–853 (2011).
32. Hashimoto-Tane, A. & Saito, T. Dynamic regulation of TCR-microclusters and the microsynapse for T cell activation. Front. Immunol. 7, 255 (2016). 33. Yi, J., Balagopalan, L., Nguyen, T., McIntire, K. M. & Samelson, L. E. TCR
microclusters form spatially segregated domains and sequentially assemble in calcium-dependent kinetic steps. Nat. Commun. 10, 277 (2019).
34. Andreotti, A. H., Joseph, R. E., Conley, J. M., Iwasa, J. & Berg, L. J. Multidomain control over TEC kinase activation state tunes the T cell response. Annu. Rev. Immunol. 36, 549–578 (2018).
35. Bouchet, J. et al. Rab11-FIP3 regulation of lck endosomal traffic controls TCR signal transduction. J. Immunol. 198, 2967–2978 (2017).
36. Geng, L., Raab, M. & Rudd, C. E. Cutting edge: SLP-76 cooperativity with FYB/FYN-T in the up-regulation of TCR-driven IL-2 transcription requires SLP-76 binding to FYB at Tyr595 and Tyr651. J. Immunol. 163, 5753–5757 (1999).
37. Veale, M. et al. Novel isoform of lymphoid adaptor FYN-T-binding protein (FYB-130) interacts with SLP-76 and up-regulates interleukin 2 production.
J. Biol. Chem. 274, 28427–28435 (1999).
38. Marcos, T. et al. Proline-serine-threonine phosphatase interacting protein 1 inhibition of T-cell receptor signaling depends on its SH3 domain. FEBS J.
281, 3844–3854 (2014).
39. Stanford, S. M., Mustelin, T. M. & Bottini, N. Lymphoid tyrosine phosphatase and autoimmunity: human genetics rediscovers tyrosine phosphatases. Semin.
Immunopathol. 32, 127–136 (2010).
40. Xu, Q. et al. Phosphatase PP2A is essential for TH17 differentiation.
Proc. Natl Acad. Sci. USA 116, 982–987 (2019).
Acknowledgements
We thank D. Mori, C. Wülfing (University of Bristol) and A. Zarubica for discussions and E. Bergot, S. Li, T. Chao, S. Durand and the late F. Danjan for technical help. This work was supported by CNRS, INSERM, the European Research Council (ERC) under FP7 program (grant agreement no. 322465 (INTEGRATE), to B.M.) and the European Union’s Horizon 2020 research and innovation program (grant agreement no. 787300 (BASILIC), to B.M.), Agence Nationale de la Recherche (BASILIC project, to M.M.), the MSDAVENIR Fund (to B.M.), the Investissement d’Avenir program of the French Ministry of Research ProFI (Proteomics French Infrastructure, ANR-10-INBS-08, to O.B.-S.), and PHENOMIN (French National Infrastructure for mouse Phenogenomics; ANR-10-INBS-07, to B.M.), the National Natural Science Foundation of China (grant nos 81471595 and 31400759, to Y.L.) and the Education Department of Henan Province, China (16HASTIT030, to Y.L.) and by fellowships from the INTEGRATE (to M.G.M, G.V., K.K. and K.C.), MSDAVENIR (to Y.O.) and PHENOMIN (to L.G.) projects.
Author contributions
B.M., R.R. and G.V. conceived the project. B.M. and F.F supervised the construction of OST-tagged mice. R.R. and M.M. performed the experiments shown in Supplementary
Figs. 1–3 with the help of L.G., Y.O. and M.G.M. K.K. characterized the SHIP1OST,
PLC-γ1OST and PTPN6OST mice with the help of J.C. A.G.de P., K.C. and O.B.-S. performed
the MS experiments. G.V. designed the computational and bioinformatics analysis. Y.L.,
M.M., H.L. and B.M designed the experiments shown in Fig. 8 and L.L., L.Z. and H.W.
performed them. B.M., G.V. and R.R. wrote the manuscript.
Competing interests
The authors declare no competing interests.
Additional information
Supplementary information is available for this paper at https://doi.org/10.1038/ s41590-019-0489-8.
Correspondence and requests for materials should be addressed to Y.L., R.R. or B.M. Peer review information Laurie A. Dempsey was the primary editor on this article and managed its editorial process and peer review in collaboration with the rest of the editorial team.
Reprints and permissions information is available at www.nature.com/reprints. Publisher’s note Springer Nature remains neutral with regard to jurisdictional claims in published maps and institutional affiliations.
© The Author(s), under exclusive licence to Springer Nature America, Inc. 2019