HAL Id: inserm-00912860
https://www.hal.inserm.fr/inserm-00912860
Submitted on 2 Dec 2013
HAL is a multi-disciplinary open access
archive for the deposit and dissemination of
sci-entific research documents, whether they are
pub-lished or not. The documents may come from
teaching and research institutions in France or
abroad, or from public or private research centers.
L’archive ouverte pluridisciplinaire HAL, est
destinée au dépôt et à la diffusion de documents
scientifiques de niveau recherche, publiés ou non,
émanant des établissements d’enseignement et de
recherche français ou étrangers, des laboratoires
publics ou privés.
Towards an Atrio-Ventricular Delay optimization
assessed by a computer model for Cardiac
Resynchronization Therapy
David Ojeda, Virginie Le Rolle, Kevin Tse Ve Koon, Christophe Thebault,
Erwan Donal, Alfredo Hernandez
To cite this version:
David Ojeda, Virginie Le Rolle, Kevin Tse Ve Koon, Christophe Thebault, Erwan Donal, et al..
Towards an Atrio-Ventricular Delay optimization assessed by a computer model for Cardiac
Resyn-chronization Therapy. IX International Seminar on Medical Information Processing and Analysis,
Nov 2013, Mexico City, Mexico. pp.892207, �10.1117/12.2041977�. �inserm-00912860�
Towards an Atrio-Ventricular Delay optimization assessed by
a computer model for Cardiac Resynchronization Therapy
David Ojeda
a,b,Virginie Le Rolle
a,b,Kevin Tse Ve Koon
a,b,Christophe Thebault
a,b,c,
Erwan Donal
a,b,cand Alfredo I Hern´
andez
a,ba
INSERM, UMR 1099, Rennes, F-35000, France;
b
Universit´
e de Rennes 1, LTSI, Rennes, F-35000, France.
c
CHU Rennes, Service de Chirurgie Thoracique et de Chirurgie Vasculaire, Rennes, France.
ABSTRACT
In this paper, lumped-parameter models of the cardiovascular system, the cardiac electrical conduction system and a pacemaker are coupled to generate mitral flow profiles for different atrio-ventricular delay (AVD) configurations, in the context of cardiac resynchronization therapy (CRT). First, we perform a local sensitivity analysis of left ventricular and left atrial parameters on mitral flow characteristics, namely E and A wave amplitude, mitral flow duration, and mitral flow time integral. Additionally, a global sensitivity analysis over all model parameters is presented to screen for the most relevant parameters that affect the same mitral flow characteristics. Results provide insight on the influence of left ventricle and atrium influence on mitral flow profiles. This information will be useful for future parameter estimation of the model that could reproduce the mitral flow profiles and cardiovascular hemodynamics of patients undergoing AVD optimization during CRT.
Keywords: Heart Failure, Cardiac Resynchronization Therapy, Sensitivity Analysis, Modeling and Simulation
1. INTRODUCTION
Current therapeutic recommendations for symptomatic patients suffering from heart failure (HF) and presenting left ventricular systolic dysfunction, left ventricular ejection fraction < 35% and a QRS duration > 120 ms, include the implant of a multisite cardiac stimulation device. This implant-based therapy, known as “cardiac resynchronization therapy (CRT)” is based on the electrical stimulation of the right atrium and both the right and left ventricles, at specific timings, in order to: i) improve left ventricular (LV) filling, by maximizing the contribution from the atrial systole, and ii) synchronize the mechanical activity of both ventricles, increasing the effective contribution of each ventricular wall to the ejection and, therefore, improving cardiac output. CRT has been shown to provide a significant improvement in most clinical markers of HF patients, promoting cardiac remodeling and to reducing hospitalizations.1However, the effectiveness of CRT is highly dependent on the implant configuration (particularly on the definition of the atrioventricular pacing delay - AVD), and this configuration has been shown to be patient-specific.2 The lack of a systematic and personalized optimization of these parameters may partly explain that approximately 30% of CRT patients do not respond correctly to this therapy.3
CRT optimization may be performed by analyzing a set of electrophysiological and echocardiographic markers of the cardiac response, acquired from an implanted patient while modifying AVD and VVD values within a given range.4–6 However, this is a long and tedious work that is seldom performed in clinical practice. Moreover, these analyses lead to large datasets of complex, multivariate data, which are very difficult to analyze, due to the multifactorial nature of this pathology. In order to ease this complex analysis, we propose a model-based approach, based on a lumped-parameter electro-mechanical model of the cardiovascular system, coupled with a simple model of a CRT device. This work presents, to our knowledge, the first detailed sensitivity analysis of such a coupled model, integrating physiologically relevant parameter values. We hypothesize that these analyses can help to better understand the influence of the main CRT parameters on the patient’s response and may help the definition of new, streamlined CRT optimization procedures.
2. MODEL DESCRIPTION
The model proposed in this paper is composed of three main sub-models, representing: (i) the electrical activity of the heart, (ii) a biventricular pacemaker, and (iii) the mechanical activity of the heart, as well as the pulmonary and systemic circulations. Most of these sub-models have been developed in our laboratory and published elsewhere, including implementation details and model validation with respect to real patient data.7–9 In this work, a new coupling implementation is proposed, with a significant effort on the definition of appropriate pathophysiological values for model parameters. The following sections briefly describe each model component.
Figure 1: Cellular automata representation of the car-diac electrical conduction system.
Figure 2: Circulatory and mechanical heart model
2.1 Electrical heart model
The electrical conduction system is defined as a set of coupled cellular automata, adapted from Hern´andez et al.9 Each cellular automata represents the electrical activation state of a given myocardial tissue, covering the main electrophysiological activation periods: slow diastolic depolarisation (SDD), upstroke depolarization (UDP), absolute refractory (ARP) and relative refractory (RRP). Briefly, the state of the cellular automata cycles through these four stages, sending an output stimulation signal to neighboring cells when a given cell is activated (end of UDP phase). Different parameter values of the automata and state-particular behavior can represent different group of cardiac cells. In this work, we consider three types of cardiac cells: the sinoatrial node (SAN), nodal cell automatas (NA) and myocardial cell automatas (MA). For myocardial cells, there is no depolarization during SDD; cells remain in an idle state, in which they stay until stimulated. SAN and NA cells, on the other hand, have a finite SDD period which causes spontaneous depolarization necessary for the natural pacemaker behavior of the heart. The whole electrical model consists of 20 automata, as illustrated in fig. 1. This configuration was chosen because it can generate ventricular activations through a retrograde or lateral paths, specially under certain VVD configurations of a biventricular pacemaker, which cannot be simulated with simpler models. For this work, the depolarization of the AVN is fixed at an infinite value in order to represent atrioventricular block, which is a common inclusion criteria for CRT.
The model has four inputs: the base heart rate (HR), which modulates the SSD period of the SAN, and three stimulation inputs from the pacemaker (StimA, StimLV, StimRV). Lastly, the model generates five outputs: the stimulation generated after the atrial node, useful for the activation of the pacemaker, and four independent stimulations that trigger the mechanical contraction of each heart chamber, as explained in the next sections.
2.2 Simplified CRT pacemaker model
The pacemaker model simulates a CRT system with three independent stimulation electrodes in contact with the right atrium and both ventricles. Even though the device can control the heart rate by pacing the right atrium, it is used in sensed mode, which detects the spontaneous impulse in the atrium and then sends a stimulation to the ventricles. In this operational mode, the simplified CRT pacemaker model is composed of one input, two delays and two outputs. The input of the model (SenseAtrial) is the electrical impulse delivered by the FPSRA1 node of the cardiac electrical model explained before. When the pacemaker input probe detects this impulse, it sends two independent electrical impulses to the left and right ventricles, according to the atrio-ventricular and intra-ventricular delays: The pacemaker can be summarized in the following equations:
StimRV(t + AVD + VVD) = SenseAtrial(t) , (1) StimLV(t + AVD) = SenseAtrial(t) . (2)
2.3 Circulatory and mechanical model
A wide range of models of cardiac mechanics exist in the literature,10 mostly based on the mass and momentum conservation of fluids. Model representations vary in complexity and purpose, from 3D continuum fluid mechanics approaches solved by finite-element methods, to more concise, low-dimensional descriptions, such as lumped parameter representations that describe blood flow with differential equations. While fine scale models require an important amount of parameters and significant computational resources, lumped parameter models, on the other hand, offer a good compromise of complexity and accuracy. In this work, the cardiovascular model consists of a description of the mechanical properties of the heart, based on the model of Smith et al.,8 as illustrated in fig. 2, which includes all four cardiac chambers, and two circulatory networks.
The following equations summarize the model dynamics, focusing on the left heart; the right heart is defined with the same equations but different subscriptr. To account for the mechanical function of the atria, the atrial pressure Pla is a linear function of its instantaneous volume Vla, whose slope Ela represents the elastic properties of the atrial wall:
Pla(Va, t) = Ela(t) · (Vla(t) − Vd,la) , (3) Ela(t) = Ela,max ✓ ela(t) + Ela,min Ela,max ◆ , (4)
where ela(t) is a Gaussian driving function that cycles between atrial diastole and systole:
ela(t) = exp −Bla ✓ HR HRR ◆2 · ✓ t − Cla HRR HR ◆2! . (5)
Using Bla and Cla, it is possible to control the rise and peak of the atrial systole. Moreover, these parameters are adjusted to reduce or enlarge the systolic period when the heart rate is different than the baseline resting heart rate (HRR) of 60 bpm.
Regarding the ventricles, their pressures are represented by a combination of two functions: the end-systolic pressure-volume relationship (ESPVR) and the end-diastolic pressure-volume relationship (EDPVR). As commonly found in cardiovascular modeling literature,11 these relationships can be written as:
Pes,lv(V, t) = Ees,lv(V (t) − Vd,l) , (6) Ped,lv(V, t) = P0,lv
⇣
eλlv(V (t)−V0,l)− 1⌘. (7)
In eq. (6), the systolic pressure Pes,lvis defined as a linear relationship with the ventricular volume V , determined by the systolic elastance Ees,lv and the volume intercept Vd,lv. Equation (7) describes the nonlinear diastolic pressure defined by a gradient P0,lv, curvature λlv and volume intercept V0,lv. Using these two functions and throughout this work, the systolic properties of the ventricles are summarized by Ees and Vd parameters, while the diastolic properties are described by P0, λ and V0.
The instantaneous pressure of the ventricle is then calculated as the combination of the ESPVR and EDPVR: Plv(V, t) = elv(t)Pes,lv(V, t) + (1 − elv(t))Ped,lv(V, t) , (8) where elv(t) is driver function composed of two Gaussian functions with a common peak Clv:
elv(t) = 8 < : exp⇣−Blv1*HRRHR + 2 *t − ClvHRRHR + 2⌘ if t < Clv, exp⇣−Blv2*HRRHR + 2 *t − ClvHRRHR + 2⌘ if t ≥ Clv. (9)
An asymmetric driver function permits to independently control the rise of the ventricular systole before (Blv1) and after (Blv2) its maximum value. This design is similar to existing elastance functions,11, 12 but permits to simulate a longer decay of the ventricular activation, which is typical for the abnormal ventricular activity of subjects with HF.
Concerning the circulatory models, the volume of each cardiac or vessel chamber is calculated from the net flow: V (t) =R (Qin− Qout) dt, while the flows are defined by the pressure gradient across chambers and a resistance: Q =∆P/R. The pressure of arterial and venous vessels are defined as an elastance dependent linear relationship, similar to eq. (6). Finally, flow across cardiac valves, depicted as diodes in fig. 2, are calculated as Q =∆P/R, but when the pressure gradient is negative, the resistance is multiplied by a factor of 104. This representation does not consider cardiac valve disorders such as valve stenosis or regurgitation.
The conjunct consideration of atrial and ventricular dynamics permits the integrated model to generate typical mitral flow profiles, as shown in fig. 3 and discussed later. Mitral flow profiles present a particular shape during the cardiac cycle: along with the pressure drop of the left ventricle during diastole, the mitral valve opens and the ventricle is partially filled. The peak of flow due to this passive early filling is known as the E-wave. Immediately, the left atrium contracts and causes an additional blood flow observable by a second peak, the A-wave, which decays until the valve closes due to the increased pressure at the onset of ventricular contraction.
3. SIMULATION RESULTS
Depending on the parameter values, the model can produce the hemodynamics of different cardiovascular pathologies. This section presents two different situations: a normal healthy heart and a subject with HF with left ventricular dysfunction and preserved right ventricular function, undergoing CRT with an active pacemaker. The model parameters values were selected from the publications from which each model was originally based on: ventricular and circulatory parameters were taken from Smith et al.,8atrial parameters were adapted from Heldt,13and cardiac electrical conduction system from Hern´andez et al.9
Subjects with HF often present a prolonged QRS duration (>120 ms) due to injuries of the heart electrical conduction system, which causes an inter and intra ventricular conduction delay. Furthermore, HF show an increased ventricular systole duration, an impaired diastolic ventricular function and a loss in ventricular contractility. Reduced diastolic function leads to increased atrial contractility in order to compensate for the loss in early ventricular filling. Finally, HF also causes a reduced stroke volume as a result of a dilated ventricle and the stiffening of its walls. In order to consider these aspects, model parameters were manually adjusted as shown in tables 1a and 1b.
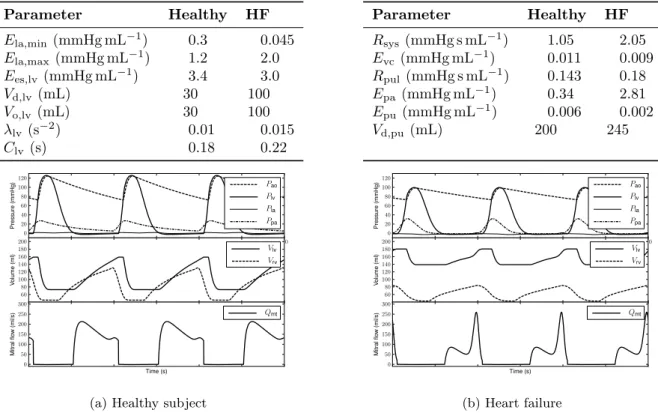
Simulation results of the two subject profiles are shown in fig. 3. For both simulations, the heart rate was fixed at 60 bpm. For the healthy patient, the pacemaker was not included, while the HF subject had an enabled pacemaker at AVD = 120 ms and simultaneous biventricular stimulation (VVD = 0 ms). Simulated values are qualitatively coherent with clinical observations: the HF subject presents lower systolic and diastolic pressures (99/73 mmHg) than the healthy counterpart (124/72 mmHg), while the pulmonary arterial pressure shows the opposite trend (25/4 mmHg for healthy, 31/3 mmHg for HF). Ventricular volumes show an augmentation for HF, with significant reduction of the ejection fraction (23% HF, 54% healthy). Concerning ventricular filling, results show a significant change of mitral flow profile and its related clinical markers: the ratio of the peak E and A waves (E/A) drops from a healthy 1.6 to 0.34, which is typical of systolic dysfunction HF. The ratio of mitral flow duration to RR-interval (RMITRR) is also reduced, from 0.54 to 0.44.
Table 1: Parameter values used for the simulation of a healthy and a HF subject
(a) Left cardiac parameters
Parameter Healthy HF Ela,min(mmHg mL−1) 0.3 0.045 Ela,max (mmHg mL−1) 1.2 2.0 Ees,lv (mmHg mL−1) 3.4 3.0 Vd,lv(mL) 30 100 Vo,lv(mL) 30 100 λlv(s−2) 0.01 0.015 Clv(s) 0.18 0.22 (b) Circulation parameters Parameter Healthy HF Rsys(mmHg s mL−1) 1.05 2.05 Evc (mmHg mL−1) 0.011 0.009 Rpul(mmHg s mL−1) 0.143 0.18 Epa (mmHg mL−1) 0.34 2.81 Epu (mmHg mL−1) 0.006 0.002 Vd,pu (mL) 200 245 0.5 1.0 1.5 2.0 2.5 3.0 0 20 40 60 80 100 120 P re ssu re (m m H g ) Pao Plv Pla Ppa 60 80 100 120 140 160 180 200 Vo lu m e (m l) Vlv Vrv Time (s) 0 50 100 150 200 250 300 M it ra l flo w (m l/ s) Qmt
(a) Healthy subject
0.5 1.0 1.5 2.0 2.5 3.0 0 20 40 60 80 100 120 P re ssu re (m m H g ) Pao Plv Pla Ppa 60 80 100 120 140 160 180 200 Vo lu m e (m l) Vlv Vrv Time (s) 0 50 100 150 200 250 300 M it ra l flo w (m l/ s) Qmt (b) Heart failure
Figure 3: Simulated hemodynamic outputs for a healthy and a heart failure subject. Top panel shows pressures of left ventricle (Plv), left atrium (Pla), aorta (Pao) and pulmonary artery (Ppa). Middle panel shows left and right ventricular volumes (Vlv, Vrv). Bottom panel shows mitral valve flow (Qmt).
3.1 Simulation of AVD optimization of a CRT device
The choice of the appropriate AVD is of foremost importance during CRT. A common optimization procedure consists in determining the AVD with longest diastolic filling time without A-wave truncation,4 which can be determined by changing the pacemaker delays and observing pulsed-wave doppler of the mitral inflow. Considering that the model is able to produce mitral flows, an AVD optimization procedure can be simulated for the HF subject by changing the AVD gradually from 40 ms to 300 ms.
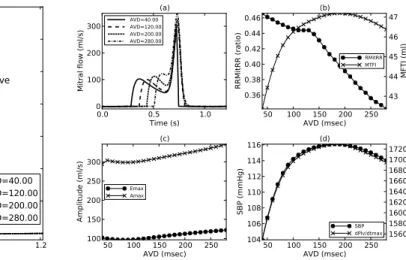
Figure 4 shows some of the mitral flow profiles for this range; HR is kept constant at 60 bpm and flow profiles are centered around the ventricular stimulation, represented by the annotated vertical line. The other vertical lines show the beginning of atrial systole for each AVD configuration. In addition to mitral flow profiles, some markers should be considered during AVD optimization, such as diastolic filling time and peak A wave. The former can be directly represented by the ratio of mitral flow to RR. Moreover, the velocity time integral (VTI ) of the mitral flow, which corresponds to the mitral flow time integral (MFTI ) can also provide information on the ventricular filling. These markers are presented in fig. 5.
In fig. 4, when AVD = 40 ms, the A wave is clearly truncated by the beginning of the ventricular contraction, while a nearly complete fusion of the E and A waves can be observed for AVD = 280 ms. Considering MFTI in fig. 5 (b), an AVD = 180 ms shows an optimal diastolic filling that does not present a truncation of the A wave in fig. 5 (a). Figure 5 (d) shows the effect of AVD over some hemodynamic variables: systolic blood pressure shows a parabolic variation that has been observed clinically by Whinnett et al.14 Additionally, LVdP/dtmax shows a correlation with RMITRR, which has also been used as a marker for optimal AVD.5
Figure 4: Simulated mitral flow profiles for an AVD ranging from 40 ms to 280 ms at a fixed HR of 60 bpm. Vertical lines indicate the onset of atrial contraction for each case.
Figure 5: Simulated mitral flow characteristics for dif-ferent AVD values: (a) flow profiles, (b) RMITRR and MFTI , (c) E and A waves amplitudes, and (d) SBP and LVdP/dtmax.
4. SENSITIVITY ANALYSIS
4.1 Local sensitivity analysis
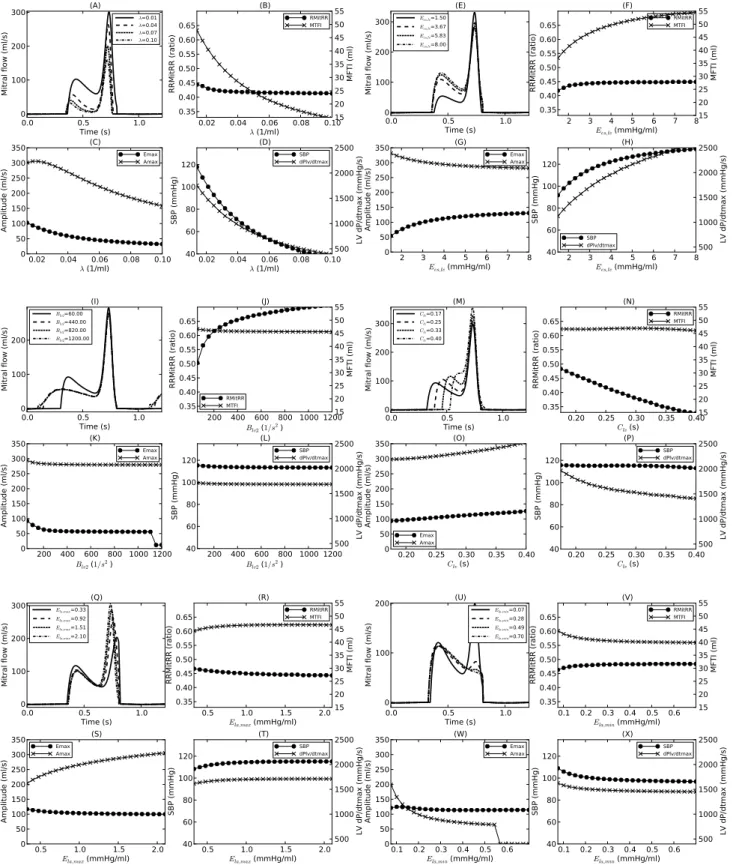
Apart from the AVD value, other model parameters can also affect the mitral flow properties. In order to better understand the effect of each parameter, local sensitivity analyses were performed by varying the value of a single parameter while fixing the rest of the model parameters to those of the HF subject in table 1 with AVD = 120 ms, which is long enough to avoid A wave truncation, while short enough to prevent fusion of E and A waves. These local analysis were concentrated on the left atrial and ventricular parameters since these two chambers, which are separated by the mitral valve, should be the predominant causes of variations in mitral flow profiles. In addition to mitral flow characteristics, variations of systolic blood pressure (SBP ) and LVdP/dtmax were also measured. 4.1.1 Left ventricular properties
According to eq. (7), increases of λlv or P0,lv lead to lower in ventricular compliance and therefore an increase of Ped. Due to the exponential dependence to λlv, the effect of this parameter should be more significant than P0,lv. The result of this increased LV diastolic pressure is a reduced diastolic ventricular filling, since transmitral pressure gradient is decreased. This effect is clearly observed on the MFTI in fig. 6 (B). Moreover, the higher ventricular pressure lowers the both the E and A wave peaks, with a more significant effect on the latter. As a result of reduced diastolic filling, blood accumulates in the left atrium and pulmonary circulation, rising pulmonary circulation volumes and pressures, leading to pulmonary congestion, which is coherent with the fact that CRT patients usually suffer from dyspnea.
Regarding the systolic properties of the left ventricle, a rise of Ees,lvprovokes higher end-systolic pressures, which also augments the stroke volume. Since the circulation is a closed loop, a higher stroke volume implies a higher MFTI , as shown in fig. 6 (F). In contrast to the effect of diastolic properties, the higher systolic pressure shows a minor effect on the A wave, whereas the effect on the E wave is similar.
The parameters related to the driving function of the left ventricle are shown in fig. 6 (I–P). Here, higher Blv2 indicate a faster drop of the systolic contraction after its maximum value, which causes the ventricle to be relaxed longer. This relaxation enables the mitral flow to be wider, but the effect over E and A waves is limited to the range Blv2< 200 s−2, with a particular drop after 1100 s−2, caused by a detection artifact as the E wave becomes too wide. On the other hand, A waves show no significant change with respect to Blv2. Shorter Blv2 cause a longer systolic decay of the ventricle, which shortens the diastolic time and increases the diastolic pressures due to an inadequate relaxation. These elements impact on the passive filling in the same way as the changes on LV
diastolic properties. Finally, changes on the peak of the elastance driving function show the same behavior as the changes on AVD, since Clvrepresents the delay between the ventricle activation and the time of maximum contraction.
4.1.2 Left atrial properties
Higher Ela,max represents a higher atrial contractility which augments the ejection of blood towards the left ventricle during atrial systole. With the atrium contracting more strongly, an increase of A wave amplitude is visible in fig. 6 (Q–T), with little modification of RMITRR, since there is no truncation of the A wave. When the atrium empties more efficiently, the ventricular activity also benefits, showing an improvement in systolic pressure and LVdP/dtmax.
On the other hand, higher Ela,minvalues mean that atrial diastole is impaired by a stiffer wall. The reduction in the ratio between Ela,min and Ela,max results in an atrial systole with less amplitude, according to eq. (5). Therefore, high Ela,minvalues cause a reduction on the A wave peak value, with a lower stroke volume as shown by the degradation of MFTI in fig. 6 (V). An additional important observation regarding the effect of atrial properties on systolic blood pressure should be noted: after Ees,lv and λlv, atrial elastances Ela,minand Ela,max show a non-negligible effect over SBP of at most 10 mmHg. Changing these two parameters impacts on the efficiency of atrial contraction, modifying preload conditions and hence producing a stronger or weaker ventricular contraction due to the Frank-Starling mechanism.
4.2 Global sensitivity analysis
Local sensitivity analysis provide good insights on how the dynamics of the model and how the mitral flow is sensitive to some parameters. However this approach is not exhaustive, it does not consider all model parameters and it can miss important influences that are only visible in other parameter value configurations. In order to observe the sensitivity of the model outputs to all parameters and to compare the extent of all parameter effects, a screening approach by Morris15 was also studied. For a model output y(x) that depends on k parameters x= (x1, . . . , xk), an elementary effect is the effect of a perturbation of ∆ over a parameter xi:
EE∗ k =
|y(x1, . . . , xi, . . . , xk) − y(x1, . . . , xi+ ∆, . . . , xk)|
∆ . (10)
In a nutshell, the Morris elementary effects method consists in the evaluation of multiple, random EE∗ of each parameter, which then are summarized by its mean µ∗ and standard deviation σ. Once this is calculated for each parameter, one can identify important unimportant parameters when their µ∗and σ are low. Parameters with important linear effects have with significant µ∗ but lower σ, and parameter with high σ are either nonlinear or have an important interaction with other parameters. Finally, it is possible to determine a rank of importance among parameters, by calculating the Euclidean distance Si=p(µ∗i)2+ σ2i.
In previous works, the elementary effects method was used for a set of parameter of this model, but the ranges in which the parameters vary were physiologically unrealistic. In this work, the Morris method was applied to the model for all its parameters, each within physiologically consistent ranges that were determined from cardiovascular modeling literature, mainly from.8, 11, 13, 16 Results for the mitral flow E and A waves are presented in figs. 7 and 8. Mitral flow duration and time integral were analyzed but their graphical representation was not included due to space limitations. For all results, the mean and standard deviation plane is presented in the top panel; the bottom panel shows the parameters ordered according to their rank. However, only the 20 most important parameters are shown in order to improve the readability.
Sensitivity results for the E wave show a predominant effect from the left heart parameters Ela,minand Ees,lv. The effect of Ees,lv was already present in the local analysis, but the importance of Ela,min could have been missed by the previous approach. It also shows that passive ventricular filling is very sensitive to the pulmonary elastance parameters that directly affect the precharge. Peak A wave sensitivity is more dependent on the atrial properties, in particular Ela,minand the peak of atrial systole Cla. Additionally, it is sensitive to the rise of the LV driving function Blv1. This parameter defines how fast the ventricle reaches maximum systolic contraction and can truncate the active ventricle filling represented by the A wave. Mitral flow duration, which defines RMITRR, shows an important sensitivity to the waveform of the driving function for the left atrium and ventricle. These
Figure 6: Simulated mitral flow characteristics for different local parameter variations. (A–D): λlv, (E–H): Ees,lv, (I–L): Blv2, (M–P): Clv, (Q–T): Ela,max, (U–X): Ela,min.
Ela_min totalVolume E_pa E_pu R_mt 0 300 600 900 0 200 400 600 800 µ∗ σ ● ● ● ● ● ● ● ● ● ● ● ● ● ● ● ● ● ● ● ● 300 600 900 1200 Ela_min totalV
olume E_pa E_pu R_mt Ees_lvf Blv2 Vd_lvf Vo_lvf lambda_lvf lambda_r vf P o_lvf Ees_r vf R_pul R_la Vd_r vf V o_r vf Vd_vc lambda_pcd Clv Measure ●µ∗ σ Si
Figure 7: Elementary effects for E wave amplitude. Figure 8: Elementary effects for A wave amplitude.
results are also consistent with local sensitivity analysis: the driving functions directly define the shape of the pressures that generate mitral flow. Therefore, modifications on these parameters impact on E and A wave peak positions and decay rates. Finally, mitral flow time integral shows a sensitivity predominantly from left ventricle contractility parameters and parameters that modify the precharge of the left heart. In contrast to RMITRR results, MFTI depends less on the timing parameters. Consequently, MFTI is mainly defined by the mitral flow shape, rather than the duration of this curve.
5. CONCLUSIONS AND FURTHER WORK
This work proposes a model composed of an integration of several lumped-parameter models that is capable of generating mitral flow profiles similar to those observed clinically during standard echographic examinations. After close examination of local and global parameter variations, sensitivity analyses showed how atrial and ventricular parameters impact on the main characteristics of mitral flow profiles. Moreover, the global analysis identified the most influential parameters on mitral flow profiles. In particular, the atrial properties and ventricle diastolic properties appear to be equally of more influent as systolic parameters. The next step of this research is to design a parameter identification process that would reproduce the mitral curves of a patient, using the available data of an AVD optimization session for CRT. Such optimization would benefit from the analyses presented in this work by focusing only in the most important parameters and by guiding the identification process with the improved understanding the mitral flow dependence to the model parameters.
6. ACKNOWLEDGMENTS
This study was supported by R´egion Bretagne, France, who grants a research allocation (ARED) to the first author of this work.
REFERENCES
[1] Cazeau, S., Leclercq, C., Lavergne, T., Walker, S., Varma, C., Linde, C., Garrigue, S., Kappenberger, L., Haywood, G. A., Santini, M., Bailleul, C., Daubert, J. C., and , M. S. i. C. M. U. S. T. I. C. S. I., “Effects of multisite biventricular pacing in patients with heart failure and intraventricular conduction delay.,” N Engl J Med 344, 873–880 (Mar 2001).
[2] Coatrieux, J. L., Hern´andez, A. I., Mabo, P., Garreau, M., and Haigron, P., “Transvenous path finding in cardiac resynchronization therapy,” in [Functional Imaging and Modeling of the Heart], 236–245, Springer (2005).
[3] McAlister, F. A., Ezekowitz, J., Hooton, N., Vandermeer, B., Spooner, C., Dryden, D. M., Page, R. L., Hlatky, M. A., and Rowe, B. H., “Cardiac resynchronization therapy for patients with left ventricular systolic dysfunction: a systematic review.,” JAMA 297, 2502–2514 (Jun 2007).
[4] Ritter, P., Padeletti, L., Gillio-Meina, L., and Gaggini, G., “Determination of the optimal atrioventricular delay in DDD pacing. comparison between echo and peak endocardial acceleration measurements.,” Europace 1, 126–130 (Apr 1999).
[5] Jansen, A. H., Bracke, F. A., van Dantzig, J. M., Meijer, A., van der Voort, P. H., Aarnoudse, W., van Gelder, B. M., and Peels, K. H., “Correlation of echo-doppler optimization of atrioventricular delay in cardiac resynchronization therapy with invasive hemodynamics in patients with heart failure secondary to ischemic or idiopathic dilated cardiomyopathy,” The American Journal of Cardiology 97(4), 552 – 557 (2006). [6] Gold, M. R., Niazi, I., Giudici, M., Leman, R. B., Sturdivant, J., Kim, M. H., Yu, Y., Ding, J., and Waggoner,
A. D., “A prospective comparison of AV delay programming methods for hemodynamic optimization during cardiac resynchronization therapy,” Journal of cardiovascular electrophysiology 18(5), 490–496 (2007). [7] Koon, K. T. V., Thebault, C., Le Rolle, V., Donal, E., and Hern´andez, A. I., “Atrioventricular delay
optimization in cardiac resynchronization therapy assessed by a computer model,” in [Computing in Cardiology, 2010 ], 333–336, IEEE (2010).
[8] Smith, B., Andreassen, S., Shaw, G., Jensen, P., Rees, S., and Chase, J., “Simulation of cardiovascular system diseases by including the autonomic nervous system into a minimal model,” Computer methods and programs in biomedicine 86(2), 153–160 (2007).
[9] Hern´andez, A., Carrault, G., Mora, F., and Bardou, A., “Model-based interpretation of cardiac beats by evolutionary algorithms: signal and model interaction,” Artificial Intelligence in Medicine 26(3), 211–235 (2002).
[10] Le Rolle, V., Hern´andez, A. I., Richard, P.-Y., Donal, E., and Carrault, G., “Model-based analysis of myocardial strain data acquired by tissue doppler imaging,” Artificial Intelligence in Medicine 44(3), 201–219 (2008).
[11] Chung, D., Niranjan, S., Clark, J., Bidani, A., Johnston, W., Zwischenberger, J., and Traber, D., “A dynamic model of ventricular interaction and pericardial influence,” American Journal of Physiology-Heart and Circulatory Physiology 272(6), H2942 (1997).
[12] Guarini, M., Urz´ua, J., Cipriano, A., and Gonz´alez, W., “Estimation of cardiac function from computer analysis of the arterial pressure waveform,” IEEE Trans Biomed Eng 45, 1420–1428 (Dec 1998).
[13] Heldt, T., Shim, E. B., Kamm, R. D., and Mark, R. G., “Computational modeling of cardiovascular response to orthostatic stress,” J Appl Physiol 92, 1239–1254 (Mar 2002).
[14] Whinnett, Z. I., Davies, J. E., Willson, K., Manisty, C. H., Chow, A. W., Foale, R. A., Davies, D. W., Hughes, A. D., Mayet, J., and Francis, D. P., “Haemodynamic effects of changes in atrioventricular and interventricular delay in cardiac resynchronisation therapy show a consistent pattern: analysis of shape, magnitude and relative importance of atrioventricular and interventricular delay,” Heart 92, 1628–1634 (Nov 2006).
[15] Morris, M., “Factorial sampling plans for preliminary computational experiments,” Technometrics 33, 161–174 (May 1991).
[16] Lu, K., Clark, J. W., Ghorbel, F. H., Ware, D. L., and Bidani, A., “A human cardiopulmonary system model applied to the analysis of the valsalva maneuver,” Am J Physiol Heart Circ Physiol 281, 2661–2679 (Dec 2001).