HAL Id: halshs-00452561
https://halshs.archives-ouvertes.fr/halshs-00452561
Submitted on 2 Feb 2010
HAL is a multi-disciplinary open access
archive for the deposit and dissemination of sci-entific research documents, whether they are pub-lished or not. The documents may come from teaching and research institutions in France or
L’archive ouverte pluridisciplinaire HAL, est destinée au dépôt et à la diffusion de documents scientifiques de niveau recherche, publiés ou non, émanant des établissements d’enseignement et de recherche français ou étrangers, des laboratoires
Ageing and retirement age. What can we learn from the
Overlapping Generations Model ?
Antoine d’Autume
To cite this version:
Antoine d’Autume. Ageing and retirement age. What can we learn from the Overlapping Generations Model ?. 2003. �halshs-00452561�
Ageing and retirement age.
What can we learn from the Overlapping Generations Model ?
Antoine d'Autume EUREQua, University Paris I
Révisé, avril 2003
Abstract
In this paper, the two-period OLG model has been modified to distinguish the effects of individual ageing from changes in the birth rate. Optimal pension and retirement age policies have been characterized in a dynamic framework. We have considered a mixed pension scheme that is fully funded, but offers agents an actuarially fair choice on their retirement age. We show that this mixed pension scheme makes it possible to implement the optimal solution. The numerical simulations describe the dilemmas France currently faces.
Vieillissement et choix de l'âge de la retraite. Que peut nous dire le modèle à générations ?
Résumé
Nous enrichissons le modèle à générations habituel de manière à distinguer les effets du vieillissement de ceux de la baisse de la natalité. Nous caractérisons les niveaux optimaux des pensions de ceux de l'âge de la retraite dans un cadre dynamique. Nous montrons qu'un système de retraite mixe, reposant sur la répartition mais ouvrant aux agents la possibilité de choisir leur âge de retraite de manière actuellement neutre, permet de mettre en œuvre la solution optimale. Des simulations numériques décrivent les dilemmes auxquels la France est actuellement confrontée.
EUREQua, Maison des Sciences Economiques, Université Paris I, 106-112 boulevard de l'Hôpital, 75013 Paris, France.
In1 many countries, population ageing and the drop in birth rates
af-fect the future of social security systems. Existing pay-as-you-go systems are threatened by demographic evolutions, and many people have been advocat-ing a switch towards partially- or fully-funded systems. Ageadvocat-ing, in particular, raises the issue of retirement age. This age was fixed at 60 in France some years ago, but it is doubtful that this rule will be able to be maintained as life expectancy is expected to continue increasing.
Is it not possible, however, to allow agents the freedom of choosing their retirement age while maintaining the financial balance of social security in-stitutions? A fully-funded system obviously satisfies this requirement. Yet, it is also possible to design a mixed system that keeps the general character of an unfunded system, while offering agents the possibility of choosing their retirement age in an actuarially fair way. The current French debate seems to favor the adoption of such a system. Our framework proves to be particularly adequate for discussing its properties.
The Overlapping Generations Model of Samuelson and Diamond provides a natural tool for studying the interactions between demographic and eco-nomic phenomena. Its simple, two-period version has been wonderfully useful in clarifying a host of theoretical issues in dynamic economic theory. It is too rudimentary, however, to capture demographic changes. A constant birth rate is usually the only demographic parameter that appears in the model. Applied economists have, therefore, been compelled to simulate fully-fledged OLG models with up to 40 generations. Alternatively, some economists find stochastic models in the spirit of Blanchard(1985) and Gertler(1999) more tractable, where individuals face constant probabilities of changing states. While these two kinds of models have unquestionably provided interesting quantitative results, and have thus added to our understanding of the is-sues, they run the risk of losing the theoretical perspective necessary for adequately discussing policy problems. In particular, they often focus on stationary states and ignore transitions.
The simple, two-period OLG models thus continue to offer a useful ap-proach to discussing fundamental issues in the operation of social security systems. Moreover, it is possible to introduce ageing into the model while keeping its structure simple. We can simply assume that agents do not live out their entire second period of life. This paper tries to show that this trick is useful for analyzing the policy dilemmas generated by ageing, and is even useful for getting to some quantitative results. This paper thus adds a new
1I would like to thank Hippolyte d’Albis, Amandine Brun, Daniel Cohen, Michèle
Debonneuil, Bruno Decreuse, Cecilia Garcia-Peñalosa, Jean-Olivier Hairault, Philippe Michel and Bertrand Wigniolle for discussions on this topic. This paper was presented at the GREQAM 20th Anniversary, Marseille, June 2002.
parameter to papers such as Michel-Pestieau(1999), who have already dis-cussed the choice of retirement age in a two-period OLG model.
The first section presents the theoretical structure of the model and shows that it can be calibrated to describe the French case. In the second section, we analyze individual behavior and equilibrium dynamics when agents are free to choose their retirement age and face an actuarially fair pension scheme during their second period of life. We then restate the important property of debt neutrality. We characterize optimal paths and show that they can be implemented through the pension scheme we have considered. To conclude, we discuss the numerical simulations that describe the French case.
1
Ageing in the Standard OLG Model
We will adopt the standard OLG framework where agents’ lives are divided into two periods of length one. We assume, however, that the agents’ lives do not cover the entire second period. Their lives are limited to a portion T of the second period. T is deterministic, exogenous and smaller than one.
Let Nt be the number of young agents born at date t. Young agents are
only fertile so that Nt = (1 + nt)Nt−1, where nt is the current fertility rate
of young agents. The average number of old people living during period t is TtNt−1, making the total population:
(1 + nt+ Tt) Nt−1
Note that under stable conditions, the population growth rate is equal to n and independent of T . Ageing thus appears to be a phenomenon that is distinct from the changes in the birth rate.
Agents choose to work a portion zt ≤ Tt of their second period of life.
Employment during period t is:
Lt = (1 + nt+ zt) Nt−1 (1)
whereas the number of retired agents is: (Tt− zt) Nt−1
The dependency ratio is defined as the ratio between retired and employed people, namely:
Tt− zt
1 + nt+ zt
We will consider a pure, pay-as-you-go pension scheme where workers contribute a proportion θ of their wages and retired agents receive a pension
that amounts to a proportion λ of current wages. The budget balance of the social security fund imposes:
θt =
T − zt
1 + nt+ zt
λt (2)
The required tax rate is the product of the dependency ratio and the replacement rate.
It is useful to introduce the calibration we will be using right from the start.
Calibration
The length of each period is 35 years. The first period covers ages 20 to 55, and the second period ages 55 to 90.
Initially, population grows at a rate of 0.375% per year, that is 0.14 per 35-year period. Agents live for 55+23 = 78 35-years. Retirement age is 55+5 = 60 years. Thus,
n = 0.14, T = 23/35, z = 5/35
The dependency ratio is:
18
35× 1.14 + 5 = 40%
A tax rate θ = 20% is required to support a replacement rate λ = 50%. We suppose that demographic changes lead to a zero rate in population growth as well as an increased average life span of 88 years. If retirement age does not change, the new data are:
n = 0, T = 33/35, z = 5/35
The dependency ratio thus becomes: 28
35 + 5 = 70%
If one wishes to maintain the replacement rate, the tax rate must increase to 35%. Alternatively, maintaining the current tax rate leads the replacement rate to fall to 29%. An intermediate, and more sensible solution, would be to maintain the replacement rate calculated with respect to net wages. The choice is then to keep λnet = λ/(1− θ) constant at its initial value of .625. This requires a new value of θ, such that θ/(1 − θ) = λnet × .7, meaning θ = .30. In that case, the replacement rate calculated with respect to gross wages falls to λ = .43.
This is a rough calibration, but is in strong accordance with Charpin(1999), who has analyzed for the government the problems the French social security system will face over the next forty years.
2
Individual Behavior
We will first consider a social security system with fixed pensions. Retired agents receive a pension fixed at a given proportion λ of current wages per unit of time.
Individual behavior is described by the following program: max U (ct, dt+1, zt+1)
ct+ st = (1− θt)wt (3)
dt+1= (1 + rt+1) st+ (1− θt+1)wt+1zt+1+ (T − zt+1)λt+1wt+1 (4)
The agents consume ct and dt+1 during their two periods of life, and
decide on their retirement age zt+1. Their utility function U increases with
both consumption levels and decreases with the retirement age. This utility function will be made more explicit later. Young agents earn a wage wt and
contribute to social security at rate θt . They save st. Old agents earn the
real interest rate rt+1 on their savings. They earn wages in proportion to
the length of their working period zt+1, and pensions in proportion to their
retirement period (T − zt+1).
Let Rt+1 = 1 + rt+1be the interest factor. The life cycle budget constraint
is: ct+ dt+1 Rt+1 = (1− θt)wt+ λt+1wt+1T + (1− θt+1− λt+1)wt+1zt+1 Rt+1 (5)
The optimality conditions are the following: Ud(ct, dt+1, zt+1) Uc(ct, dt+1, zt+1) = 1 Rt+1 (6) Uz(ct, dt+1, zt+1) Uc(ct, dt+1, zt+1) = −(1 − θt+1− λt+1)wt+1 Rt+1 (7) As has often been noted, the marginal gain of deferring retirement is reduced both by payroll taxes and forgone benefits. If pensions were fixed and the retirement age was left to the agent to decide, people would obviously be encouraged to retire early.
We will thus consider another pension scheme. One possibility is to switch from fixed pensions to an actuarially neutral system where the pension de-pends on contributions, and therefore, the retirement age. An obvious way
to do this is to simply adopt a fully-funded system. Another possibility, however, is to maintain a pay-as-you-go system, while offering agents an actuarially neutral system for the second part of their lives. We will now consider this case.
The pension scheme has two elements. The government first decides on the overall rate of return to be applied to the social contributions made by agents during the first part of their lives. Agents are free, however, to pro-long their working period, knowing that the financial consequences of this prolongation will be actuarially fair. The discounted value of supplementary social security contributions should be equal to supplementary pensions, tak-ing into account that these will be earned over a shorter period. In a sense, early contributions to a pay-as-you-go system entitle agents to a gift, but they are free to stretch it over time if they wish.
This idea can easily be incorporated into our framework. Formally, we assume:
(T − zt+1)λt+1wt+1− θt+1wt+1zt+1 = µt+1θtwt (8)
The left-hand side of this relation is the balance between pensions and contributions during an agent’s second period of life. In our framework with-out intra-period discounting, it reduces to a simple difference. This amount represents the return on contributions θtwt made during the first period of
life. The rate of return µt+1 on these contributions is a policy parameter. Agents know that replacement rate λt+1depends on retirement age zt+1,and
is implicitely determined by the above relationship.
In the case of a (mandatory) fully-funded system, the rate of return is µt+1= Rt+1. The second period budget constraint (4) is:
dt+1= (1 + rt+1) st+ wt+1zt+1+ Rt+1θtwt
and the discounted life-cycle budget constraint (5) reduces to: ct+ dt+1 Rt+1 = wt+ wt+1zt+1 Rt+1
The pension scheme is actuarially fair over the agents’ entire life. It has no influence on individual behavior. In particular, the opportunity cost of retirement is reduced to the wage rate.
In the case of a pay-as-you-go system, net transfers to old agents must equal the young agents’ contributions. Parameter µt+1is such that:
The second period budget constraint is:
dt+1= (1 + rt+1) st+ wt+1zt+1+ (1 + nt+1)θt+1wt+1 (10)
From the agents’ point of view, it is the same as if there were no contri-butions on second period wages and retired agents received a full pension, independent of retirement age.
The life-cycle budget constraint is: ct+ dt+1 Rt+1 = wt(1− θt) + wt+1zt+1+ (1 + nt+1)θt+1wt+1 Rt+1 (11) = wt+ wt+1zt+1 Rt+1 + · (1 + nt+1) θt+1wt+1 θtwt − R t+1 ¸ θtwt Rt+1
The opportunity cost of retirement is still equal to the wage rate. This ensures that individual choice of retirement age is not biased. However, agents benefit, as in standard pay-as-you-go systems, from a net transfer that can be positive or negative. This transfer stems from the difference between the rates of return of unfunded and funded social security systems. The first one is the population rate of growth, augmented by wage growth, and possibly the increase in the rate of contribution. The second one is the interest rate. Hereafter, we will adopt this set of assumptions. The optimality condi-tion (6) still holds, while (7) is replaced by:
Uz(ct, dt+1, zt+1)
Uc(ct, dt+1, zt+1)
= −wt+1 Rt+1
(12) We choose the following utility function:
U = Log c + βi T [m Log (d/T ) + (1− m) Log ((T − z)/T )] (13) During the second period, the agents consume a flow d/T . They enjoy a cumulative span of leisure T − z, which is appreciated as a proportion of their life span T . Instantaneous second-period utility is cumulated over their life span T . The discount factor is βi.
A logarithmic specification, implying a unitary intertemporal elastic-ity of substitution, is required to make preferences consistent with technical progress and a steady growth of real wages. On the steady state growth path, retirement age will be stabilized while income and consumption grow. More-over, this logarithmic specification makes it possible to explicitly characterize equilibrium and optimal dynamics.
The life-cycle budget constraint (11) can be written as: ct+ dt+1 Rt+1 +wt+1(T − zt+1) Rt+1 = = wt(1− θt) + wt+1T + (1 + nt+1)θt+1wt+1 Rt+1 def = Ωt
and leads to the following demand functions: ct= 1 1 + βiT Ωt (14) dt+1 = mβiT Rt+1 1 + βiT Ωt (15) T − zt+1 = (1− m)βiT Rt+1 (1 + βiT ) wt+1 Ωt (16)
We can check their properties with respect to technical progress. If both wt and wt+1 double, Ωt, ct and dt+1 double while T − zt+1 is left unchanged.
We can also examine the influence of ageing. Other things being equal, the elasticity of consumption with respect to T can be expressed in the following way: dct ct = Ã − βiT 1 + βiT + wt+1T (1−θt)wtRt+1+(1+nt+1)θt+1wt+1 1 + wt+1T (1−θt)wtRt+1+(1+nt+1)θt+1wt+1 ! dT T
An increase in life span T means increases in both second-period de-sired consumption and second-period income. We may, therefore, expect its influence on savings to be ambiguous. This is indeed what is shown by the formal derivation. The first-period consumption elasticity depends on the re-lationship between the discount factor, which weighs the utilities of the two periods, and the ratio between the incomes associated with the two periods, or more precisely, the ones that depend on T and the ones that do not. For instance, we have dc/c = 0 in the benchmark case where wages are constant, social security absent and the rate of interest equal to the rate of discount, namely Rt+1= βi.
On the other hand, we have: d(T − z) T − z = dT T + dc c and therefore: dz z = dT T − T − z z dc c
If c were to remain constant, retirement age z would increase in the same proportion as life span T . In our simulations, a high interest rate reduces the impact of second-period income. Consumption decreases so that the retirement age increases more than proportionnally to the life span. This, however, applies to a work span that is smaller than the life span. Eventually, the absolute increase in z turns out to be about two-thirds of the increase in T.
3
Equilibrium Dynamics
The production side is standard. We assume constant returns to scale and labor-augmenting technical progress. The technological level A grows at con-stant rate γ. Let K, L and Y be capital, employment and production, re-spectively. The production function is Y = F (K, AL) or, in intensive terms:
y = f (k), y = Y AL, k = K AL (17) Employment is: Lt= Nt µ 1 + zt 1 + nt 
where Nt is the number of young agents. It is useful to define a
second kind of capital intensity, in terms of the number of young agents: kn = K AN = k µ 1 + z 1 + n ¶ (18) Capital depreciation is equal to one. The real interest rate and the real wage are given by the following relationships:
1 + rt = f0(kt), wt= At[f (kt)− ktf0(kt)] def
= Atw(k˜ t) (19)
The young agents’ savings must be equal to the capital stock, so that Kt+1 = Ntst or:
(1 + nt+1)(1 + γt+1)k n
t+1= st/At
The pension scheme is the pay-as-you-go system with an actuarially fair choice of retirement age summed up by equation (10). The government fixes the contribution rate θ and adjusts pensions so that the social security fund is balanced for each period.
Older agents choose their retirement age. The second period maximization under constraint (10) yields:
wt(Tt− zt) = (1− m) [Rtst−1+ wtTt+ (1 + nt) θtwt]
Along the equilibrium path, st−1 = At(1 + nt) ktn = Atkt(1 + zt+ nt) ,
and we obtain: Tt− zt= (1− m) · ktf0(kt) f (kt)− ktf0(kt) (1 + zt+ nt) + Tt+ (1 + nt) θt ¸
Thus, retirement age only depends on kt and current parameters.
The assumption of a Cobb-Douglas production function implies a con-stant share of capital α, and allows for an explicit determination of zt. We
obtain:
zt=
mTt− (1 − m) (1 + nt) (θt+ α/(1− α))
1 + (1− m)α/(1 − α) (20)
Retirement age only depends on current demographic parameters. It is constant if the environment is constant. An increased life span T sensibly leads to a higher retirement age. On the contrary, an increase in the birth rate n or the contribution rate θ increases pensions and induces agents to retire earlier.
Finally, the dynamics are described by: (1 + nt+1)(1 + γt+1)k n t+1 = = (1−θt) ˜wt− 1 1 + βiTt+1 · (1− θt) ˜wt+ (1 + γt+1) ˜wt+1[Tt+1+ (1 + nt+1)θt+1] Rt+1 ¸ (21) where: Rt= f0 · ktn/ µ 1 + zt 1 + nt ¶¸ , w˜t= ˜w · ktn/ µ 1 + zt 1 + nt ¶¸
and zt is determined through (20) .
It is easy to check that this equation has a stable stationary point when the environment is constant.
4
The Neutrality of Public Debt
We assume that the government issues debt, which is a perfect substitute for physical capital. This relaxes the constraint that social contributions and pensions should balance for each period.
In our framework with inelastic labor supply, social contributions and pensions appear as lump-sum transfers. Moreover, the actuarial pension scheme ensures that social security has no direct effect on the choice of re-tirement age. In this setting, public debt is irrelevant. This can be proved in the following way.
Let bt = Bt/AnNt be the amount of public debt per young agent in
efficiency units. Similarly, let gt, X1,t and X2,t be an exogenous amount of
public spending and lump-sum transfers at date t to young and old agents. All these variables are in terms of efficiency units. Social security payments are included in transfers X1 and X2.
Written in efficiency units, individual budget constraints are now: ˜ ct+ ˜st= ˜wt+ X1,t (22) ˜ dt+1+ ˜wt+1(Tt+1− zt+1) = Rt+1 1 + γt+1 ˜ st+ ˜wt+1Tt+1+ X2,t+1 (23)
The government budget constraint is:
(1 + nt+1)(1 + γt+1)bt+1= Rtbt+ gt+ X1,t+
X2,t
1 + nt
(24) Young agents’savings are held as capital or public debt:
˜ st= (1 + nt+1)(1 + γt+1) ¡ kt+1n + bt+1 ¢ (25) This yields the following evolution of capital:
(1 + n)(1 + γ)kt+1n = ˜wt+ X1,t− ˜ C Ã ˜ wt+ X1,t+ ¡ 1 + γt+1¢( ˜wt+1Tt+1+ X2,t+1) Rt+1 , rt+1, ˜wt+1 ! −(1+nt+1)(1+γt+1)bt+1 (26) while the retirement age is determined as:
Tt− zt=⊕
µ Rt
1 + γts˜t−1+ ˜wtTt+ X2,t, ˜wt 
and factor prices are determined following the previous lines.
The model is completed by equation (24) , which describes the evolution of debt.
Consumption and retirement functions ˜C and Φ can be left undetermined. The arguments for consumption are life-cycle income, the interest rate and the wage rate. The arguments for the retirement functions are second-period exogenous income and the wage rate.
Thus, for given paths of transfers X1 and X2, we are led to a dynamic
system with two predetermined variables kn and b.
It is uncessary, however, to solve this system.
First note that individual constraints (22), (23) and equation (25)imply: ˜ ct+ (1 + nt+1)(1 + γt+1)k n t+1= ˜wt+ X1,t− (1 + nt+1)(1 + γt+1)bt+1 ˜ dt+1+ ˜wt+1(Tt+1− zt+1) = Rt+1(1 + nt+1)knt+1+ ˜wt+1Tt+1+ X2,t+1+ Rt+1(1 + nt+1)bt+1
Let us define net transfers to the two generations as: ¯
X1,t= X1,t− (1 + nt+1)(1 + γt+1)bt+1 (27)
¯
X2,t= X2,t+ Rt(1 + nt)bt (28)
The discounted sum of net transfers is equal to the discounted sum of actual transfers: ¯ X1,t+ (1 + γt+1) ¯X2,t+1 Rt+1 = X1,t+ (1 + γt+1)X2,t+1 Rt+1
while the government budget constraint is reduced to a static rela-tionship. gt+ ¯X1,t+ ¯ X2,t 1 + nt = 0 (29)
Finally, the dynamics are described by the following system: (1 + nt+1)(1 + γt+1)kt+1n = ˜wt+ ¯X1,t− ˜ C Ã ˜ wt+ ¯X1,t+ ¡ 1 + γt+1 ¢ ¡ ˜ wt+1Tt+1+ ¯X2,t+1 ¢ Rt+1 , rt+1, ˜wt+1 ! (30) Tt− zt = Φ ¡ Rt (1 + nt) knt + ˜wtTt+ ¯X2,t, ˜wt ¢ (31)
This brings us back to a model without public debt. Net transfers ¯X1 and
¯
X2have replaced actual transfers X1and X2,as well as all payments linked to
public debt. This proves that public debt does not enlarge the feasibility set. We may as well assume that the government only uses lump-sum transfers with a balanced budget for each period.
This result obviously has bearing on the analysis of pension schemes. As Belan-Pestieau(1999) underline, fully-funded and unfunded systems are really equivalent, provided that the governement can freely use debt and lump-sum transfers.
As an example, let us assume that the government wishes to switch from a pay-as-you-go system to a funded system. In order to pay for the pensions of the current old generation, the government borrows and plans to impose in the future lump-sum contributions on both generations, so as to progressively decrease its debt.
The government is able to implement exactly the same evolution, in every respect, without discarding the pay-as-you-go system and without incurring any debt. Initial contributions substitute for initial borrowing, which leads to the same decrease in consumption by young agents from the first generation. The subsequent progressive decline in debt and lump-sum taxes is replaced by a phasing-out of social security contributions and pensions. Thus, the pay-as-you-go system disappears smoothly, without any need for public debt or taxation.
The neutrality result also implies that for our framework, the correct methodology is to characterize optimal trajectories before examining how they can be implemented through lump-sum transfers.
5
Characterization of the Optimum
Before characterizing optimal intertemporal allocations, let us recall the def-inition of the golden rule, which will serve as a benchmark for characterizing the long-run growth path.
With exogenous technical progress, the aim is to compare steady-state growth paths. With our logarithmic specification, U (ct, dt+1, zt+1) =
U³˜ct, (1 + γ) ˜dt+1, zt+1
´
+ h(At),where h(A) is a linear function. For a given
exogenous trend At, the problem is to maximize the first part of the objective
function.
The golden rule is defined as the solution to the following problem: max U³c, (1 + γ) ˜˜ d, z´
˜ c + d˜ 1 + n = µ 1 + z 1 + n ¶ [f (k)− (1 + n)(1 + γ)k]
The solution is to first choose k, which maximizes f (k) − (1 + n)(1 + γ)k. This provides the golden rule proper
f0(k) = (1 + n)(1 + γ) (32)
which roughly states that the interest rate must be equal to the growth rate, namely population growth plus technical progress. This determines the golden rule capital intensity kG. Note that:
f (kG)− (1 + n)(1 + γ)kG = f (kG)− f0(kG)kG = ˜w¡kG¢
Optimization with respect to ˜c, d and z thus yields the following condi-tions: Ud ³ ˜ c, (1 + γ) ˜d, z´ Uc ³ ˜ c, (1 + γ) ˜d, z´ = 1 f0(kG) (33) Uz ³ ˜ c, (1 + γ) ˜d, z´ Uc ³ ˜ c, (1 + γ) ˜d, z´ = −(1 + γ) ˜w¡kG¢ f0(kG) (34)
The marginal rate of substitution between the two consumption levels is equal to the interest factor. The marginal rate of substitution between retire-ment leisure and first-period consumption is equal to the discounted value of the implicit wage rate, taking into account, as we observed, productivity growth.
We will now turn to intertemporal optima. Rather than analyzing the complete set of optimal allocations, we will focus on optima associated with a given social rate of discount. Let β be this social rate of discount. The problem is: max U (c−1, d0, z0) + ∞ X t=0 βt+1U (ct, dt+1, zt+1) (1+n)(1+γ)knt+1+ ct At + 1 1 + n dt At = µ 1 + zt 1 + n ¶ f à knt 1 + zt 1+n ! , t = 0, ... (35) k0n and c−1 given
The optimality conditions are the following: Uc(ct, dt+1, zt+1) = xt/At (36) Ud(ct, dt+1, zt+1) Uc(ct, dt+1, zt+1) = 1 f0(kt+1) (37) Uz(ct, dt+1, zt+1) Ud(ct, dt+1, zt+1) =−At+1w (k˜ t+1) (38) (1 + n)(1 + γ)xt= βf0(kt+1)xt+1 (39)
Given our utility specification, these relations take the following form: (1 + γ) ˜dt+1 ˜ ct = mβiTt+1Rt+1 (40) (1− m) ˜dt+1 m (Tt+1− zt+1) = ˜w (kt+1) (41) ˜ ct+1 ˜ ct = βf 0(k t+1) (1 + nt+1)(1 + γ) (42) If demographic parameters are constant, a long-run stationary point ex-ists. This point is a balanced growth path where production, capital and consumption grow at the rate of technical progress, while the age of retire-ment remains constant.
At this stationary point, the augmented golden rule applies. The interest rate is such that:
1 + r = f0(k) = (1 + n)(1 + γ)
β (43)
This optimal path can be decentralized through the kind of social secu-rity system we have considered. Facing an actuarially fair pension scheme, old agents choose retirement age so as to satisfy (38). The equilibrium consump-tion profile satisfies (6) , which is identical to (37). Lump-sum contribuconsump-tions and pensions can be used to achieve optimal consumption and capital accu-mulation.
We only need to choose a contribution rate θt such that:
(1− θt) ˜wt= ˜ct+ ˜st =
˜
ct+ (1 + γ) (1 + nt+1+ zt+1) kt+1 (44)
The choice of a logarithmic utility function and a Cobb-Douglas technol-ogy with complete depreciation makes it possible to find an explicit solution when the environment is constant. As in Long-Plosser(1983), consumption is a constant proportion of production. More novel is the fact that the optimal age of retirement is constant during the transition to the long-run equilib-rium, as is the implicit optimal rate of taxation.
We will check in the Appendix that the optimal trajectory can be de-scribed as follows: kt+1= αβ (1 + n)(1 + γ)f (kt) (45) ˜ ct= ξ µ 1 + z 1 + n ¶ f (kt) , with ξ = 1− αβ 1 + mβiT /β (46) ˜ dt ˜ ct = (1 + n)mβiT β (47) 1 + z 1 + n = 1− α 1− α + (1 − m)ξT βi/β µ 1 + T 1 + n ¶ (48) θ = 1− ξ + αβ 1− α µ 1 + z 1 + n ¶ (49) The constant retirement age z is a decreasing function of the birth rate n, and, for plausible parameter values, an increasing function of T . The contribution rate θ needed to support the optimal path is also constant. It increases with n and T . We will comment on these sensible properties in the following section.
6
Numerical Simulations of a Demographic
Shock
We will use the model to describe possible responses to the demographic changes France is experiencing. What can be done when the dependency ratio is predicted to increase from 40% to 70% during one generation?
We recall that the initial situation is described by the following parame-ters:
A demographic shock at date 0 leads to:
n = 0, T = 33/35
The calibration of the model is the following:
α = 0.3, γ = 0.7
βi = 1.6405, m = 0.6417, β = 0.4845
The production function is Cobb-Douglas with complete depreciation and. α is the elasticity of capital.
As the period is 35 years long, the population and the technical progress growth rates n = 0.14 and γ = 0.7 correspond to yearly rates of 0.375% and 1.5%, respectively. Parameters m, βi and β are chosen to generate a long-run real interest rate equal to 3 — 4% per year — and to ensure that the initial social security scheme is optimal. The retirement age is 60 years old, meaning z = 5/35, while the tax rate is θ = 20% and the replacement rate λ = 50%.
One element of the calibration is unsatisfactory. The ratio dt/ct between
the consumption levels of the two generations is equal to 1.6, which means that the ratio (dt/T ) /ct between the instantaneous flows of consumption
is even larger at 2.5. The problem is that, with this model, it is difficult to ensure enough savings. In comparison with the standard Diamond model, the assumptions that people work during their second period of life, that they do not live out their entire second period and that social security exists tend to decrease the desire to save. We thus had to exaggerate desired, second-period consumption and choose high levels for βi and m, or rather for the product βim. As mentioned above, we also tried to use a CES utility function, with
the utility of labor augmented by technical progress. It turned out that this offered little scope to obtain a more satisfactory equilibrium consumption profile.
Table 1 presents our benchmark as well as the influence of the social rate of discount on the long-run optimal allocation. We are in a case of undercap-italization, as r = 3 > γ + n = 0.84. The benchmark allocation is optimal when β = .48. It is characterized by positive pensions and contributions of young agents. An increase in β means that society puts more weight on the future. The economy saves more and accumulates more capital. The long-run allocation moves towards the Golden Rule. The way to implement this change is to decrease the size of social security, as it will induce agents to save more. For a social rate of discount β = 0.66, transfers are zero and the economy reaches the Diamond equilibrium. Negative pensions and taxes are needed to get closer to the golden rule, which is attained for β = 1.
Table 1 also reports optimal levels of the retirement age z. Retirement age increases when the economy gets closer to the golden rule. The reason is simply that more capital means higher wages and lower interest rates. The opportunity cost of leisure increases and agents choose to work more during their second period of life.
β θ λ z r c d d/T u benchmark .48 .2 .5 5/35 3 5.28 8.60 13.08 3.72 .54 .13 .35 5.9/35 2.59 5.88 8.59 13.07 3.80 .6 .065 .18 6.6/35 2.23 6.50 8.54 13.00 3.88 Diamond .66 0 0 7.3/35 1.94 7.08 8.46 12.87 3.94 Golden rule 1 -.31 -1.35 11.2/35 .94 9.66 7.62 11.60 4.07
Table 1 : Influence of the social rate of discount(n = .14, T = 23/35)
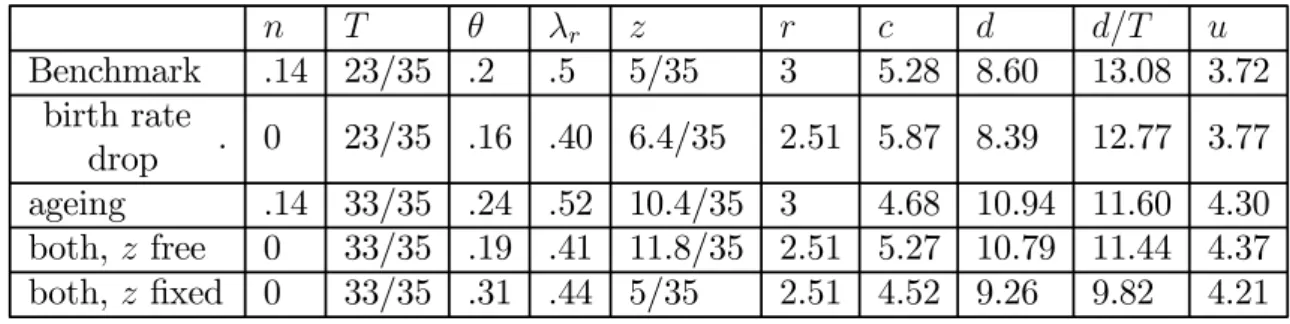
Table 2 illustrates the optimal long-run response to demographic changes. According to the augmented golden rule, a drop in the birth rate leads to a drop in interest rates and allows for an increase in capital per worker. This increases wages and induces a moderate increase in the retirement age. This in turn makes it possible to decrease the tax rate, and especially the replacement rate. The drop in the birth rate turns out to be a good thing. Agents’ utility increases in the long run. A lower birth rate makes it more difficult to finance pensions, but also makes it easier to reach higher levels of capital per worker. This positive effect dominates in the long run.
Population ageing does not affect the long-run interest rate. The need to transfer purchasing power to the future has to be based on an increase in pensions and contributions. Rather naturally, a longer life span makes it optimal to defer retirement age. Using our calibration, 10 more years to live leads to 5.4 more years to work. Utility increases. Utility comparisons are problematic when T changes, because this parameter intervenes in the utility function. The result, however, is rather sensible as a longer life means a longer flow of utility.
When both changes are considered simultaneously, the optimal age of retirement becomes even higher as it increases by 6.8 years. This increase allows for a small drop in the tax rate.
What is the optimal response to the demographic shock if the retirement age cannot be changed? Interest rates and capital intensities stay the same. An increase in contribution is unavoidable. The optimal tax rate reaches
31%, when it is only 19% if the retirement age is deferred. By definition, utility is higher if the retirement age is allowed to adjust.
n T θ λr z r c d d/T u Benchmark .14 23/35 .2 .5 5/35 3 5.28 8.60 13.08 3.72 birth rate drop . 0 23/35 .16 .40 6.4/35 2.51 5.87 8.39 12.77 3.77 ageing .14 33/35 .24 .52 10.4/35 3 4.68 10.94 11.60 4.30 both, z free 0 33/35 .19 .41 11.8/35 2.51 5.27 10.79 11.44 4.37 both, z fixed 0 33/35 .31 .44 5/35 2.51 4.52 9.26 9.82 4.21
Table 2 : Optimal long-run responses to demographic changes (β = .48)
Insert Table 3 and figure 1
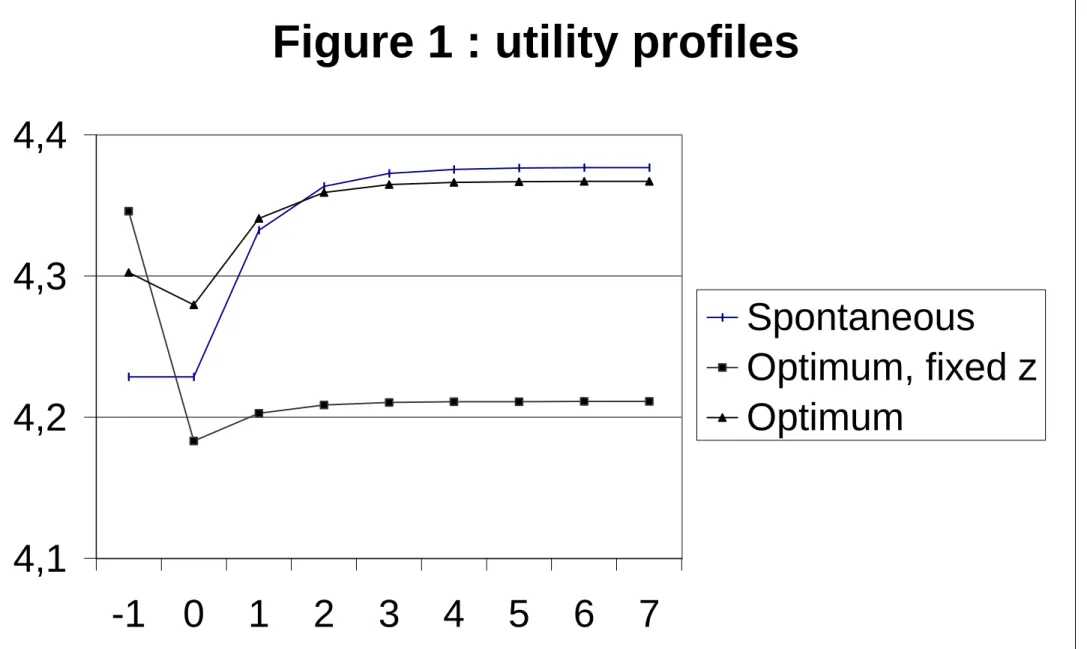
Table 3 and Figure 1 describe dynamic responses to the demographic shock. All the data are deflated by technical progress.
We will now compare four different paths.
The first one is the spontaneous evolution, where the tax rate and the re-tirement age are kept at their pre-shock levels, namely 20% and 60 years old. The unexpected demographic shock has two effects on the current situation. The lower proportion of young agents forces down the pension attributed to the old agents of the initial period (generation −1). Their consumption is d = 8.050, where it would have been 8.598 in the absence of shocks. The drop is even larger in terms of instantaneous flows. The consumption flow d/T is 8.598 instead of 13.083 in the absence of shocks. The second effect of the demographic shock is to make employment lower than expected, as there are fewer young agents. Capital intensity and wages increase while interest rates fall.
On the other hand, the increase in life expectancy induces young agents to save more in order to provide for their retirement days. Young agents’ consumption drops from 5.282 to 4.879. Thus, the impact effect of the demo-graphic shock is to decrease the consumption levels of the two generations. Their utility levels increase, however, as flows are cumulated over a longer life span. For both generations, the utility reaches 4.229 instead of 3.716
before the shock. This common value means very different time profiles for the two generations, however. Moreover, these utility comparisons have to be considered with caution, as the life span appears as a parameter in the utility function.
However, the most important element IS that the drop in the birth rate facilitates capital deepening . This will allow for a monotonous increase in utility over time.
The second path is the optimal path, in which the retirement age is held at 60 years old. Justice leads society to maintain the pensions of old agents from the initial period. This requires the tax rate to jump to 30.5%. The evolution is characterized by a high level of transfers to old agents and by a low level of savings.
The third path is the optimal path where the retirement age adjusts to the demographic shock. It is then possible to maintain the pensions of old agents without increasing the tax rate, which stabilizes at 19%. Retirement age jumps at once to z = 0.332, which represents a retirement age of 66.8 years old.
The fourth path is the equilibrium path associated with an unchanged contribution rate of 20%, where agents are free to choose their retirement age and face an actuarially neutral pension scheme. This path is very close to the optimal path we just described. The only difference is that the contribution rate stays fixed at 20%, whereas its optimal value is 19%. The resulting retirement age is z = 0.329 rather than z = 0. 332. The utility profile is indistinguishable from the optimal one and has not been reproduced in Figure 1.
It can be observed that all utility profiles reach a minimum for generation zero, particularly the profile of agents who are young at the time of the shock. The current old generation’s utility level still reflects the fact that it enjoyed relatively low savings, and therefore, high consumption in its first period of life. Moreover, the social welfare function is additive and does not embody any aversion for inequality. This induces Society to maintain high pensions for this generation. On the other hand, future generations will benefit from capital accumulation. It is thus the current young generation who suffers the most.
By definition, the first three paths are ranked in terms of welfare. Social utility levels are respectively 4.257, 4.272 and 4.3083, while the fourth one yields a utility of 4.3082. As usual, in this kind of analysis, social utility levels appear close. They mean very different paths for individual agents, however.
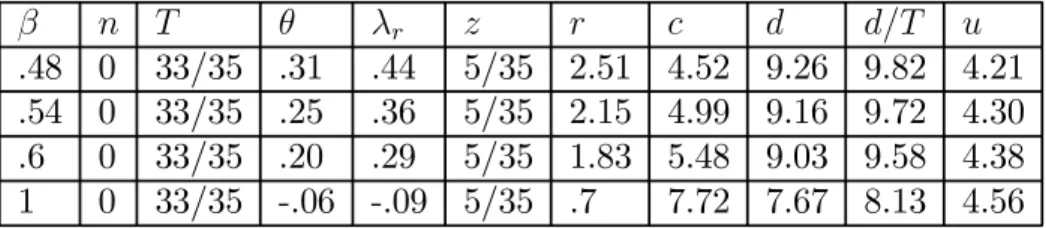
β n T θ λr z r c d d/T u
.48 0 33/35 .31 .44 5/35 2.51 4.52 9.26 9.82 4.21
.54 0 33/35 .25 .36 5/35 2.15 4.99 9.16 9.72 4.30
.6 0 33/35 .20 .29 5/35 1.83 5.48 9.03 9.58 4.38
1 0 33/35 -.06 -.09 5/35 .7 7.72 7.67 8.13 4.56
Table 4: Optimal long-run responses to demographic changes; given retirement age; Influence of the social rate of discount
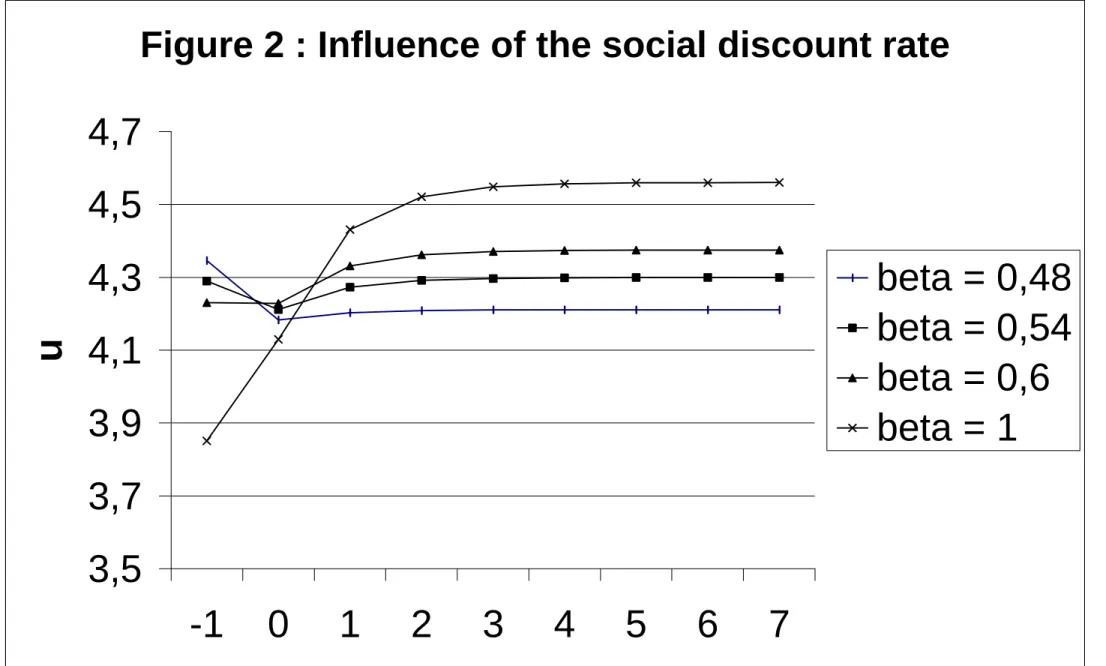
Insert figure 2
This analysis has been conducted for a given social rate of discount, the one that made the initial equilibrium optimal. Society, of course, could have made different choices. The proper method to describe the feasible set is to examine optimal policies associated with different values of the social discount rate.
Table 4 and Figure 2 describe optimal paths for a constant retirement age for various social rates of discount. Augmenting the discount factor β means putting more weight on future generations. At the same time, that means decreasing the pensions of the current generation of old agents and accumulating more capital. Examining integenerational transfers helps to understand the trade-off faced by Society. In our case of undercapitalization, the interest rate is higher than the growth rate. The return on capitaliza-tion is larger than the return on pay-as-you-go social security. The social security system, therefore, rests on a negative intergenerational transfer at the expense of all generations, apart from the current old generation that will receive a positive transfer. The discounted value of all transfers sums up to zero. The basic issue is thus how much to take out of future genera-tions’ earnings in favor of the current old generation. The answer obviously depends on the social rate of discount.
7
Conclusion
As our analysis of debt neutrality has shown, optimal paths can be imple-mented by different schemes. Government debt policy and lump-sum trans-fers make purely funded or pay-as-you-go social security systems equivalent. The only thing that matters is the overall transfer, which affects each gen-eration, be it the result of pensions and social security contributions or that of operating debt and fiscal policy.
From our point of view, a natural way of viewing the optimal scheme is to first look at long-run transfers. They balance by definition at each period and can be interpreted as the optimal pay-as-you-go system associated with a given demographic regime and a given social rate of discount. They define benchmark levels for the tax rate and the replacement ratio. Supplementary transfers, however, are in principle required along the transition path. They could be implemented into the framework of a pure pay-as-you-go system by allowing the tax rate and the replacement rate to vary during each period. It seems more natural, however, to maintain these rates at their long-run levels and to rely on debt policy to implement the transition to the new long-run optimal regime.
With our logarithmic specification of utility, it turns out a bit surprisingly that constant tax rates, as well as retirement ages, are able to sustain the optimal transition. There is no need to use additional transfers and debt policy.
Lastly, we must aknowledge that the main message of this paper is rather transparent: population ageing should naturally lead to deferring the retire-ment age. As we know, however, this message has not been well accpeted by society. It is, therefore, important to identify the arguments behind this refusal. The productivity of old agents, as well as their strong desire to en-joy early retirement should be analyzed using the economic tools. Both the production and utility functions should be more elaborated than the simple ones we have considered here.
generation teta kn r c d d/T z u -2 0,200 1,125 3,000 5,282 8,598 13,083 0,143 3,716 -1 0,200 1,125 3,000 5,282 8,598 13,083 0,143 4,229 0 0,200 1,283 2,689 4,879 8,050 8,538 0,143 4,229 1 0,200 1,675 2,061 5,285 8,720 9,249 0,143 4,332 2 0,200 1,814 1,895 5,413 8,932 9,473 0,143 4,363 3 0,200 1,858 1,846 5,452 8,996 9,542 0,143 4,373 4 0,200 1,872 1,832 5,464 9,016 9,562 0,143 4,376 5 0,200 1,876 1,828 5,468 9,022 9,568 0,143 4,376 6 0,200 1,877 1,826 5,469 9,023 9,570 0,143 4,377 7 0,200 1,877 1,826 5,469 9,024 9,571 0,143 4,377 coll. util. : 4,257
Spontaneous equilibrium, unchanged retirement age and contribution rate
generation teta kn r c d d/T z u -2 0,200 1,125 3,000 5,282 8,598 13,083 0,143 3,716 -1 0,200 1,125 3,000 5,282 8,598 13,083 0,143 4,346 0 0,305 1,283 2,689 4,422 9,060 9,609 0,143 4,183 1 0,305 1,349 2,562 4,489 9,198 9,755 0,143 4,203 2 0,305 1,369 2,525 4,510 9,239 9,799 0,143 4,209 3 0,305 1,375 2,514 4,516 9,252 9,812 0,143 4,210 4 0,305 1,377 2,510 4,518 9,255 9,816 0,143 4,211 5 0,305 1,378 2,509 4,518 9,257 9,818 0,143 4,211 6 0,305 1,378 2,509 4,518 9,257 9,818 0,143 4,211 7 0,305 1,378 2,509 4,518 9,257 9,818 0,143 4,211 coll. util. : 4,272
Optimum, fixed retirement age
generation teta kn r c d d/T z u -2 0,2 1,125 3,000 5,282 8,598 13,083 0,143 3,716 -1 0,2 1,125 3,000 5,282 8,598 13,083 0,143 4,303 0 0,190 1,283 3,108 4,924 10,088 10,700 0,332 4,279 1 0,190 1,502 2,679 5,163 10,577 11,218 0,332 4,341 2 0,190 1,575 2,559 5,236 10,728 11,378 0,332 4,359 3 0,190 1,597 2,524 5,259 10,773 11,426 0,332 4,365 4 0,190 1,604 2,513 5,265 10,787 11,441 0,332 4,366 5 0,190 1,606 2,510 5,267 10,791 11,445 0,332 4,367 6 0,190 1,607 2,509 5,268 10,793 11,447 0,332 4,367 7 0,190 1,607 2,509 5,268 10,793 11,447 0,332 4,367 coll. util. : 4,308
Optimum, free retirement age
generation teta kn r c d d/T z u -2 0,200 1,125 3,000 5,282 8,598 13,083 0,143 3,716 -1 0,200 1,125 3,000 5,282 8,598 13,083 0,143 4,311 0 0,200 1,283 -1,000 4,878 10,148 10,763 0,329 4,274 1 0,200 1,476 -1,000 5,088 10,585 11,226 0,329 4,328 2 0,200 1,540 -1,000 5,152 10,720 11,369 0,329 4,345 3 0,200 1,560 -1,000 5,172 10,760 11,412 0,329 4,350 4 0,200 1,565 -1,000 5,178 10,773 11,425 0,329 4,351 5 0,200 1,567 -1,000 5,180 10,776 11,429 0,329 4,352 6 0,200 1,568 -1,000 5,180 10,777 11,431 0,329 4,352 7 0,200 1,568 -1,000 5,180 10,778 11,431 0,329 4,352 coll. util. : 4,308
Equilibrium, free retirement age and unchanged contribution rate Table 3 Dynamic responses to the demographic shock
Figure 1 : utility profiles
4,1
4,2
4,3
4,4
-1
0
1
2
3
4
5
6
7
Spontaneous
Optimum, fixed z
Optimum
Figure 2 : Influence of the social discount rate
3,5
3,7
3,9
4,1
4,3
4,5
4,7
-1
0
1
2
3
4
5
6
7
u
beta = 0,48
beta = 0,54
beta = 0,6
beta = 1
Appendix
The optimum with a Cobb-Douglas production function
Let us try a solution where consumption is a fixed proportion ξ of production and z is constant:
˜ ct = ξ µ 1 + z 1 + n ¶ f (kt) (42) implies: ˜ ct+1 ˜ ct = f (kt+1) f (kt) = βf 0(k t+1) (1 + n)(1 + γ) or, with Cobb-Douglas:
(1 + n) (1 + γ) kt+1 = αβf (kt) (50)
Equations (40) and (42) imply: ˜ dt+1 ˜ ct+1 = mβi βT (1 + n) (51)
Equations(35), (50) and (51) yield: (1 + n) (1 + γ) kt+1 = µ 1− ξ µ 1 + mβi βT ¶¶ f (kt)
Comparing with (50) , this implies:
ξ = 1− αβ 1 + mβiT /β (41) and (51) imply: ˜ wt(T − z) = 1− m m ˜ dt= (1− m) βi βT (1 + n)˜ct or αf (kt) (T − z) = (1 − m) βi βT (1 + n)ξ µ 1 + z 1 + n ¶ f (kt) which yields: 1 + z 1 + n = 1− α 1− α + (1 − m)ξβiT /β
From (44) , the implicit contribution rate is such that: (1− θt) ˜wt = ˜ct+ (1 + γ) (1 + n) (1 + z/(1 + n)) kt+1= = (λ + αβ) (1 + z/(1 + n)) f (kt) or 1− θt= λ + αβ 1− α µ 1 + z 1 + n ¶ References
Artus P. et F. Legros (1999) Le choix du système de retraite, Economica. Belan P. and P. Pestieau (1999) Privatizing Social Security : a Critical Assesment, The Geneva Papers on Risk and Insurance, 24, 1, 114-130.
Blanchard O. J. (1985) Debt, Deficits and Finite Horizons, Journal of Political Economy, 93, 223-247.
Blanchet D. and L. P. Pelé (1999) Social Security and Retirement in France , in Gruber-Wise (1999)
Blanchet D. and L. Caussat (2000), Le libre choix de l’âge de la retraite, approche économique, in Retraites choisies et progressives, D. Taddei ed., Rapport du Conseil d’Analyse Economique, La Documentation française, Paris.
Blondel S. et S. Scarpetta (1997) La retraite anticipée dans les pays de l’OCDE. Le rôle des systèmes de sécurité sociale, Revue Economique de l’OCDE, 29, 7-59.
Bohn H. (2002) Retirement Savings in an Aging Society : A Case for Innovative Government Debt Management, mimeo, University of California at Santa Barbara.
Charpin J.-M. (1999) L’avenir de nos retraites, Rapport au Premier min-istre, La Documentation Française.
Cremer H., J-M Lozachmeur and P. Pestieau (2002) Social Security, Re-tirement Age and Optimal Income Taxation, mimeo, GREMAQ.
de la Croix D. and P. Michel (2002) A Theory of Economic Growth. Dy-namics and Policy in Overlapping Generations, Cambridge university Press.
Diamond P.A. (1965) National Debt in a Neoclassical Model , American Economic Review, 55, 1126-1150.
Gertler M. (1999) Government Debt and Social Security in a Life-Cycle Economy, Carnegie Rochester Conference Series on Public Policy, 50, -1-110. Gruber G and D. Wise (1999) Social Security and retirement around the World, Chicago University Press.
Hairault J-O et F. Langot (2002) Inégalités et réforme des retraites, Revue Française d’Economie, 1, 97-159.
Long J. and C. Plosser (1983) Real Business Cycles, Journal of Political Economy, 91, 1,39-69.
Michel P. et P. Pestieau (2000) Retraite par répartition et âge de la re-traite, Revue Economique, 15-30
Samuelson P. A. (1958) An Exact Consumption Loan Model with or with-out the Social Contrivance of Money, Journal of Political Economy, 66, 467-482.