HAL Id: halshs-02522824
https://halshs.archives-ouvertes.fr/halshs-02522824
Submitted on 27 Mar 2020
HAL is a multi-disciplinary open access
archive for the deposit and dissemination of
sci-entific research documents, whether they are
pub-lished or not. The documents may come from
teaching and research institutions in France or
abroad, or from public or private research centers.
L’archive ouverte pluridisciplinaire HAL, est
destinée au dépôt et à la diffusion de documents
scientifiques de niveau recherche, publiés ou non,
émanant des établissements d’enseignement et de
recherche français ou étrangers, des laboratoires
publics ou privés.
Public finances during the five-year term 2012-2017 in
France
Antoine Bozio, Sophie Cottet, Marion Monnet
To cite this version:
Antoine Bozio, Sophie Cottet, Marion Monnet. Public finances during the five-year term 2012-2017
in France. 2017. �halshs-02522824�
PUBLIC FINANCES DURING
THE FIVE-YEAR TERM
2012-2017 IN FRANCE
IPP Policy Brief
n°27
April 2017
Antoine Bozio
Sophie Cottet
Marion Monnet
www.ipp.eu
Summary
Controlling the government deficit was a clearly stated priority of
candidate François Hollande during the 2012 presidential campaign
in France. He planned to bring the government deficit below the 3%
ceiling beginning in 2013, and to achieve a balanced budget in 2017.
The actual deficit proved to be above these forecasts, in part
because the deficit reduction strategy depended on assumptions for
growth that did not materialise. While the turnaround in public
finances was slower than anticipated, the various measures adopted
during 2012-2017 nevertheless significantly contributed to reducing
the deficit, and are essentially concentrated over the first two years
of the five-year term with significant tax increases. Reducing the
deficit was not however the only purpose of the tax measures. Tax
reductions were also adopted to favour employment and
competitiveness, and the environment. In contrast, measures
relating to public expenditure are much more difficult to chart and
the amounts involved much smaller. Lastly, the reduction in public
expenditure can be attributed in large part to a lower debt burden.
• The deficit reduction strategy during Hollande’s five-year term was largely based on unfulfilled growth forecasts, which accounts for half the difference between the announced objective and the actual deficit.
• The reduction in government deficit observed between 2012 and 2017 derives primarily from the taxes imposed at the start of the term. However, 36% of this rise in tax revenue can be imputed to measures taken during the five-year term of Nicolas Sarkozy.
• The reduction in public expenditure can in large part be attributed to a lowering of the debt burden during 2012-2017.
• The various budget documents, which depend on a governance of public expenditure shared by the government and various Social Security administrations, cannot be used to perform a detailed analysis of the change in the various components of public expenditure. This lack of clarity argues for an overhaul in the governance of public finances.
The Institut des Politiques Publiques (IPP) has been developed through a scientific partnership between the Paris School of Economics and the Centre for Research in Economics and Statistics. IPP’s aim is to promote quantitative analysis and evaluation of public policy
using cutting-edge research methods in economics.
IPP Policy Brief 27
PUBLIC FINANCES DURING THE FIVE-YEAR TERM 2012-2017 IN FRANCE
2 There is disagreement about the results of the 2012-2017 term for public finances: for some, the measures taken to reduce the government deficit were insufficient, while others find they were excessive. Besides the fact the criticised austerity was announced in Hollande’s platform, which clearly indicated the goal of deficit reduction through an increase in tax revenues, the results must be assessed with regard to the measures actually taken and the role of growth forecasts.
After reviewing the major changes in public finances throughout the term, this brief examines more specifically the importance and extent of measures concerning contributions and expenses to explain the observed results.
Overall results for public finances
One of candidate Hollande’s key proposals during the 2012 presidential campaign was to balance the budget in 2017 after bringing the deficit below the 3% ceiling set by the Maastricht
Treaty (commitment 9). This consolidation of public finances
was to be achieved both by increasing taxes, particularly on the most well-off households (commitments 15 and 17), and by stabilising the volume of expenditure.
Figure 1: Comparison of the budget balance stated in Hollande’s commitments as a presidential candidate with actual and projected balances
Interpretation: In 2013, the actual deficit represented 4.0% of GDP, 1.1 points of GDP more than announced in the 60 commitments for France made by Hollande as candidate.
Note: *Forecasts.
Sources: Hollande, Le Changement c’est maintenant.Mes 60 engagements pour la
France (2012); Insee, National Accounts in base 2010; 2017 Draft Budget Law;
Rapport économique, social et financier (2017).
Figure 1 compares these campaign promises with the actual and projected change in the deficit during the five-year term (2012-2017). While the deficit was to drop below 3% beginning in 2013, the calculations in the last draft budget law forecast it only for 2017, with a deficit of 2.7%.
As can be seen in Figure 2, this smaller reduction in the deficit
results both from a smaller than anticipated drop in public spending as a proportion of GDP, and a more moderate increase in the rate of tax revenues compared with the forecasts in the candidate’s platform.
Public expenditure represented 56.8% of GDP at the start of the five-year term and reached a high of 57.3% of GDP in 2014. Beginning in 2014, public spending as a share of GDP decreased, but the gap with Hollande’s figures announced during his campaign increased until 2017. Thus, while he was committed to a rate of public spending of 53.8% of GDP for the end of his term, the forecasts for 2017 indicated a rate of 55.9%. The rate of tax revenues increased by 0.7 points of GDP between the start and the end of the five-year term, from 43.8% in 2012 to 44.5% in 2017. In contrast, the difference between the percentage of actual tax revenues and those announced during the presidential campaign (45.4% of GDP in 2017) is more modest.
Figure 2: Actual expenses and revenue compared with Hollande’s campaign commitments
Interpretation: In 2017, the budget documents forecast a tax revenue rate of 44.5% while candidate Hollande had committed to reach a rate of 45.4%. Notes: Hollande’s commitments were made when the French System of National Accounts was operating on a 2005 base; the numbers given here were converted to a 2010 base using information provided by Insee when the base was changed.
Sources: Hollande, Ibid. 2012; Insee, National Accounts in base 2010; Rapport
économique, social et financier (2017).
Actual and projected budget deficit Deficit announced by candidate Hollande
Actual and projected public expenditure Public expenditure announced by candidate Hollande Actual and projected tax revenues
Tax revenues announced by candidate Hollande
Pu bl ic e xp en di tu re s an d ta x re ve nu e as a p erc en ta ge o f G D P
IPP Policy Brief 27
PUBLIC FINANCES DURING THE FIVE-YEAR TERM 2012-2017 IN FRANCE
It thus remains to be determined whether this inability to keep the campaign commitments is the result of faulty implementation of the announced measures, a deficit reduction strategy that depended on the return of growth, or a deliberate choice, on the assumption that the government would have deemed it undesirable to achieve a balanced budget in 2017.
In order to try to provide some information to answer this question, the assumptions for growth in Hollande’s platform will be used to calculate what would have been the proportion of public expenditure and tax revenues had the candidate’s
assumptions for growth become reality (Table 1).
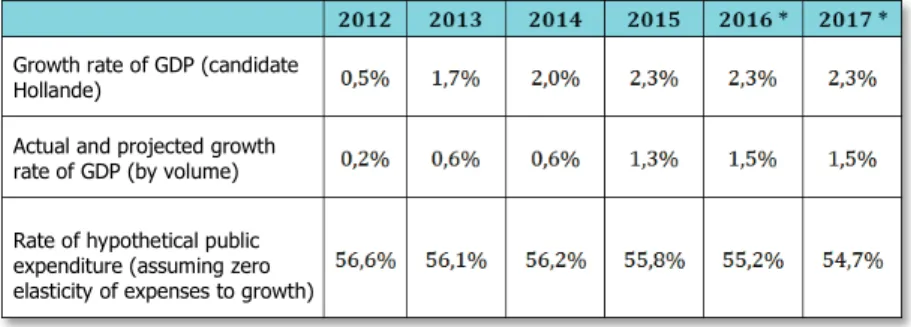
Table 1: Rate of growth announced by Hollande, actual rate of growth and rate of hypothetical public expenditure
Interpretation: The growth assumption adopted by Hollande for 2012 was 0.5%, while actual growth was 0.2%. Assuming a zero elasticity of public expenditure to growth, the rate of public expenditure would have been 56.6% if the growth assumptions had been fulfilled. Note: *Forecasts.
Sources: Hollande, Ibid. 2012; Insee, National Accounts in base 2010;
Rapport économique, social et financier (2017).
Hollande anticipated a sustained recovery for growth beginning in 2013 with an increase in GDP of 1.7%, followed by a stabilisation in the growth rate of around 2% or 2.5%, a difference of nearly one percentage point with the observed growth rates. These growth rates are used to recalculate the proportion of public expenditure which would have been observed each year if these assumptions had proved true, and the calculations are performed assuming zero elasticity of public expenditure to growth, a plausible assumption for the short term (1). For example, for 2017, public expenditure represented 55.9% of the GDP and the forecast increase in GDP for the year was 2.3%. Assuming zero elasticity in public expenditure, the latter would have represented 54.7% of GDP (2), or a difference of 1.2 points of GDP when compared with the forecast rate. Thus, a little more than half the differences observed for public expenditure between what was done and what had been announced is due to weaker than anticipated GDP growth.
Unlike public expenditure, the trend in tax revenues depends only on the margin of retained growth assumptions to the extent that the elasticity of the tax revenues to growth is generally around one (3).
1. This assumption appears reasonable: in the very short term, the elasticity of public expenditure to growth would be slightly negative, a share of public expenditure (such as services on condition funding is available) playing the role of automatic stabilisers, while over the longer term public expenditure tends to increase with growth:
http://www.vie-publique.fr/decouverte-institutions/finances-publiques/approfondissements/politique-budgetaire.html
Expressed otherwise, the rate of tax revenues does not change mechanically with the growth of GDP given that the amounts levied and the wealth created evolve in the same proportions. This implies that the differences between the actual and announced tax revenue rates (0.9% of GDP in 2017) can be attributed either to a political will not to increase tax revenues (or reduce tax expenditures) as much as had been announced, or to faulty implementation of certain measures.
Following this exercise, it can be concluded that the goal set by Hollande during his campaign to reach a zero deficit in 2017 was not realised both because he used growth assumptions that had not been verified, and because of insufficient measures or a deliberate decision to maintain a certain deficit level (4).
The observation that deficit reduction depends on growth is not
specific to Hollande’s term, as shown in Box 1. For 1999-2017,
the actual deficits were almost always greater than the deficits forecast in the previous year’s budget documents, primarily due to highly optimistic growth forecasts.
2. The calculation is as follows: 55.9/(100+2.3) = 54.7%. 3. Rapport économique, social et financier (2017), Table 11, p. 76.
4. In effect, of the additional 2.7 points of GDP of deficit compared with what had been announced for 2017, 1.2 points result from a growth that was weaker than expected, which represents nearly half the difference.
Box 1: Have deficit forecasts improved?
Each year, budget bills include government deficit forecasts with one-, two- and three-year horizons. They rely on macroeconomic forecasts, particularly GDP growth forecasts, by the Public Treasury under the supervision of the minister of finances. These growth forecasts have often been criticised as intentionally “inflated” to present a balanced budget. As shown in Figure 3, during the period prior to the 2008 recession, three-year deficit forecasts were systematically more optimistic than the actual results.
This observation led to the creation of the High Council for Public Finances (HCFP) in 2012. Independent of the government and the parliament, it is responsible for judging the credibility of the government’s macroeconomic forecasts. The institution was expected to contribute to making the growth forecasts underlying deficit forecasts more realistic and ultimately to improve the quality of deficit forecasts. As can be observed in the figure for the period after 2012, the actual deficit was almost always higher than the forecast deficit, with the exception of 2014. By calculating the average error in projections before and after 2012 (and excluding the recession), there is no improvement in the deficit forecasts since the creation of the HCFP: deficit projections in France have systematically remained upwardly biased.
9%
Figure 3: Comparison
8%
of forecast and actual budget deficits 6% 5% 4% 3% 2% 1% 0% 1999 2001 2003 2005 2007 2009 2011 2013 2015 2017 2019 -1%
Interpretation: In 2013 the actual deficit was 4% while the 2012 budget documents projected a deficit of 3%.
Note: This figure shows the change in the deficit (blue line) as well as the change in the deficit forecast each year in budget documents (dotted grey lines). Sources: Insee, National Accounts in base 2010; Programmes de Stabilité (1999-2003); Rapport économique, social et financier (2003-2017).
Bu dg et d ef ic it a s a pr opo rt io n o f G DP
Growth rate of GDP (candidate Hollande)
Actual and projected growth rate of GDP (by volume) Rate of hypothetical public expenditure (assuming zero elasticity of expenses to growth)
IPP Policy Brief 27
PUBLIC FINANCES DURING THE FIVE-YEAR TERM 2012-2017 IN FRANCE
4
The role of tax revenues and public expenditure in
reducing the deficit
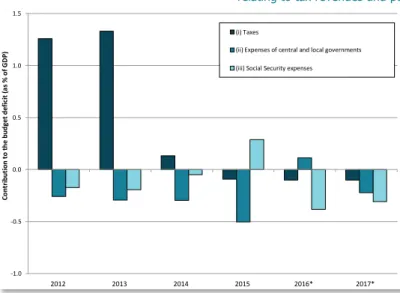
While the balanced budget promised by Hollande was not achieved, the government deficit was nevertheless reduced over the course of the five-year term, dropping from 4.8% to 2.7% of GDP. If the measures taken during 2012-2017 had not been implemented, the deficit would have naturally increased by 4.5% of GDP compared with this hypothetical scenario. There are two strong moments in the reduction of the government deficit: an initial phase where the rise in tax revenues predominates, followed by a decrease in public
expenditure. As shown in Figure 4, most of the deficit reduction
comes from the tax increases voted early in the term. Thus, in 2012 and 2013, the new measures pertaining to tax revenues
respectively provide an additional 1.26% and 1.33% of GDP compared with a hypothetical situation where no measure is implemented.
France’s profile in terms of reducing government deficit rather goes against what is proposed by institutions such as the International Monetary Fund and the European Union (especially Germany), which recommend stabilising public finances primarily by reducing public expenses rather than by increasing tax revenues. This observation is especially true for the first two years of the five-year term, during which the increase in tax revenues makes up 75% of deficit reduction. This share drops to 50% for the entire five-year term, with the remaining 50% split between measures to reduce the expenditure by Social Security and central and local governments.
Figure 4: Annual contributions to reducing the budget deficit of new measures relating to tax revenues and public expenditure
Interpretation: The new measures taken in 2013 and affecting tax revenues resulted in an annual increase in revenues equivalent to 1.3 GDP points. The measures taken in 2015 concerning the expenses of national and local public bodies led to decreasing this spending by 0.5 points of annual GDP.
Note: *Forecasts.
Sources: Insee, National Accounts in base 2010; Rapport
économique, social et financier (2012-2017); Reports on tax revenues
(up to 2013); Report 2012-M-008-03 of the Inspection Générale des Finances.
It must however be noted that this deficit reduction cannot be attributed only to the measures taken during the 2012-2017 term. In effect, these numbers also include the impact of certain measures approved during the term of Nicolas Sarkozy and whose effects lasted beyond 2012. Analysing the detailed
tables of successive editions of the Rapport économique, social
et financier (RESF) on tax revenue measures, the effect on public finances of the measures taken during the five-year terms of Hollande and Sarkozy can be distinguished for 2012-2017. The result is that for the entire period, the tax measures brought in an average of €50 billion per year, of which €18 billion can be attributed to policies implemented during Sarkozy’s term and €31.2 billion during Hollande’s term (5).
Main tax measures of Hollande’s five-year term
Looking at the detail of the various tax measures adopted during Hollande’s five-year term, all did not have the single goal of reducing the deficit: several measures to reduce taxes were also taken to favour employment, low-income households and the environment.
Table 2 lists the main tax reforms that were approved between 2012 and 2017, by decreasing amount. The most important measures are the tax credit for competitiveness and employment (CICE), approved in 2012 for an annual cost of €15.1 billion, and reductions in employer contributions approved in the 2015 Social Security Finance Act for an annual cost of €7.2 billion. Next come measures related to the ecological tax scheme (€11.7 billion) and the implementation of an energy transition tax credit in 2015 (€ -2 billion). At the start of his term, Hollande’s government also adopted a set of measures to revise the provisions of the TEPA Law to promote labour, employment and purchasing power, implemented between 2008 and 2012: abolition of the income tax exemption for overtime hours, restoration of the inheritance tax, limiting of social contribution exemptions with an increase in the additional
employer’s contribution (forfait social).
5. The balance (€1.2 billion) can be imputed to measures for transfers between local government and other government bodies
1.5
(i) Taxes
(ii) Expenses of central and local governments
1.0 (iii) Social Security expenses
0.5 0.0 -0.5 -1.0 2012 2013 2014 2015 2016* 2017* Co nt ribut io n t o th e bud ge t d ef ic it (a s % o f G D P)
IPP Policy Brief 27
PUBLIC FINANCES DURING THE FIVE-YEAR TERM 2012-2017 IN FRANCE
Table 2: The 15 main tax reforms approved during 2012-2017 (in billions of euros)
Measures relating to expenditure: more difficult to
monitor
While the budget documents make it possible to very accurately track measures relating to taxes approved in budget bills, it is much more difficult to do the same for measures impacting
public expenditure. Table 3 indicates the main measures for
public expenditure and savings approved during the 2012-2017 period. Overall, they are less numerous than the tax measures and the amounts involved are much smaller. The savings measures primarily concern reforms of family benefits, including adjusting family allowances according to income, and the reform of housing benefits, resulting in savings of approximately €2.5 billion per year. Lastly, the net cost of the
benefit reforms (readjustment of the low-income benefit (RSA)
and inauguration of the employment bonus (prime d’activité)) is
very slightly positive.
Generally speaking, and unlike the measures impacting tax revenues, it is very difficult to provide an exhaustive picture of public expenditure measures taken during the different five-year terms, and thus to have an overall vision. The expenses fall under different public entities and the reforms are indicated either in the draft budget law (PLF), for expenses by national entities, in the draft Social Security budget law (PLFSS), for expenses by Social Security administrations which are covered by it, or, for those who are not, in neither of these laws. The lack of a trend chart for measures involving expenses and the variety of modes and organisations in France that make decisions on expenses raises a problem of governance, which is no doubt not unrelated to the fact that controlling public expenditure plays only a minor role in reducing France’s government deficit.
Table 3: Main public expense measures taken during 2012-2017 (billions of euros)
Interpretation: the tax credit for competitiveness and employment (CICE) was approved as part of the 2012 Revised Budget Law (LFR) for an annual cost of €15,1 billion during 2012-2017
Source: Rapport économique social et financier (2012-2017)
Interpretation: The adjustment of family allowances according to income, approved in the 2015 Social Security Finance Act, Resulted in an annual savings of €1.3 billion over the period.
Note: PLF budget bill; LFR: Revised budget; LFSS: Social Security Budget Bill. Sources: see table
6
IPP Policy Brief 27
PUBLIC FINANCES DURING THE FIVE-YEAR TERM 2012-2017 IN FRANCE
Analysis of the budgets assigned to the government’s various missions and of the expenses in other public services (Social Security, local government and various central government bodies), which in theory should provide a measure of the contribution of the various expense items to the overall decrease in public expenditure as a share of GDP between 2012
and 2017, illustrates this problem of governance. Figure 5
shows that by taking into account any changes in scope, most of the reduction in government expenditure (-1% of GDP between 2012 and 2017) comes from the debt burden, by a mechanical effect of the reduction of the interest rates; no budgetary mission in the national budget showed a clear-cut decrease in expenditure. The stabilisation of the expenses of the general Social Security scheme was provided by the reduction in “Family” expenditures. It is nevertheless difficult to really break down the reduction in all public expenditure (-0.93% of GDP over the five-year term) using the data provided by the budget documents.
In fact, it is not possible to reconstruct all of government expenditure, in the sense employed by the French System of National Accounts, in the draft budget law documents. It is also not possible to break down the Social Security expenditures: while expenditures for the general scheme are included in the draft Social Security budget law, for unemployment insurance in the Unédic accounts and for mandatory supplemental schemes in the draft budget law documents, expenditure for hospitals and other social entities is lacking.
This lack of clarity is not only harmful for public debate, it also contributes to making consistent and enlightened management of public finances a difficult task. This observation has already been addressed by several experts who are calling for an overhaul of the governance of public finances (6).
6. Bozio, A. and Dormont, B. (2016), “Gouverner la protection sociale: transparence and efficacité”, Les Notes du CAE, 28.
Figure 5: Variation in main public expenditure between 2012 and 2017, expressed in GDP points
Interpretation: Government expenditure as a share of GDP, at constant scope (2012), between 2012 and 2017, has dropped by one percentage point.
Note: Government expenditure is restricted to the general budget, defined as the total of all budget missions (except for “Relationship with Local Authorities”) to which are added the debt burden and the contribution to the “Pensions” special account, and from which are deduced the affected capped taxes. Expenditure is given on a current scope basis, unless stated otherwise and excluding the detail of government budget missions and the expenses of the general Social Security scheme, for which the expenditures in 2017 are taken at constant scope (2012). In particular, variations in Social Security expenditure at constant scope do not include the introduction of the universal healthcare system (PUMa, LFSS 2016), which constitutes a major change in scope, as well as the transfer of part of the housing benefits to the State.
Sources: For national expenditure: LFR 2012; PLF 2013 (LFI 2012); PLF 2017. For the general Social Security scheme: PLFSS 2012 and 2017. For Unédic expenditure: Rapport
économique, social et financier (2017) and Unédic. For mandatory supplementary scheme expenditures: LFSS 2012 and Rapport économique, social et financier (2017). For the
expenditure of Social Security administrations, other government bodies and local governments: National accounts, Insee and Rapport économique, social et financier (2017).
Results and forecasts
The return to a balanced budget announced in 2012 by Hollande as a candidate was based on more dynamic growth than what was observed during his five-year term, and on political choices that were acted on, especially early in his term of office.
Faced with weak growth, the government chose not to follow a more ambitious policy of deficit reduction to achieve the initially stated objective at any price.
The extent of the efforts made to reduce public expenditure is however difficult to measure. While it is possible, using available budget documents, to identify variations in the expenditure of certain entities, the scattering of data across different budget and non-budget documents, as well as the changes that have occurred within the scope of public entities and their components, make it impossible to provide an accurate panorama of decreases and increases in public expenditure. The scattered availability of information is symptomatic of the government’s and the legislature’s difficulty in monitoring all of public expenditure.
-0.93 -0.21 -1.00 -0.51 0.08 0.01 -0.03 -0.03 -0.08 -0.01 0.10 -0.08 0.01 -0.06 -0.40 0.02 -0.45 0.79 -0.02 0.19 0.17 -0.33 -0.04 0.02 -0.21 -0.58
Total public expenditure State (RESF)
State (RESF, constant scope) Debt burden “Pensions” special account Academic instruction Defence
Research and higher education Solidarity, job placement and equal opportunity Security
Labour and employment
Management of public finances and human resources Ecology, sustainable development and transport Equal opportunities between regions and housing Other missions
Other central government bodies
Social Security administrations (ASSO, National Accounts) General social security scheme (RESF)
General social security scheme (RESF, constant scope) Illness
Old age Family
Workplace accidents-Occupational illness Unédic
Mandatory supplemental schemes Local government