HAL Id: hal-01092996
https://hal.archives-ouvertes.fr/hal-01092996
Submitted on 9 Dec 2014
HAL is a multi-disciplinary open access
archive for the deposit and dissemination of sci-entific research documents, whether they are pub-lished or not. The documents may come from
L’archive ouverte pluridisciplinaire HAL, est destinée au dépôt et à la diffusion de documents scientifiques de niveau recherche, publiés ou non, émanant des établissements d’enseignement et de
Walking analysis of young and elderly people by using
an intelligent walker ANG
Ting Wang, Jean-Pierre Merlet, Guillaume Sacco, Philippe Robert,
Jean-Michel Turpin, Bernard Teboul, Audrey Marteu, Olivier Guerin
To cite this version:
Ting Wang, Jean-Pierre Merlet, Guillaume Sacco, Philippe Robert, Jean-Michel Turpin, et al.. Walk-ing analysis of young and elderly people by usWalk-ing an intelligent walker ANG. Robotics and Autonomous Systems, Elsevier, 2014, pp.36. �10.1016/j.robot.2014.09.019�. �hal-01092996�
Walking analysis of young and elderly people
by using an intelligent walker ANG
Ting Wanga,∗, Jean-Pierre Merleta, Guillaume Saccob,c,d,e, Philippe Robertb,d,e, Jean-Michel Turpinb,c, Bernard Teboulb,c, Audrey Marteub,c,
Olivier Guerinb,c,d
a
Hephaistos team, Inria Sophia Antipolis, France
b
Centre d’Innovation et d’Usages en Sant´e, CHU de Nice, France
c
Pˆole de G´erontologie, CHU de Nice, France
d
EA 7278 CoBTeK Cognition Behaviour Technology, Universit´e de Nice Sophia-Antipolis, Pˆole de G´erontologie, CHU de Nice, France
e
Centre M´emoire de Ressource et de Recherche, Centre Edmond et Lily Safra, Institut Claude Pompidou, Nice, France
Abstract
This paper proposes a new method to analyze human walking by using a 3-wheels rollator walker instrumented with encoders and a 3D accelerome-ter/gyrometer. In order to develop walking quality index and monitor the health state of elderly people at home, the walking of 23 young adults and 25 elderly people (> 69 years) with the help of the walker, are compared. The results show that many general walking indicators such as walking speed, stride length do not present obvious difference between the two groups, but that new indicators obtained by using the walker measurements and not
∗Corresponding author
Email addresses: ting.wang@inria.fr(Ting Wang),
Jean-Pierre.Merlet@inria.fr(Jean-Pierre Merlet), sacco.g@chu-nice.fr (Guillaume Sacco), robert.ph@chu-nice.fr (Philippe Robert),
turpin.jm@chu-nice.fr(Jean-Michel Turpin), bernard.teboul@libertysurf.fr (Bernard Teboul), marteu.a@chu-nice.fr (Audrey Marteu), guerin.o@chu-nice.fr (Olivier Guerin )
available otherwise are very discriminating, e.g., the lateral motion of elderly people is larger, their walking accuracy is lower, but their effort distributed on the handles are more symmetrical. We also show that this walker may have other purposes such as updating collaborative maps with sideway slopes and location of lowered kerbs.
Keywords: Intelligent walker; Walking analysis; Walking quality index; Elderly
1. Introduction
The elderly population is growing fast all over the world. Population ageing will cause significant challenges of care giving. One of the problems that affect the most of the elderly population is the reduction of mobility. Therefore, personal assistance mobility devices are strongly desired to keep the elderly independent. Among the possible assistance devices, the walkers have large number of users because of its simplicity while using the person’s remaining locomotion capability in order to move. Besides of the physical benefits of maintaining the standing position, there are also other important psychological benefits, such as maintaining self-esteem and social relation-ship.
There are many studies and projects regarding advanced versions of walk-ers. According to the user’s needs, the functions of the proposed walkers are not restricted to their primary task, i.e. physical support and mobility as-sistance. There are other functions such as sensorial assistance, cognitive assistance and health monitoring [1]. These walkers focus on mobility assis-tance [2], [3], [4], sit-to-stand transfer [5], [6], navigation help [7], [8], obstacle
avoidance and fall detection [9]. Besides of these, there are other multifunc-tional walkers such as PAMM SmartWalker [10], which was designed to of-fer extra support for walking, guidance, scheduling (reminding the time of medicines, for an example) and health monitoring for elderly users. The Medical Automation Research Center (MARC) smart walker [11], which was installed a pair of tridimensional force/torque sensors on it’s handles, can be used to determine gait characteristics such as the heel strike, toe-off, double support, and single support [12], [13].
To study the extension of the functions of walkers we have developed our own family of walking aids, the ANG family [14], i.e., ANG-light and ANG-2. It has been tested that the walker ANG-2 can perform multifunctions such as navigation, street mapping, fall detection/prevention and autonomous object recovery [14]. Our walker is also a communication device that can receive and emit information (e.g., fall detection for emission, change of user pro-file for reception). In addition, the walker is able to download and execute new services according to the end-user’s trajectory of life (e.g., specific re-habilitation program). It is therefore much more flexible in its application than other walkers. In this work we use the simplest version, ANG-light (Fig. 1) which is based on a commercially available 3-wheels Rollator. It has been instrumented with encoders at the two fixed rear wheels and a 3D accelerometer/gyrometer at the front with the purpose of determining the walker’s trajectory on a 24/24 basis. A small, low energy consumption fit-pc computer manages the measurements and records all the data. Additionally the walker has GPS, GSM and infrared network connection that are not used in this paper. Compared with the walkers proposed above, our walker is low
cost, simple to be used at home and its functions can be easily extended. This paper will present how it can be used for medical monitoring of walking patterns and what kind of medical information may be obtained.
Figure 1: The walking aid ANG-light
Many studies have examined the effect of age on the walking by compar-ing younger with older adults [15], [16], [17], [18], [19], [20], [21], [22]. These studies calculated some gait parameters, such as step length, gait cycle, step width, cadence and gait speed [22], [23], [24], [25]. Usually gait speed or walking velocity is regarded as a very important indicator of health. Some studies claimed that older subjects exhibited significantly reduced gait speed compared to younger adults [15], [16], [22]. Other studies showed that there were little or no differences in the gait speed between the healthy younger and elderly people [20], [19]. In fact, [25] has showed that the measured gait
speed is based on age, sex [23], use of mobility aids, chronic conditions, smok-ing history, blood pressure, body mass index, and hospitalization. Therefore, the classical gait parameters are not sufficient to monitor the user’s health. Some studies have considered also gait variability [18], [26], [19], [27]. The variability of gait parameters can be characterized by the coefficient of vari-ation (CV) of kinematic gait parameters [28], [15], which is an index of gait stability and complexity. The increased variability of gait parameters corre-sponds to decreased gait stability, complexity and increased risk of falling. However, gait instability is multifactorial and the results of previous studies are often inconsistent according to the conditions of experiment. Therefore, we need to do more tests and find more pertinent indicators of walking. As proposed in [29], at least the following components of a person’s gait should be considered: initiation of gait, step length, height, and symmetry, step continuity, step path, trunk motion, walking stance, turning, and heel-to-toe walking. Presently, although some studies began to analyze other gait char-acteristics such as medial-lateral displacement, center of mass [30] and foot placement [21], [31], they are still not sufficient to describe comprehensively walking motion.
This paper proposes a new method of walking analysis by using our in-strumented smart walker. A 10 meters straight line walking test has been performed by two groups of younger and elderly people. Thanks to encoders and a 3D accelerometer/gyrometer, we can calculate accurately the classi-cal gait parameters such as gait cadence, walking speed and stride cycle, stride length and their variability without the subjectivity of an human ex-amination. We also can obtain the trajectory of the walker and therefore
compare it with the reference trajectory. This comparison will allow to es-tablish several original gait parameters which have not been considered in previous studies and the walking accuracy of two groups of people can be
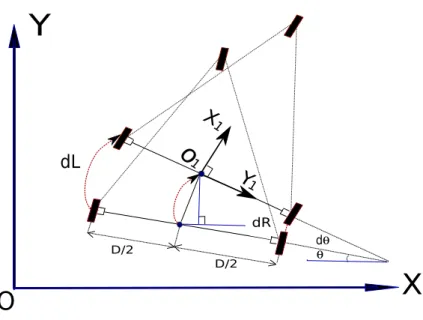
compared. We define a mobile frame attached to the walker with X1 being
the forward direction and Y1 being the lateral direction (see Fig. 3). Because of the elasticity of the wheels, when leaning forward to push the walker there
will be a clock-wise rotation around the Y1 axis and when leaning on the
right (left) handle a rotation around the X1 axis should be observed.
There-fore, by using the measured angular velocity of the walker, the proportion of forward/backward support force and left/right support force on the han-dles during the whole walking can be estimated. Overall, using our walker the gait characteristics can be described more comprehensively. Secondly, a drawback of most studies is that these measures are obtained on a reduced space with specialized laboratory equipment such as motion capture systems and instrumented walkways, which may not be available in many clinics and certainly not during daily activities. In contrast, our walker can be easily used at home and outdoors, so it is possible to develop it for individual medi-cal monitoring of walking patterns at any time of the day and in any context. Moreover, motion capture systems don’t have large workspace and are not very accurate. Conversely, we have measured the error on the final pose of the walker after a 10 meters walk: the positioning error was less than 1 cm and 0.1 degree in orientation, which is much better than a motion capture system on such large workspace. Besides of this, a very small abnormal limb motion during one step, which characterizes an emerging pathology, cannot be detected by motion capture but can be detected on the walking trajectory.
2. Description of experiments
Physical functioning tests have showed significant aged-related differences for older adults [32]. Several classical tests used to assess the mobility of elderly people are the 10m walk test (10mWT) (measure: time duration) [33], Timed Up and Go test (TUG) (measure: time duration) [34], Tinetti Test (TT) (analysis of gait parameters through a video) [35]. Such tests are easy to implement but are basically global (the time for the 10mWT and the TUG may be identical for two subjects which have however very different walking patterns) or are subjective (for the TT [36]). Furthermore these tests are performed only during medical visits and consequently are not appropriate to detect abnormal events in the walking patterns. Hence we have decided to examine if the measurements of our walking aid allow one to refine the output of the above walking tests.
For that purpose we have led a large scale experiment that was approved by the regional ethical committee (Comit´e de Protection des Personnes). In this paper only the results of a 10mWT will be presented. Each subject was asked to walk along a 10m straight line trajectory with the help of the walker. The experiment takes place at INRIA and at Nice hospital. The subjects were 23 INRIA members (with age between 25 and 65 years, mean value 32) and 25 elderly people (age over 65 years) recruited by Nice hospital (see Fig. 2). No subject has pathological walking deceases. All the subjects were asked to perform twice the trajectory with the walking aid.
Figure 2: The walking aid ANG-light at Nice Hospital
3. Methods
This section will explain how the walker can obtain the walking trajectory and determine the stride. During all the measurements, the calculation of walking trajectory and the detection of stride are the two most important issues as the measurement of all the gait parameters and their variability are based on the detection of stride.
3.1. Calculation of the trajectory
As shown in Fig. 3, the origin of the walker frame O1X1Y1 is supposed to
be the position of the middle point between two rear wheels. The position of the walker in a reference frame OXY is described by [x, y, θ], where θ de-scribes the walking direction of the rollator and represents the angle between the horizontal axis of two rear wheels and the X axis. In our experiment
X
Y
d θ θ dL dR D/2 D/2 Y X 1 1o
O
1Figure 3: Simple kinematic model of the walker
of 10mWT, as the reference trajectory was directed along the Y axis we have θ = 0 at the beginning of the walker’s trajectory. The trajectory of the
walker is determined by using the encoders. Assuming that at the (k + 1)th
time sample moment the measurement of the encoders of two rear wheels
are ∆L and ∆R, the displacement of the left and right wheel are obtained
respectively by using (1) and (2):
dL = 2πr
4C · 360∆L (1)
and
dR = 2πr
4C · 360∆R (2)
where r is the radius of the rear wheel and C is a constant parameter of the transformation between the value of encoder and the wheel radius. The
estimated as:
dθ = dL − dR
D , (3)
where D is the distance between the two rear wheels.
According to the kinematic model shown in Fig. 3, the changes of the walker’s position can be obtained as follows [37]:
dx = dL + dR 2 sin(θk+ dθ 2 ) (4) dy = dL + dR 2 cos(θk+ dθ 2 ) (5)
Finally, the new position of the walker can be calculated by using: xk+1 = xk+ dx yk+1 = yk+ dy θk+1 = θk+ dθ (6)
Using the above equations, the trajectory of the walker can be determined by using the encoders. The experiments have shown that after a straight line walking of 10 meters the estimated positioning has an absolute accuracy better than 1cm.
3.2. Detection of the stride
The instruments generally used to evaluate human’s gait are pedometers, accelerometers or gyrometers. To be appropriate for long-term measurements in everyday environments, these devices should be practical and not interfere with normal movement behaviour. Pedometers are small, easy to use and count the number of steps. The Yamax Digi-Walker SW-200 is considered the most accurate electronic pedometer, but its precision decreases at slower
walking speeds, making it less suitable for seniors with low physical fitness or gait abnormalities [38]. We have also used a pedometer (Omron) during the experiment and we have noticed large errors on the number of steps. Accelerometers are utilized to detect the walking stride in many studies [39], [40]. Most of methods use the peak value of forward acceleration to detect the walking cycle. However, some steps often does not lead to a high-peak forward acceleration, and hence they are not counted although there is dis-placement during these periods. A recent study [31] used thresholds on the magnitude of the gyroscope and accelerometer signals to identify the zero velocity instant and regarded it as the end of a step.
Our walker ANG also uses the gyrometer data to detect the walking stride. An interesting contribution of ANG is that it allows one to differen-tiate the right and left steps. Indeed when the subject is on the left (right) support phase the walking aid rotates on the left (right). Hence the rotational velocity of the walker around the vertical axis, which can be easily obtained by the gyrometer, is used to detect the walking stride. Its zero value instant is regarded as the end of a step. An example of rotational velocity for an elderly people is shown in Fig. 4.
Since the position of the walker at every moment has been calculated by using the method presented in Subsection 3.1, the displacement of the walker during every step, which is regarded as the step length of the subject, can be easily calculated as soon as all the steps are detected, as shown in Fig. 5. Accordingly, all gait speed characteristics (such as mean value, minimum and maximum value) can be obtained for each step. Moreover, other spatial-temporal gait parameters such as minimum and maximum acceleration can
be analyzed. With a sampling time of 1ms for the encoders and 4.8ms for the gyrometer, we may obtain a quiet reasonable accuracy on these parameters.
–10 –5 0 5 10 2 4 6 8 Time(s) (◦/s)
Figure 4: The rotational velocity of the walker around the vertical axis as function of time (◦/s). One step is finished when it passes zero.
4. Results
In order to analyze the result comprehensively, the walking accuracy, abil-ity and stabilabil-ity of the younger and elderly people are compared respectively in the following subsections.
4.1. Comparison of the walking accuracy
Using the calculation method proposed in section 3.1, the trajectories of all the subjects for the 10mWT are presented in Fig. 6. Here and in the following figures the younger adults’ trajectories are presented in red while the trajectories of the elderly are presented in blue. The reference trajectory is the horizontal axis and the vertical axis is scaled to illustrate the lateral
0 20 40 60 80 100 120 2 4 6 8 Time(s) (cm)
Figure 5: Displacement (cm) of the walker during every step as function of time (s). The results of left steps and right steps were put together and they appeared alternately.
deviations between the real and reference trajectories. Fig. 6 clearly shows that the elderly subjects have larger deviations than the younger.
Several indicators about the gait can be calculated from a trajectory, such as the maximum and mean value of the lateral deviations between the real and reference trajectory, the domain of the later deviation, the area between the real and reference trajectory, and the relative Standard Deviation (SD) values. Detailed results are given in the Appendix. Fig. 7 and Fig. 8 show the maximum lateral deviation and the area between the real and reference trajectory respectively, where the results of every group of subjects are sorted into ascending order. These figures illustrate that the results of the elderly subjects have a significantly larger deviation from the reference trajectory than that of the young subjects. For example, the mean value (with a stan-dard deviation) of the maximum lateral deviation for the elderly people is 11.048 ± 5.99 cm while that for the young people is only 3.963 ± 2.301 cm.
–25 –20 –15 –10 –5 0 5 0 200 400 600 800 1000 x(cm) y(cm)
Figure 6: Trajectory of the subjects in the xy plane, where the blue color denotes the elderly subjects and the red one denotes the young subjects. The reference trajectory is the horizontal line: y = 0.
Similarly, the mean value of the traveled area relative to the reference trajec-tory for the elderly people is 5930.639 ± 3218.4 cm2 while that for the young
people is 2085.702 ± 1708.313 cm2. [30] has proposed that there exists
sig-nificant group difference in the medio-lateral displacement of center of mass between healthy elderly adults and elderly patients. It is consistent with our result and they reveal that walking accuracy can be regarded as a pertinent walking quality index.
In addition, several other indicators such as the traveled Manhattan dis-tance and the absolute mean orientation angle presented in Appendix also can be used to measure the walking accuracy of the subjects, and we found that their values for the elderly people are significantly larger than that of the younger people. For the elderly people the mean value of the Manhattan
5 10 15 20 25 5 10 15 20 25 Subject number (cm)
Figure 7: The maximum lateral deviation (cm) between the real and reference trajectory, where the blue color denotes the elderly subjects and the red one denotes the young subjects. The results of every group of subjects are sorted into ascending order.
2000 4000 6000 8000 10000 12000 14000 5 10 15 20 25 Subject number (cm2)
Figure 8: The area (cm2) between the real and reference trajectory of the elderly and
young adults. Blue color denotes the elderly subjects and the red one denotes the young subjects. The results of every group of subjects are sorted into ascending order.
distance is 1070.003 ± 37.077 cm while for the young people this value is 1020.863 ± 14.885 cm. Similarly, the mean value of the absolute mean orien-tation angle for the elderly people is 1.538 ± 0.553◦ while that for the young
people is 0.951 ± 0.311◦. In summary, the lateral motion of the elderly is
larger than the younger, and the indicators that can be used to characterize this deviation are:
• the relative values of the lateral deviations between the real and refer-ence trajectory,
• the area between the real and reference trajectory, • the travelled Manhattan distance,
• the relative values of the orientation angle of the walking aid.
4.2. Comparison of the walking ability
By using the walker, most of gait parameters presented in the usual walk-ing test can be calculated or estimated, such as gait cycle, gait or walkwalk-ing speed, step length, cadence and forward acceleration. Detailed results are given in Table A.19 in the Appendix. Although the step width cannot be calculated precisely, the analysis of the walker’ lateral motion in the previous section can reflect the characteristic of the subjects’ step width.
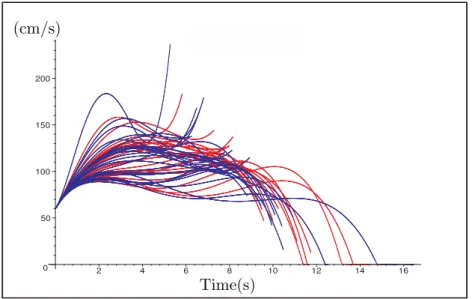
In addition, the instantaneous walking velocity can be derived from the encoder measurements. The instantaneous walking velocity is given in Fig. 9 which shows that there is no obvious difference between the elderly and young subjects. [19] and [20] also mentioned that the age-related differences in walking velocity were not significant. Fig. 10 gives their maximum values
and it illustrates that the maximum walking velocity of the younger subjects is a little larger than that of the elderly. For the elderly people the mean value of the maximum walking velocity is 117.969 ± 15.851 cm/s and for the young people this value is 119.967 ± 16.019 cm/s.
SPEED instant (m/s) 0 50 100 150 200 2 4 6 8 10 12 14 16 Time(s) (cm/s)
Figure 9: Instantaneous walking velocity (cm/s) of elderly and young adults. Blue color denotes the elderly subjects and the red one denotes the young subjects. In order to esti-mate it more precisely, only the middle part of the trajectory is used to do the derivation.
It has been estimated that a comfortable walking speed for young adult lies in the range 130 cm/s–160 cm/s while for elderly people this speed is given by the formula 117 − 0.4 × age [33]. The mean speed value for elderly people is coherent with this formula while the result of the younger adults is lower than the normal walking speed. Experiences without the walking aid have shown that the younger subjects were presenting a mean velocity that was close to the normal walking speed. Our interpretation is that elderly people are more familiar with walking aids and have walking patterns that
maximum instantanous speed 100 120 140 160 180 200 220 5 10 15 20 25 Subject number (cm/s)
Figure 10: Maximum instantaneous walking velocity (cm/s) of elderly and young adults. Blue color denotes the elderly subjects and the red one denotes the young subjects. The results of every group of subjects are sorted into ascending order.
benefit from such an aid, while younger people have a more dynamic pattern that is jeopardized by the aid. This can explain why the maximum velocities of the younger are higher, as shown in Fig. 10.
The results of step period and step length for the two groups are given in Fig. 11 and Fig. 12. Our previous work [41] has shown that there is no difference between the left steps and the right steps so here and in the following contents the results of two steps are put together. The results illustrate that there is almost no difference between the two groups which explains why the two groups have similar walking speed. The mean values of step period and step length of the elderly people are 0.526 ± 0.1 s and 54.862 ± 11.643 cm receptively, and these values of the young people are 0.537 ± 0.095 s and 55.050 ± 8.605 cm. Exactly, about 78% of the subjects
(37 of 48) have a step period between 0.4 s and 0.6s, and 75% of the subjects (36 of 48) have a step length between 40 cm and 60 cm,
0.4 0.5 0.6 0.7 5 10 15 20 25 Subject number (s)
Figure 11: Mean value of step period (s), where the blue color denotes the elderly subjects and the red one denotes the young subjects. The results of every group of subjects are sorted into ascending order.
Next we have considered the mean value of forward acceleration shown in Fig. 13. It illustrates that the forward accelerations of the elderly are larger than that of the younger. In addition, almost 70% of the younger’s (16 of 23) mean forward accelerations are less than zero while for the elderly this number is only 40% (10 of 25). Therefore, we can deduce that the minimum velocity of the younger is less than that of the elderly although their mean speed is almost the same. As a result, the elderly subjects can use less time to arrive to the goal, as shown in Fig. 14. This contradicts the usual assumption (which is based on the 10mWT) that the walking time may be used to evaluate the walking ability.
40 50 60 70 80 5 10 15 20 25 Subject number (cm)
Figure 12: Mean value of step length (cm), where the blue color denotes the elderly subjects and the red one denotes the young subjects. The results of every group of subjects are sorted into ascending order.
–0.2 –0.1 0 0.1 0.2 5 10 15 20 25 Subject number (m/s2)
Figure 13: Mean value of forward acceleration (m/s2), where the blue color denotes the
elderly subjects and the red one denotes the young subjects. The results of every group of subjects are sorted into ascending order.
8 10 12 14 16 18 5 10 15 20 25 Subject number (s)
Figure 14: Time used for 10mWT (s) of elderly and young adults. Blue color denotes the elderly subjects and the red one denotes the young subjects. The results of every group of subjects are sorted into ascending order.
In summary, the elderly people have similar walking speed, step length, step period as the younger people, but there are three indicators for which the difference exists between the younger and elderly adults:
• maximum instantaneous walking velocity, • mean value of the forward acceleration, • time used for the total test.
4.3. Comparison of the walking stability
Gait variability is an index of gait stability and complexity. The increased variability of gait parameters corresponds to decreased gait stability, com-plexity and increased risk of falling. Gait variability is defined as changes
in gait parameters from one stride to the next. It can be characterized by the coefficient of variation (CV) of kinematic gait parameters [15], [28]. The coefficient of variation (CV) is defined as the ratio of the standard deviation (SD) to the mean, i.e., for a set of gait parameter A, it’s CV is:
CV (A) = SD(A)
mean(A). (7)
Hence CV shows the extent of variability in relation to mean of the popula-tion. Here we have compared the CV of step length, step period and walking speed between the two groups. The results are given in Fig. 15 and detailed information are given in Table A.19 in the Appendix. Fig. 15 shows that the CV of step length for the two groups are similar. The comparison of the CV of stride time illustrates the same characteristic thus it was not presented here. Our results are similar to those of some previous studies [19], [20], [42], which presented that there were no significant differences between young and elderly healthy people in CV of step length and stride time. For the elderly people the mean value of CV of step length is 0.545 ± 0.194 cm and for the young people this value is 0.513 ± 0.143 cm. Next, the CV of walking speed is shown in Fig. 15, as expected the walking speed of elderly exhibits less variability than that of younger adults but the difference is small. Exactly, the mean values of CV of walking speed of the elderly and young people are respectively 0.206 ± 0.09 cm/s and 0.238 ± 0.07 cm/s.
As indicated in the introduction, other information about the pressure on the handles can be used to analyze the walking stability by measuring the
angular velocity around the forward direction X1 and the lateral direction Y1
(see Fig. 3). We were surprised that the angular velocity measurements were sensitive enough to estimate changes in the forward/backward support force
Variation of gait speed 0.2 0.4 0.6 0.8 1 1.2 1.4 1.6 1.8 5 10 15 20 25 Subject number
Figure 15: Coefficient of variation for the step length and walking speed, where the blue color denotes the elderly subjects and the red one denotes the young subjects. The results of every group of subjects are sorted into ascending order.
(change on the angular velocity around Y1) and on the left/right support force (change on the angular velocity around X1).
Hence we have been able to determine the respective percentage of for-ward/backward and left/right support with a reasonable accuracy without any force sensors in the handles [43]. Fig. 17 shows the percentage of forward support. It is interesting to note that the results of the younger people are much farther away from 50% than that of the elderly people. Exactly, the mean value of the respective percentage of forward support of the young peo-ple is 61.902% ±5.093% while that of the elderly peopeo-ple is 58.160%±4.378%. That means for younger people the difference between forward and backward support is larger. Surprisingly the younger adults are leaning significantly more on the aid than the elderly people.
Based on the above analysis, it appears that the following three indicators should be investigated in the future:
50 55 60 65 70 5 10 15 20 25 Subject number (%)
Figure 16: Percentage of the forward support, where the blue color denotes the elderly subjects and the red one denotes the young subjects. The results of every group of subjects are sorted into ascending order.
• variability of walking speed,
• percentage of forward/backward support, • percentage of right/left support.
5. Other applications of the walker ANG
Besides of gait analysis, our walker ANG [14] can perform multifunctions such as navigation, fall detection/prevention and street mapping. Here we will give an example of its application for updating collaborative maps with sideway slopes and location of lowered kerbs.
The walker is instrumented with an accelerometer that measures both the gravity and the walker’s acceleration, which is usually much lower than
Figure 17: Qualified map of INRIA Sophia Antipolis by using the walker ANG, where the red lines denote the roads with high slope and the green lines denote the almost horizontal roads that we walked on with the walker.
the gravity. Hence an appropriate processing of the measurement allows to determine the direction of gravity in the walker’s frame. In turn this directly allows to determine the roll and tilt of the walker. According to these information, we can measure the slope of sideways, detect lowered kerbs and measure the quality of the sidewalk surfaces. For example, Fig. 17 shows a qualified map of INRIA Sophia Antipolis, where the red lines denote the roads with high slope and the green lines denote the almost horizontal roads
that we walked on with the walker. Post-processing of this information allows to report the results in OpenStreetMap to produce an ad-hoc map. Hence it is significant for the end-users of walker or wheelchair because they can share more information of a city while planners can take into account sideway slopes and location of lowered kerbs to determine an optimal itinerary for them.
6. Conclusions
This paper has proposed a gait analysis method based on the use of an instrumented walker. The results of a 10 m straight line test for 23 younger people and 25 elderly people were compared comprehensively. The compar-ison includes the relative information about walking accuracy, ability and stability. Several important indicators that exhibit significant difference be-tween the two groups were obtained, such as the maximum lateral deviations between the real and reference trajectory, the area and the Manhattan dis-tance between the real and reference trajectory. For the elderly people these indicators are much larger than that of the young people, and exhibit also significant difference within the same group.
As for the gait parameters describing the walking ability, it appears that there is no obvious difference in step length, step period and walking speed between two groups. The instantaneous walking velocity has been obtained and we found out the maximum instantaneous walking velocity of the younger people is a little larger than that of the elderly people. On the other hand, surprisingly, the time required to perform the trajectory is usually lower for the elderly than for young people. Our explanation is that the normal gait of younger adults was more affected by the presence of the walker than for
elderly that are more accustomed with the use of the walker. In addition, when we tried to use the variability of gait parameters to analyze the walking stability, there are similar results for the two groups in the variability of step length and step period while for the younger subjects the variability of the walking speed is larger.
Moreover, we also found that the younger adults are leaning significantly more on the aid than the elderly people. Hence the influence of the walker on the walk pattern of the younger people should be investigated. Besides of this, another walking test with a returning trajectory for two groups people will be studied. We also want to examine if a learning process may be implemented in order to characterize the walking pattern at a given time and customize the walking analysis software in order to better determine future trends. Finally, it is worth mentioning that the present analysis method depends on the measurement of sensors with noise that do not satisfy usual statistical hypothesis (e.g., they are not Gaussian). In the future we plan to take measurement uncertainties into account by using interval analysis for obtaining the indicators as interval values that will be guaranteed to include the real values, with the advantage that the width of the interval will be a measure of the quality of the result.
References
[1] A. Frizera, R. Ceres, J. Pons, A. Abellanas, R. Raya, The smart walkers as geriatric assistive device. the simbiosis purpose, Gerontechnology 7 (2) (2008) 108–113.
in-telligent walkers for the elderly, in: AAAI Fall Symposium, Arlington, 2005, pp. 1509–1514.
[3] R. Bostelman, J. Albus, Robotic patient transfer and rehabilitation de-vice for patient care facilities or the home, Advanced Robotics 22 (12) (2008) 1287–1307.
[4] J. Glover, et al., A robotically-augmented walker for older adults, Tech. Rep. CMU-CS-03-170, CMU, Pittsburgh (August 1 2003).
[5] D. Chugo, et al., A moving control of a robotic walker for standing, walk-ing and seatwalk-ing assistance, in: Int. Conf. on Robotics and Biomimetics, Bangkok, 2008, pp. 692–697.
[6] M. P., V. Pasqui, F. Plumet, P. Bidaud, J.-C. Guinot, Elderly people sit to stand transfer experimental analysis, in: 8th Int. Conf. on Climbing and Walking Robots (CLAWAR), London, 2005.
URL http://www.isir.upmc.fr//files/2005ACTI135.pdf
[7] R. Grasse, Y. Mor`ere, A. Pruski, Assisted navigation for persons with reduced mobility: path recognition through particle filtering (conden-sation algorithm), J. of Intelligent and Robotic Systems 60 (1) (2010) 19–57.
[8] V. Kulyukin, et al., iWalker: toward a rollator mounted wayfinding system for the elderly, in: IEEE Int. Conf. on RFID, Las Vegas, 2008, pp. 303–311.
[9] Y. Hirata, S. Komatsuda, K. Kosuge, Fall prevention of passive intelli-gent walker based on human model, in: IEEE Int. Conf. on Intelliintelli-gent Robots and Systems (IROS), Nice, 2008, pp. 1222–1228.
[10] M. Spenko, H. Yu, S. Dubowsky, Robotic personal aids for mobility and monitoring for the elderly, IEEE Transactions on Neural systems and Rehabilitation Engineering 14 (3) (2006) 344–351.
[11] G. Wasson, J. Gunderson, S. Graves, Effective shared control in co-operative mobility aids, in: Proceedings of the Fourteenth International Florida Artificial Intelligence Research Society Conference, AAAI Press, 2001, pp. 509–513.
[12] M. Alwan, G. Wasson, P. Sheth, A. Ledoux, C. Huang, Passive deriva-tion of basic walker-assisted gait characteristics from measured forces and moments, in: Proceedings of the 26th Annual International Confer-ence of the IEEE EMBS, 2004, pp. 2691–2694.
[13] M. Alwan, A. Ledoux, G. Wasson, P. Sheth, C. Huang, Basic walker-assisted gait characteristics derived from forces and moments exerted on the walker’s handles: results on normal subjects, Medical Engineering & Physics 29 (3) (2007) 380–389.
[14] J.-P. Merlet, ANG, a family of multi-mode, low cost walking aid, in: IEEE Int. Conf. on Intelligent Robots and Systems (IROS),Workshop Assistance and Service Robotics in a Human Environment, Vilamoura, 7-122012.
URL http://www-sop.inria.fr/coprin/PDF/trans_irosws2012. pdf
[15] J. Hollman, F. Kovash, JJ.Kubik, R. Linbo, Age-related differences in spatiotemporal markers of gait stability during dual task walking, Gait & Posture 26 (1) (2007) 113–119.
[16] H. Menz, S. Lord, R. Fitzpatrick, Age-related differences in walking stability, Age Ageing 32 (2) (2003) 137–142.
[17] R. Woledge, D. Birtles, D. Newham, The variable component of lateral body sway during walking in young and older humans, The Journals of Gerontology: Series A 60 (11) (2005) 1463–1468.
[18] T. Owings, M. Grabiner, Variability of step kinematics in young and older adults, Gait & Posture 20 (1) (2004) 26–35.
[19] P. Grabiner, S. Biswas, M. Grabiner, Age-related changes in spatial and temporal gait variables, Archives of Physical Medicine and Rehabilita-tion 82 (1) (2001) 31–36.
[20] JM.Hausdorff, H. Edelberg, S. Mitchell, A. Goldberger, J. Wei, In-creased gait unsteadiness in community-dwelling elderly fallers, Archives of Physical Medicine and Rehabilitation 78 (3) (1997) 278–283.
[21] R. Barbara, S. Freitas, L. Bagesteiro, M. Perracini, S. Alouche, Gait characteristics of younger-old and older-old adults walking overground and on a compliant surface, Brazilian Journal of Physical Therapy 16 (5) (2012) 375–380.
[22] SU.Ko, J. Hausdorff, L. Ferrucci, Age-associated differences in the gait pattern changes of older adults during fast-speed and fatigue conditions: results from the baltimore longitudinal study of ageing, Age & Ageing 39 (6) (2010) 688–694.
[23] M. Callisaya, L. Blizzard, M. Schmidt, J. McGinley, VK.Srikanth, Sex modifies the relationship between age and gait: a population-based study of older adults, The Journals of Gerontology: Series A 63 (2) (2008) 165–170.
[24] W. Zijlstra, A. Hof, Assessment of spatio-temporal gait parameters from trunk accelerations during human walking, Gait & Posture 18 (2) (2003) 1–10.
[25] S. Studenski, S. Perera, K. Patel, et al., Gait speed and survival in older adults, The Journal of American Medical Association Network 305 (1) (2011) 50–58.
[26] M. Callisaya, L. Blizzard, M. Schmidt, J. McGinley, VK.Srikanth, Age-ing and gait variability–a population-based study of older people, Age Ageing 39 (2) (2010) 191–197.
[27] J. Hausdorff, D. Rios, H. Edelberg, Gait variability and fall risk in community-living older adults: a 1-year prospective study, Archives of Physical Medicine and Rehabilitation 82 (8) (2001) 1050–1056.
[28] V. Dubost, RW.Kressig, R.Gonthier, F. Herrmann, K. Aminian, B. Na-jafi, O. Beauchet, Relationship between dual task related changes in
stride velocity and stride time variability in healthy older adults, Hu-man Movement Science 25 (3) (2006) 372–382.
[29] A. Thomas, N. Kruzel, Evaluation of gait disorders in the elderly, Natur-opathic Doctor News & Review (2013) 1–8.
[30] M. Hahn, L. Chou, Can motion of individual body segments identify dynamic instability in the elderly, Clinical Biomechanics 18 (8) (2003) 737–744.
[31] J. Rebula, L. Ojeda, P. Adamczyk, A. Kuo, Measurement of foot place-ment and its variability with inertial sensors, Gait & Posture 38 (4) (2013) 974–980.
[32] R. Isles, N. Choy, M. Steer, J. Nitz, Normal values of balance tests in women aged 20-80, Journal of the American Geriatrics Society 52 (8) (2004) 1367–1372.
[33] N. Salbach, N. Mayo, J. Higgins, S. Ahmed, L. Finch, C. Richards, Re-sponsiveness and predictability of gait speed and other disability mea-sures in acute stroke, Archives of Physical Medicine and Rehabilitation 82 (9) (2001) 1204–1212.
[34] D. Podsiadlo, S. Richardson, The timed ’up & go’: a test of basic func-tional mobility for frail elderly persons, Journal of American Geriatrics Society 39 (2) (1991) 142–148.
[35] M. Tinetti, Performance-oriented assessment of mobility problems in elderly patients, Journal of American Geriatrics Society 34 (2) (1986) 119–126.
[36] B. A. G. R. Panella L, Lombardi R, P. P., Towards objective quantifi-cation of the tinetti test, Functional Neurology 17 (1) (2002) 25–30. [37] C. W. Lee K, Jung C.b., Accurate calibration of kinematic parameters
for two wheel differential mobile robots, Journal of Mechanical Science and Technology 26 (5) (2011) 1603–1611.
[38] B. Dijkstra, W. Zijlstra, E. Scherder, Y. Kamsma, Detection of walking periods and number of steps in older adults and patients with parkin-son’s disease: accuracy of a pedometer and an accelerometry-based method., Age & Ageing 37 (4) (2008) 436–441.
[39] W. Zijlstra, Assessment of spatio-temporal parameters during uncon-strained walking, European Journal of Applied Physiology 92 (1-2) (2004) 39–44.
[40] Y. Huang, H. Zheng, C. Nugent, et al., An orientation free adaptive step detection algorithm using a smart phone in physical activity monitoring, Health and Technology (2) (2012) 249–258.
[41] J. Merlet, Using a robotized aid for walking analysis: experiments and preliminary results, in: Workshop on Assistance and Service Robotics in a Human Environment, IROS 2013, Tokyo Big Sight, Japan, 2013. [42] N. U. Gabell A, The effect of age on variability in gait, Journal of
geron-tology 39 (6) (1984) 662–666.
[43] R. Bachschmidt, G. Harris, G. Simoneau, Development of an instru-mented walker for measurement of unilateral hand loads, in: Fifteenth Southern Biomedical Engineering Conference, Dayton, 1996, pp. 53–55.
Results of the elderly subjects Subject Total time used(s) Time used for 10m Traveled euclidean distance(cm) Traveled manhattan distance(cm) Error domaine(cm) Maximum absolute error(cm) Mean error (cm) Standard deviation of error (cm) Average absolute deviation (cm) Area between real traj and reference traj(cm^2) Mean orientation (degree) Standard deviation of rientation (degree) Average absolute deviation of orientation (degre) 1 10.113 9.718 1040.686 1069.070 13.863 12.016 -7.620 3.222 2.650 7057.905 -0.274 1.837 1.562 2 10.423 8.934 1166.656 1179.347 5.055 5.055 -2.877 1.483 1.325 3398.169 -0.176 1.024 0.815 3 8.496 8.308 1022.638 1034.198 4.699 3.464 -1.749 1.020 0.908 1768.897 -0.015 0.924 0.743 4 14.537 14.760 984.854 1001.812 7.839 6.907 -2.555 2.292 1.968 2900.350 0.080 1.240 0.989 5 10.088 9.563 1054.914 1082.618 13.866 13.866 -6.384 4.647 4.033 7000.278 -0.154 1.940 1.670 6 11.946 11.898 1004.027 1031.728 13.903 13.903 -8.286 4.213 3.613 8786.815 -0.235 1.973 1.690 7 8.624 8.156 1057.320 1085.517 9.772 9.772 -5.710 2.186 1.767 6258.550 -0.604 1.702 1.351 8 10.601 10.236 1035.678 1068.704 15.968 15.510 -7.343 5.280 4.688 8619.661 0.045 2.287 1.903 9 8.945 8.787 1018.028 1066.260 23.568 22.163 -4.163 6.331 4.844 5955.932 -1.202 2.194 1.831 10 12.239 11.383 1075.235 1092.079 5.783 5.783 -2.944 1.632 1.452 3362.376 -0.252 1.337 1.003 11 9.800 9.314 1052.148 1068.561 6.686 3.702 0.004 2.030 1.788 1880.020 0.120 1.090 0.875 12 18.456 17.242 1070.415 1088.041 6.959 6.628 -3.456 2.606 2.446 4716.062 -0.274 1.373 1.130 13 12.479 12.591 991.120 1031.188 19.880 19.880 -10.213 6.084 5.172 11326.516 -0.079 3.152 2.520 14 12.408 11.700 1060.484 1077.227 7.498 7.072 -3.600 2.477 2.179 3752.420 -0.142 1.379 1.122 15 10.440 10.209 1022.716 1066.890 15.224 15.224 -7.994 3.430 2.701 8868.822 -1.005 2.229 1.866 16 8.264 8.102 1019.958 1047.481 13.614 13.614 -7.761 4.260 3.813 7688.381 -0.506 2.656 2.119 17 12.095 11.587 1043.780 1068.686 11.825 9.238 -2.644 3.933 3.607 3761.081 -0.266 2.169 1.700 18 9.736 9.377 1038.248 1072.650 16.314 16.116 -7.630 5.086 4.674 7935.143 -0.203 2.672 2.186 19 12.927 12.325 1048.851 1067.417 8.315 6.000 -2.460 2.228 1.853 2972.125 0.038 1.558 1.131 20 10.087 9.843 1024.833 1076.353 26.192 26.192 -13.479 8.265 7.312 14619.055 0.079 3.628 3.076 21 7.273 6.997 1039.459 1063.419 8.052 5.319 -1.042 2.249 1.888 2006.372 0.138 1.684 1.389 22 8.810 7.827 1125.638 1147.934 9.124 5.108 0.649 2.930 2.707 2947.763 -0.111 1.688 1.304 23 11.448 11.565 989.839 1010.958 9.206 9.197 -5.439 2.309 1.823 5450.687 -0.126 1.539 1.314 24 10.920 10.189 1071.751 1093.331 9.893 9.863 -5.399 2.747 2.443 6111.605 0.086 1.583 1.306 25 10.806 10.492 1029.881 1058.610 14.617 14.617 -9.007 4.354 3.896 9120.989 -0.237 2.153 1.796 26 16.332 16.107 1013.973 1029.073 4.445 4.236 -2.104 1.503 1.413 2406.272 -0.106 1.188 0.955 27 10.793 10.735 1005.426 1019.371 4.469 2.715 0.955 1.337 1.174 1512.369 -0.008 1.051 0.848 28 13.666 13.636 1002.144 1013.737 2.549 2.056 0.559 0.793 0.692 809.319 -0.048 0.910 0.730 29 10.857 10.713 1013.364 1021.897 2.227 2.067 0.826 0.680 0.607 1036.115 -0.082 0.747 0.614 30 11.576 11.624 995.917 1011.723 3.744 3.734 -1.519 1.157 1.054 1896.943 -0.009 1.184 0.905 31 10.511 10.499 1001.144 1013.170 4.569 3.739 1.223 1.413 1.243 1737.640 -0.020 1.003 0.820 32 11.976 11.964 1001.035 1010.207 3.073 2.908 1.141 0.922 0.844 1344.696 0.002 0.738 0.614 33 13.737 13.190 1041.459 1055.006 5.603 5.603 2.913 1.497 1.253 3268.150 0.049 1.024 0.859 34 12.241 11.782 1038.936 1051.297 3.492 2.661 0.896 0.932 0.795 1180.521 0.019 1.016 0.816 35 9.977 9.861 1011.707 1035.818 8.397 8.397 -5.465 2.668 2.304 6003.658 -0.190 1.946 1.582 36 10.944 10.811 1012.325 1033.995 9.874 9.874 -5.492 2.848 2.389 6266.182 0.107 2.171 1.678 37 10.160 9.938 1022.427 1049.399 9.817 9.817 -5.563 2.678 2.180 6165.286 0.102 2.009 1.701 38 11.493 11.558 994.394 1007.535 4.321 3.806 -1.346 1.163 0.967 1538.759 -0.036 1.004 0.787 39 13.517 13.509 1000.582 1014.853 4.727 3.298 -0.956 1.447 1.215 1622.401 0.020 1.154 0.916 40 13.097 13.161 995.136 1007.984 4.731 3.123 0.153 1.276 1.024 1092.119 -0.092 1.000 0.824 41 11.176 11.145 1002.730 1010.248 2.271 1.693 0.726 0.623 0.540 820.150 0.074 0.745 0.599 42 11.079 11.087 999.285 1012.005 3.504 3.168 -1.183 0.974 0.846 1218.985 -0.144 1.116 0.910 43 9.960 9.896 1006.504 1022.513 4.570 2.717 0.252 1.291 1.094 1172.839 -0.132 1.255 1.037 44 9.720 9.738 998.128 1011.245 4.028 3.482 -1.282 1.159 0.973 1534.383 -0.170 1.089 0.887 45 10.711 10.702 1000.886 1012.559 3.662 3.058 -0.790 1.028 0.907 1036.045 -0.023 0.882 0.703 46 9.272 9.191 1008.871 1023.952 4.312 2.755 0.528 0.980 0.775 889.333 0.218 1.563 1.162 47 7.824 7.941 985.252 1003.301 4.927 2.509 -0.210 1.263 1.013 1061.180 -0.059 1.353 1.144 48 18.157 18.204 997.402 1008.961 3.856 3.742 2.071 1.227 1.077 2357.790 -0.126 1.021 0.816 le:///auto/sop-nas2a/u/sop-nas2a/vol/home_coprin/tiwan... 1 of 1 01/28/2014 10:52 AM
Results of the elderly (1--25) and young subjects (26--48)
Analyse of two legs Subject Step number Mean step length (cm) Minimum step length (cm) Maximum step length (cm) Variation of step length Mean walking cycle (s) Minimun walking cycle(s) Maximum walking cycle(s) Variation of walking cycle Mean walking speed(cm/s) Variation of walking speed Mean foward acceleration (m/s^2) Standard deviation of foward acceleration (m/s^2) 1 12 82.921 52.920 202.720 0.551 0.734 0.482 1.692 0.501 112.608 0.129 -0.102 0.208 2 25 42.404 7.022 136.153 0.658 0.389 0.078 1.073 0.553 109.091 0.268 0.031 0.233 3 18 56.293 1.427 101.454 0.555 0.461 0.001 0.818 0.507 217.939 1.780 -0.053 0.385 4 23 45.676 6.320 69.053 0.319 0.610 0.081 1.045 0.349 75.833 0.106 0.219 0.144 5 17 72.040 1.126 235.058 0.872 0.661 0.012 1.974 0.800 107.812 0.135 0.107 0.213 6 20 51.100 20.202 99.100 0.459 0.577 0.200 0.960 0.406 89.776 0.193 0.075 0.120 7 14 74.004 17.926 130.485 0.360 0.581 0.328 1.233 0.400 127.207 0.207 -0.231 0.261 8 19 58.561 27.199 86.262 0.276 0.523 0.339 0.689 0.201 110.614 0.131 0.035 0.198 9 17 59.859 3.074 207.145 0.871 0.504 0.016 1.513 0.740 126.354 0.288 -0.034 0.259 10 21 47.998 2.916 152.318 0.728 0.480 0.028 1.577 0.721 100.605 0.168 0.014 0.189 11 20 51.994 1.416 100.955 0.473 0.465 0.005 0.866 0.447 121.855 0.411 -0.132 0.494 12 31 37.701 0.669 110.098 0.687 0.607 0.049 2.673 0.833 68.111 0.374 0.165 0.199 13 27 40.483 1.137 99.439 0.678 0.451 0.006 1.016 0.658 94.144 0.272 0.108 0.240 14 29 33.312 5.858 97.523 0.588 0.379 0.055 1.006 0.568 90.361 0.167 0.131 0.266 15 18 56.441 9.332 91.475 0.455 0.529 0.079 0.915 0.476 109.992 0.136 0.087 0.224 16 19 48.610 8.972 97.786 0.438 0.401 0.255 0.706 0.311 118.447 0.267 -0.119 0.459 17 20 52.996 1.223 106.687 0.529 0.592 0.006 1.748 0.679 99.928 0.262 0.173 0.173 18 17 62.476 6.570 89.165 0.351 0.545 0.107 0.789 0.336 112.329 0.179 -0.077 0.291 19 24 43.558 15.888 87.297 0.437 0.511 0.174 1.443 0.551 87.792 0.080 0.198 0.191 20 18 60.378 18.027 75.697 0.247 0.548 0.438 0.657 0.117 110.144 0.223 -0.099 0.240 21 17 57.511 6.455 85.754 0.512 0.375 0.041 0.625 0.502 151.234 0.104 0.018 0.198 22 20 57.823 19.110 89.430 0.315 0.432 0.220 0.606 0.261 134.145 0.186 -0.066 0.408 23 17 69.029 20.903 198.043 0.659 0.739 0.234 2.075 0.640 93.700 0.122 0.114 0.195 24 22 51.904 15.072 145.279 0.597 0.487 0.130 1.211 0.491 103.673 0.181 0.082 0.482 25 18 56.484 1.473 221.339 0.999 0.577 0.007 2.124 0.946 103.840 0.356 -0.032 0.197 26 17 63.562 4.135 128.368 0.454 0.786 0.315 2.275 0.630 83.235 0.288 0.022 0.099 27 23 42.397 2.444 128.813 0.861 0.404 0.017 1.104 0.798 108.786 0.277 -0.101 0.285 28 21 44.727 13.856 79.080 0.441 0.500 0.242 0.806 0.326 88.666 0.252 -0.086 0.193 29 24 48.638 6.452 99.169 0.465 0.450 0.045 0.852 0.488 116.145 0.240 0.104 0.317 30 19 65.546 17.305 169.675 0.646 0.668 0.211 1.453 0.592 99.821 0.261 0.026 0.293 31 19 60.559 18.135 110.274 0.421 0.528 0.137 0.947 0.425 117.764 0.173 -0.040 0.269 32 22 48.086 9.139 93.776 0.473 0.472 0.083 1.084 0.559 106.607 0.147 -0.000 0.159 33 21 54.244 7.390 85.969 0.420 0.578 0.073 0.853 0.365 93.539 0.214 -0.038 0.295 34 21 52.800 1.019 78.531 0.405 0.554 0.007 0.764 0.334 97.361 0.244 -0.016 0.244 35 16 71.941 32.556 184.565 0.509 0.655 0.280 1.779 0.540 112.527 0.186 -0.043 0.265 36 16 68.243 46.257 90.528 0.169 0.591 0.375 1.289 0.374 120.280 0.133 -0.092 0.201 37 19 62.723 3.583 109.991 0.413 0.551 0.026 0.935 0.350 114.700 0.201 -0.109 0.336 38 17 56.930 9.549 137.246 0.588 0.610 0.248 1.428 0.486 91.555 0.321 -0.088 0.314 39 20 58.976 13.937 106.636 0.475 0.662 0.173 1.430 0.476 90.444 0.244 0.021 0.271 40 25 40.416 1.155 79.878 0.637 0.482 0.004 1.038 0.588 94.237 0.478 0.048 0.207 41 21 49.478 5.605 126.980 0.733 0.514 0.083 1.248 0.646 95.306 0.266 -0.041 0.227 42 18 58.275 2.376 129.605 0.635 0.524 0.038 1.143 0.622 109.730 0.261 -0.131 0.331 43 19 54.777 7.646 111.694 0.555 0.463 0.056 1.253 0.609 123.488 0.252 -0.067 0.276 44 22 51.677 7.011 79.897 0.397 0.454 0.135 0.747 0.349 112.852 0.241 -0.091 0.363 45 20 54.936 2.875 79.032 0.372 0.478 0.105 0.662 0.309 110.902 0.240 -0.148 0.395 46 22 49.220 2.809 101.165 0.651 0.381 0.017 0.895 0.702 137.518 0.180 0.066 0.384 47 16 64.334 11.461 116.511 0.547 0.479 0.075 1.001 0.595 141.711 0.162 -0.130 0.359 48 27 43.658 9.531 89.937 0.529 0.578 0.141 1.135 0.488 76.389 0.216 0.066 0.208 file:///auto/sop-nas2a/u/sop-nas2a/vol/home_coprin/tiwan... 1 of 1 01/31/2014 02:12 PM
Results of the elderly (1-25) and young subjects (26-48)
Figure A.19: Result of gait parameters for the elderly (1 − 25) and younger subjects(26 − 48).