HAL Id: hal-00296932
https://hal.archives-ouvertes.fr/hal-00296932
Submitted on 2 Feb 2006
HAL is a multi-disciplinary open access
archive for the deposit and dissemination of
sci-entific research documents, whether they are
pub-lished or not. The documents may come from
teaching and research institutions in France or
abroad, or from public or private research centers.
L’archive ouverte pluridisciplinaire HAL, est
destinée au dépôt et à la diffusion de documents
scientifiques de niveau recherche, publiés ou non,
émanant des établissements d’enseignement et de
recherche français ou étrangers, des laboratoires
publics ou privés.
The relationship between ENSO and Paraná River flow
A. O. Cardoso, P. L. Silva Dias
To cite this version:
A. O. Cardoso, P. L. Silva Dias. The relationship between ENSO and Paraná River flow. Advances
in Geosciences, European Geosciences Union, 2006, 6, pp.189-193. �hal-00296932�
Advances in Geosciences, 6, 189–193, 2006 SRef-ID: 1680-7359/adgeo/2006-6-189 European Geosciences Union
© 2006 Author(s). This work is licensed under a Creative Commons License.
Advances in
Geosciences
The relationship between ENSO and Paran´a River flow
A. O. Cardoso and P. L. Silva Dias
Instituto de Astronomia, Geof´ısica e Ciˆencias Atmosf´ericas, Universidade de S˜ao Paulo, Brasil
Received: 14 May 2005 – Revised: 13 January 2006 – Accepted: 16 January 2006 – Published: 2 February 2006
Abstract. Several studies indicate that there is a relationship
between the climatic variability in the South American con-tinent and alterations of the position and intensity of the heat sources in the equatorial region. The El Ni˜no phenomenon can influence the precipitation over some regions of South America such as the Brazilian Northeast, Amazonia, South of Brazil and Uruguay. Over 80% of Brazil’s energy comes from hydropower, and decisions concerning future availabil-ity and pricing require forecasts of river flow, ideally several months in advance. In this work the relationship between the Paran´a River flow and the ENSO (El Ni˜no/Southern Oscil-lation) mode is investigated and statistical forecasts of river flow are tested. An evaluation of the relationship between the Pacific sea surface temperature and the Paran´a River flow indicates an ENSO pattern over the equatorial Pacific. The time series of the ENSO mode obtained by applying principal components analysis on the sea surface temperature (SST) were used as predictors for the Paran´a River flow forecast. Improvement in the model forecast skill is also obtained by considering the lagged river flow time series as a predictor.
1 Introduction
The El Ni˜no phenomenon influences the precipitation over parts of South America, such as Brazilian Northeast, east-ern Amazonia, South of Brazil, Uruguay and northeasteast-ern Argentina. Sea surface temperature (SST) positive anoma-lies in the equatorial Pacific favour precipitation increase in the South of Brazil (Grimm et al.,1998; Coelho et al., 2002) and precipitation decrease in the Brazilian Northeast (Rao and Hada, 1990; Moura and Shukla, 1981). Robertson and Mechoso (1998) detected a significant relationship be-tween a quasi-decadal component in the Uruguay and Paran´a rivers flows and variations in the Atlantic SST, beyond of the interannual maximums in the El Ni˜no – Southern
Os-Correspondence to: A. O. Cardoso
cillation (ENSO) time scale. Robertson et al. (2001) ana-lyzed the interannual to decadal predictability of the Paran´a River extracting near-cycling components of the summer river streamflow. They found that the ENSO oscillatory com-ponent was associated with changes in the probability distri-bution of monthly flows and that the decadal modulation of ENSO may be important, although the predictability due to ENSO at interannual lead times is small. The averaged flows observed in the Paran´a River during El Ni˜no events are al-ways larger than those observed during La Ni˜na events (Berri et al., 2002).
The Paran´a River is about 4900 km in length, being the second longest in South America draining all the centre-south of South America. More than 80% of Brazil’s energy is provided from hydropower generation. Decisions relating to energy price and investment planning can be made with greater confidence if reliable forecasts of future volumes of water available for power generation can be calculated. This requires forecasts of future inflows into hydropower reser-voirs. Several studies showed that the SST anomalies in the tropical Pacific can be used to forecast river flow in the North and Northeast regions of Brazil (Hastenrath, 1990) and Ar-gentina (Berri and Flamenco, 1999).
The purpose of the present paper is to investigate the rela-tionships between the Paran´a River flow and the ENSO mode and to develop a statistic model to forecast Paran´a River flow by using the time series of the ENSO mode.
2 Data and methodology
In the work reported here, the data set basis comprise 52 years (1950–2001) of natural flows into the Posadas reser-voir from the Paran´a river (27.36◦S, 55.90◦W) and the cor-responding monthly SST for the Atlantic and Pacific Oceans (denoted by AO and PO, respectively) with spatial resolution of 1◦×1◦ (Reynolds e Smith, 1994). Using the 1◦ resolu-tion SST data, mean SST at 3◦intervals were calculated over ocean blocks. The latitudinal domain is restricted between
190 A. O. Cardoso and P. L. Silva Dias: The relationship between ENSO and Paran´a River flow
8
Figure 1. Isolines of correlations coefficient between monthly natural Paraná River flow and
SST lagged of 1 and 8 month. Shading represents significant correlation. Degrees of freedom
(df) for each correlation is 50. Tabulated values for significant correlation at 5% level (t test)
are 0.231.
Fig. 1. Isolines of correlations coefficient between monthly natural Paran´a River flow and SST lagged of 1 and 8 month. Shading represents
significant correlation. Degrees of freedom (df) for each correlation is 50. Tabulated values for significant correlation at 5% level (t test) are 0.231.
30◦N to 40◦S for both AO and PO; for the AO the lon-gitude range is 60◦W to 20◦E, and for the PO, 150◦E to
70◦W. The annual cycle was removed by subtracting from
each observation (whether monthly flow or SST) the corre-sponding monthly mean and then scaling this difference by the monthly standard deviation. The “Pearson’s r” correla-tion coefficient was determined between the time series of the Paran´a River flow and SST for the PO lagged from one to twelve months.
The principal components analysis (PCA) reduces a data set containing a large number of variables to a data set con-taining fewer new variables, but representing a large frac-tion of the variability contained in original data (Weare and Nasstrom, 1982). The goal of applying PCA to a data set representing spatial and temporal variations is to decompose the original data set in modes represented by spatial patterns, time variation and the explained variance for each mode. PCA was used to reduce the dimensionality of the SST matri-ces and to find the prevailing modes of the ENSO. The physi-cal interpretation of principal components (PC) is limited by the imposed spatial orthogonality of PC patterns (loadings) and the resulting temporal independence of the time coeffi-cients (scores) (Richman, 1986). A rotation of the PC may help overcome this difficulty. The Varimax rotation was per-formed to find a mode characteristic of the ENSO pattern and to compare this PC mode with rotated principal component (RPC) mode, both associated with ENSO.
Canonical correlation analysis (CCA) is a statistical tech-nique that identifies a sequence of pairs of patterns in two data sets (Wilks, 1995). CCA was applied to the PO and AO SST fields to identify the principal canonical mode that shows the coupling of the ENSO pattern with the AO SST. Each canonical mode is expressed with two spatial patterns (canonical maps for each field), two times series (scores for each field) and the correlation between the two times series.
A linear regression model was developed for forecasting the Paran´a River flow from PC, RPC and canonical mode (CM) scores that are associated to modes with ENSO
spa-tial pattern in the tropical PO. Given the real time goal of the forecasting technique (i.e., flow forecast at time t with lag k), the statistical model takes into account data collected at previous times (t −k). However, any forecast model that uses SST data as input may be updating monthly, give that additional SST data as well as monthly flow data become available. This way, updating forecasts of future river flow requires that the SST scores be updated every month, even if the model parameters and modal structure are not. In this work, the first 42 years (504 months) of the full 52-year pe-riod were used to provide initial estimates that were subse-quently updated month by month. The model skill was eval-uated for 10 years of forecasts and the best predictors were identified by the stepwise regression. The parameters calcu-lated to evaluate the model skill are: i) correlation coefficient (r) between the forecast and observed series; ii) square root of the mean squared error (RMSE); iii) mean error (Bias).
3 Results
Lagged correlation coefficients maps between river flow and PO SST’s show significant relationship up to lag 8 (months).The spatial pattern of correlation is similar to the ENSO pattern in the tropical PO (Fig. 1), confirming the ENSO influence in the Paran´a river flow and its potential use as a predictor. Thus, both PCA and CCA were used to find the time variations of the ENSO pattern.
The first and second non-rotated SST PC show a spa-tial pattern similar to the ENSO pattern in the tropical PO (Fig. 2a). The first PC, which accounts for 34% of the to-tal variance of PO SST, shows time fluctuations of low fre-quency with maximum (minimum) in El Ni˜no (La Ni˜na) years (Fig. 2b) and the Ni˜no 3 area is shown to be more im-portant. The second PC explains 11% of the total variance of the data set and presents variations at interannual and in-terdecadal scales (Fig. 2b). The second PC may represent an ENSO phase, similar to the Ni˜no 1 and 2 areas from the point
A. O. Cardoso and P. L. Silva Dias: The relationship between ENSO and Paran´a River flow 191
Fig. 2. (a) Spatial patterns of the first two PC modes of Pacific SST, presented as map correlation. (b) Times series of the first two PC scores.
The times series are smoothed using 13-month running mean and the amplitude is normalized by the standard deviation.
of view of the SST anomalies. This pattern may later tend to the one represented by the first PC which has the largest SST anomalies in the Ni˜no 3 area.
Figure 3a shows the first RPC of SST in the PO, showing a more localized spatial pattern, while the first PC covers al-most all the tropical PO. The time series of the the first PC and the RPC are similar (Fig. 3b). However, after PC rota-tion, just one pattern remained statistically significant, with clear ENSO characteristics.
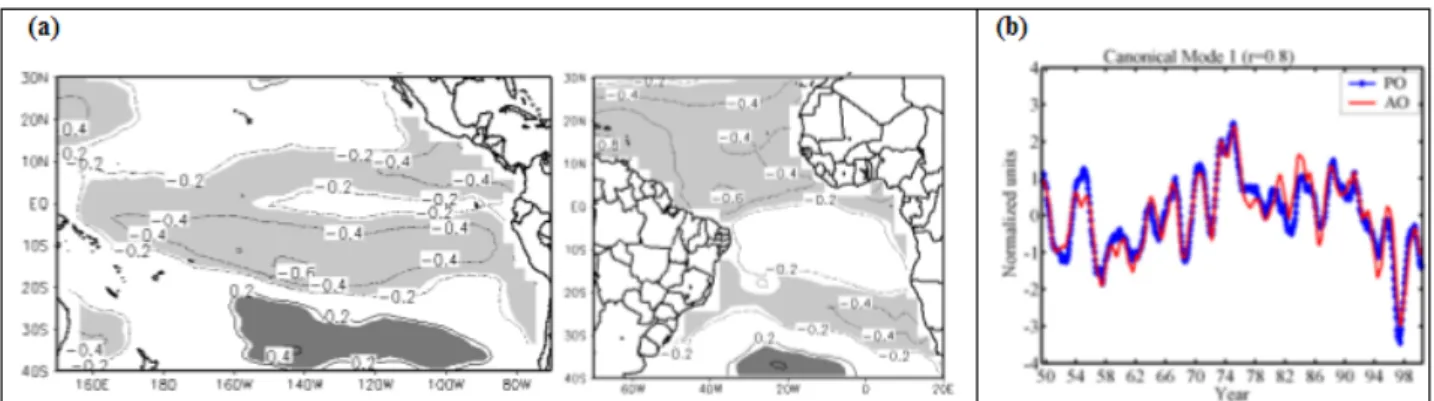
The CCA yields one pair of canonical pattern that shows the coupling of the ENSO pattern with the AO SST. This coupling is presented in the first CM and indicates a posi-tive correlation between SST anomalies in the tropical PO and north tropical AO (Fig. 4a). In the south AO there is a dipole pattern with significant correlation with the ENSO area. The correlation between the two times series associated to the canonical patterns is 0.80 (Fig. 4b).
Linear regressions were calculated between the Paran´a standardized anomaly of the river flow and the times series (scores) from the two first PC, from first RPC and from the first canonical mode. All four scores are associated to ENSO patterns and lagged by up to four months. Thus, the flow forecast was performed up to four lags. The goal is to find the best predictor and to evaluate the relative role of the ENSO pattern as a predictor of the Paran´a river flow.
Table 1. Ordering of best predictors and the values of SSE to each
lag of forecast flow obtained from the first and last forecast (t=505 and t=624, respectively).
Sum of Square Error (SSE) – t=505 Predictor Lag 1 Lag 2 Lag 3 Lag 4 PC 1 450.05 447.60 453.73 457.41 RPC 1 461.15 460.21 464.92 466.95 PC 2 484.64 484.91 484.05 484.24 CM 1 485.33 485.25 485.30 485.47 Sum of Square Error (SSE) – t=624 Predictor Lag 1 Lag 2 Lag 3 Lag 4 PC 1 547.12 543.12 549.20 554.27 RPC 1 563.53 561.77 566.93 570.14 PC 2 598.70 597.62 600.22 601.29 CM 1 603.20 603.24 603.23 603.20
192 A. O. Cardoso and P. L. Silva Dias: The relationship between ENSO and Paran´a River flow
10
Figure 3: (a) Spatial pattern of the first RPC modes of Pacific SST, presented as map
correlation. (b) Time series of RPC scores of the first mode of the Pacific SST. The time
series is smoothed using 13-month running mean, and the amplitude is normalized by the
standard deviation.
Fig. 3. (a) Spatial pattern of the first RPC modes of Pacific SST, presented as map correlation. (b) Time series of RPC scores of the first mode
of the Pacific SST. The time series is smoothed using 13-month running mean, and the amplitude is normalized by the standard deviation.
11
Figure 4: (a) Spatial patterns of the first canonical mode of Pacific and Atlantic SST,
presented as map correlation. (b) Times series of scores of the first canonical mode of the
Pacific and Atlantic SST. The time series is smoothed using 13-month running mean and the
amplitude is normalized by the standard deviation.
Fig. 4. (a) Spatial patterns of the first canonical mode of Pacific and Atlantic SST, presented as map correlation. (b) Times series of scores
of the first canonical mode of the Pacific and Atlantic SST. The time series is smoothed using 13-month running mean and the amplitude is normalized by the standard deviation.
The stepwise regression indicated the score of the first PC as the best predictor to represent the ENSO mode (Fig. 2), up to lag 4. Table 1 shows the order of the better predictors and the sum of square error (SSE) to each lag of forecast flow obtained to the first and last forecast time (t =505 and
t=624, respectively). The best forecast is obtained when the PCA identifies the ENSO pattern. There is a small difference between the SSE of a forecast obtained using the first PC and the first RPC, but this difference is larger when compared with the CM. This result suggests that the ENSO influence on the Paran´a flow is direct and not indirect, through the AO, at least up to four months lag. Another important characteristic of the statistical forecast model is that the SSE is lower at lag 2 indicating thus that the best forecasts can be obtained two months in advance.
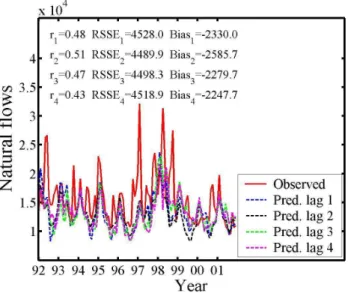
Figure 5 shows forecasts obtained with the regression model defined above, for the verification period (1992 to 2001). This figure shows the observed natural Paran´a inflows (red solid line) together with their predicted values, from one up to four months lag (colored dashed lines). Only the first PC as a predictor is chosen by the stepwise regression. The skill parameters for each lagged forecast are presented in the
top of each map. In agreement with the stepwise regres-sion, the model skill increases to lag two and decreases with increasing lead-time of the forecast. The annual cycle and the low frequency variations are well captured by the ENSO mode. Correlations between the forecast and observed series are significant, indicating that a considerable ratio of flow variance is explained by the ENSO. Figure 5 shows that the positive extreme values of river flow were severely under-estimated at all forecast lags. In some cases the predicted value is less than half the observed value, and the high fre-quency variations in not well reproduced. However, the low frequency tendency is well captured.
4 Conclusions
It has been shown that multivariate analysis, such as PCA and CCA, are useful tools to find spatial and temporal pat-terns that describe the variability of SST anomalies. The ENSO patterns are captured in the first PC and first RPC. The coupling mode between the ENSO pattern and the Atlantic Ocean SST anomalies are also captured in the first mode.
A. O. Cardoso and P. L. Silva Dias: The relationship between ENSO and Paran´a River flow 193
13 Figure 5: Observed and predicted natural Paraná flow, updated monthly, from the scores of the first Principal Components of PO SST. Predictions are made with lead-times of from one to four months.
Fig. 5. Observed and predicted natural Paran´a flow, updated monthly, from the scores of the first Principal Components of PO SST. Predictions are made with lead-times of from one to four months.
The best form to represent the ENSO mode and to use it as a predictor of river flow is by the first PC of the Pacific Ocean SST anomalies, in comparison with RPC and CCA. The better skill of the regression model was reached at lag 2 (i.e. two months in advance). The model skill, based on the evaluation metric (correlation coefficients, square root of the mean squared error and bias) is satisfactory, although ex-treme positive values are not well predicted.
Acknowledgements. The authors acknowledge with gratitude the
support of FAPESP for the Doctoral Project no. 01/00227-8 of the first author, and the technical support of IAG – USP. The IAI-PROSUR also provided support for this research.
Edited by: P. Fabian and J. L. Santos
Reviewed by: J. L. Santos and another anonymous referee
References
Berri, G. J. and Flamenco, E. A.: Seasonal volume forecast of the Diamante River, Argentina, based on El Ni˜no observations and predictions, Water Resour. Res., 35, 12, 3803–3810, 1999. Berri, G. J., Ghietto, M. A., and Garc´ıa, N. O.: The influence of
ENSO in the flows of the Upper Paran´a River of South America over the past 100 years, J. Hydrometeor., 3, 1, 57–65, 2002. Coelho, C. A. S., Uvo, C. B., and Ambrizzi, T.: Exploring the
im-pacts of the tropical Pacific SST on the precipitation patterns over South America during ENSO periods, Theor. Appl. Climatol., 71, 185–197, 2002.
Grimm, A. M., Ferraz, S. T., and Gomes, J.: Precipitaition Anoma-lies in Southern Brazil Associated with El Ni˜no and La Ni˜na Events, J. Climate, 11, 2863–2880, 1998.
Hastenrath, S.: Diagnostics and Prediction of Anomalous River Discharge in Northern South America, J. Climate, 3, 1080–1096, 1990.
Moura, A. D. and Shukla, J.: On the dynamics of droughts in north-east Brazil: observations, theory and numerical experiments with a general circulation model, J. Atmos. Sci., 38, 2653–2675, 1981. Rao, V. B. and Hada, K.: Characteristics of Rainfall over Brazil: Annual Variations and Connections with the Sourthern Oscilla-tions, Theor. Appl. Climatol., 42, 81–91, 1990.
Reynolds, R. W. and Smith, T. M.: Improved global sea surface temperature analysis using optimum interpolation, J. Climate, 7, 929–948, 1994.
Richman, M. B.: Rotation of Principal Components, J. Climatol., 6, 3, 293–335, 1986.
Robertson, A. W. and Mechoso, C. R.: Interannual and decadal cy-cles in river flows of southeastern South America, J. Climate, 11, 10, 2570–2581, 1998.
Robertson, A. W., Mechoso, C. R., and Garcia, N. O.: Interannual prediction of the Parana river, Geophys. Res. Lett., 28, 4235– 4238, 2001.
Weare, B. C. and Nasstrom, J. S.: Examples of Extended Empirical Orthogonal Function Analyses, Mon. Wea. Rev., 110, 481–485, 1982.
Wilks, D. S.: Statistical Methods in the Atmospheric Sciences: an introduction. San Diego. Academic Press, 467 p., 1995.