HAL Id: inserm-02302156
https://www.hal.inserm.fr/inserm-02302156
Submitted on 1 Oct 2019HAL is a multi-disciplinary open access
archive for the deposit and dissemination of sci-entific research documents, whether they are pub-lished or not. The documents may come from teaching and research institutions in France or abroad, or from public or private research centers.
L’archive ouverte pluridisciplinaire HAL, est destinée au dépôt et à la diffusion de documents scientifiques de niveau recherche, publiés ou non, émanant des établissements d’enseignement et de recherche français ou étrangers, des laboratoires publics ou privés.
Estrogen withdrawal and replacement differentially
target liver and adipose tissues in 1 female mice fed a
high-fat high-sucrose diet. Impact of a chronic exposure
to a low-dose 2 pollutant mixture. 3 the French
”Ministère de l’Education
Benoit Julien, Claudie Pinteur, Nathalie Vega, Hubert Vidal, Danielle Naville,
Brigitte Le Magueresse-Battistoni
To cite this version:
Benoit Julien, Claudie Pinteur, Nathalie Vega, Hubert Vidal, Danielle Naville, et al.. Estrogen with-drawal and replacement differentially target liver and adipose tissues in 1 female mice fed a high-fat high-sucrose diet. Impact of a chronic exposure to a low-dose 2 pollutant mixture. 3 the French ”Ministère de l’Education. The Journal of Nutritional Biochemistry, Elsevier, 2019, 72, pp.108211. �10.1016/j.jnutbio.2019.07.002�. �inserm-02302156�
1 Estrogen withdrawal and replacement differentially target liver and adipose tissues in 1
female mice fed a high-fat high-sucrose diet. Impact of a chronic exposure to a low-dose 2
pollutant mixture. 3
Benoit Julien, Claudie Pinteur1, Nathalie Vega1, Hubert Vidal, Danielle Naville and Brigitte 4
Le Magueresse-Battistoni, 5
Affiliations: 6
Univ-Lyon, CarMeN laboratory, INSERM U1060, INRA U1397, Université Claude Bernard 7
Lyon1, INSA Lyon, Charles Mérieux Medical School, F-69600 Oullins, France 8
1
These authors contributed equally 9 10 Corresponding author: 11 Dr. B. Le Magueresse-Battistoni, PhD 12
CarMeN laboratory, INSERM U1060, Faculté de Médecine Lyon-Sud, Chemin du Grand 13
Revoyet, 69600 Oullins, France 14 Phone 33 (0)426235919, Fax 33 (0)426235916 15 E-mail : brigitte.lemagueresse@inserm.fr 16 17
Running title: Metabolic disorders, estrogens and pollutants 18
Funding sources: This research project was supported by INSERM to InsermU1060. Benoit 19
Julien is supported by a research fellowship from the French “Ministère de l’Education 20
Nationale, de l’Enseignement Supérieur et de la Recherche”. The funders had no role in study 21
design, data collection and analysis, decision to publish, or preparation of the manuscript. 22
Key words: high-fat high-sucrose diet; mixture of pollutants; metabolic disorders; 23
ovariectomy; estradiol replacement; 24
2 Abbreviations:
25
ALAT, alanine aminotransferase ; ASAT, aspartate aminotransferase, AUC, area-under-26
curve; BPA, bisphenol A; bw, body weight ; DEHP, diethylhexyl phthalate; DMSO, 27
dimethylsulfoxide; E2, 17β estradiol ; FFA, free fatty acid; GTT, glucose tolerance test; 28
HFHS, high- fat high sucrose; PCB, polychlorinated biphenyl; TCDD, 2,3,7,8-29
tetrachlorodibenzo-p-dioxin; TDI, Tolerable Daily Intake; TG, triglyceride. 30
3 Abstract
32
Post-menopausal women may be at particular risk when exposed to chemicals especially 33
endocrine disruptors because of hormonal deficit. To get more insight, ovariectomized 34
C57Bl6/J mice fed a high-fat high-sucrose diet were chronically exposed from 5 to 20 weeks 35
of age to a low-dose mixture of chemicals with one dioxin, one polychlorobiphenyl, one 36
phthalate and bisphenol A. Part of the mice received as well E2 implants to explore the 37
potential estrogenic dependency of the metabolic alterations. With this model, estrogen loss 38
resulted in glucose but not lipid metabolism impairment and E2 replacement normalized the 39
enhanced body and fat pad weight, and the glucose intolerance and insulin resistance linked to 40
ovariectomy. It also altered cholesterol metabolism in the liver concurrently with enhanced 41
estrogen receptor Esr1 mRNA level. In addition, fat depots responded differently to estrogen 42
withdrawal (e.g., selective mRNA enhancement of adipogenesis markers in subcutaneous and 43
of inflammation in visceral fat pads) and replacement challenges. Importantly, the pollutant 44
mixture impacted lipid deposition and mRNA expression of several genes related to lipid 45
metabolism but not Esr1 in the liver. Adiponectin levels were altered as well. In addition, the 46
mRNA abundance of the various estrogen receptors was regionally impacted in fat tissues. 47
Besides, xenobiotic processing genes did not change in response to the pollutant mixture, in 48
the liver. The present findings bring new light on estrogen-dependent metabolic alterations 49
with regards to situations of loss of estrogens as observed after menopause. 50
51 52
4 Bullet points:
53
Estrogens differentially impacted hepatic glucose and lipid metabolism in female mice 54
Estrogens differentially impacted visceral and subcutaneous fat depots 55
Exposure to pollutants altered lipid deposition in liver and adiponectin levels 56
Pollutants impacted E2-regulated gene mRNA levels in a tissue-dependent manner 57
Mixture contained pollutants at the tolerable daily intake dose 58
59
5 1. Introduction
61
Obesity-related metabolic dysfunctions constitute a major problem in Public Health. Over 62
1.9 billion adults were overweight, of those 650 million were obese in 2016 placing them at 63
high risk for metabolic diseases including type 2 diabetes [1]. Risk of obesity is not equal 64
between males and females. Sex differences appeared as the population aged. In 2005, 16-65
17% of women vs 10-11% of men over 50 were obese [2]. Risk of obesity in females is 66
associated with metabolic changes occurring during the menopausal transition characterized 67
by progressive reduction of ovarian estrogen production. According to different studies, the 68
prevalence of the metabolic syndrome which is a cluster of conditions of dyslipidemia, central 69
adiposity, hypertension, abnormal glucose metabolism and insulin resistance is enhanced 70
among postmenopausal women varying between 30 to 70% compared with 14-45% in 71
younger women[3] delineating the post-menopausal women as a vulnerable population. 72
Metabolic disorders are multifactorial diseases. Besides genetic predispositions and 73
imbalance between energy intake and expenditure, environmental pollutants have been 74
suggested to be etiologic factors as well, based on robust epidemiologic data and experimental 75
studies demonstrating changes in body weight and/or insulin resistance [4-7]. Environmental 76
pollutants may include persistent chemicals which bioaccumulate in the food chain. They are 77
especially present in fatty foods of animal origin (meat, milk, fish) and characterized by half-78
lives of several years in humans, e.g. dioxins and polychlorobiphenyls [8]. Other pollutants 79
may have short half-lives e.g. phthalates and bisphenols. However, as these chemicals are 80
massively used in plastic goods, the leaching from packaging causes contamination resulting 81
in a chronic exposure [9, 10]. Pollutants are under regulation by international risk assessment 82
evaluation bodies (e.g., the European Food Safety Agency, EFSA). However, the cocktail 83
effect resulting from the chronic exposure to a myriad of chemicals originating from different 84
sources (foods and beverages, air breathing, skin absorption of cosmetics) and to which the 85
human population is involuntary exposed is underappreciated [11-13]. Of striking importance 86
are chemicals identified for their ability to interfere with hormonal action, the so-called 87
endocrine disruptors [14]. Populations vulnerable because of hormonal deficits such as post-88
menopausal women may thus be at particular risk when exposed to these chemicals. It has 89
consistently been found that among a population of obese and post-menopausal women, 90
plasma levels of persistent organic pollutants (POPs) were associated with insulin resistance 91
[15]. 92
6 The estrogeno-mimetic properties of endocrine disruptors are of particular concern.
93
Characterizing their mechanisms of actions could help to explain their deleterious impact on 94
the reproductive functions but also on metabolic disorders [10]. Indeed, it has been well 95
demonstrated that estrogens exert protective roles against metabolic diseases in addition to 96
regulating reproductive functions. They are for instance known to positively regulate glucose 97
homeostasis and lipid metabolism favoring insulin sensitivity [5, 16-18]. All these beneficial 98
effects progressively disappear with menopause. Estrogens act through specific receptors 99
distributed centrally and peripherally including ERα, ERβ and the G-protein-coupled receptor 100
GPR30 which differ in abundance and tissue distribution in a sex-dependent manner [16, 19, 101
20]. Non-genomic actions of estrogens as well as cross-talk with various nuclear receptors 102
and/or transcription factors have also been evidenced [21, 22]. All these signaling pathways 103
result in pleiotropic actions of estrogens in the peripherally and metabolically active tissues 104
including the liver and the adipose tissues which express the estrogen receptors. Thus, these 105
signaling pathways are potential targets for endocrine disruptors in a manner dependent on the 106
age, the sex and the tissue considered [4, 23, 24]. 107
We previously demonstrated that a mixture of low-dose pollutants made of dioxin, PCB, 108
phthalate and bisphenol A (BPA) could interfere with estrogen signaling and trigger hepatic 109
insulin resistance and aggravation of glucose intolerance in female mice fed a fat high-110
sucrose diet [25]. In addition, mice fed a standard diet but exposed to the same mixture of 111
pollutants exhibited enhancement of hepatic triglycerides content and insulin resistance [26]. 112
The impact of this pollutant mixture depended on the age of the mice, with differences 113
occurring between mature and immature females [25, 27]. However, the metabolic impact of 114
the mixture of pollutants in conditions of hormonal deficit after ovariectomy to mimic 115
menopause and hormonal replacement using 17β estradiol (E2) pellets implanted 116
subcutaneously, has not yet been explored. The purpose of the current study was to fill this 117
gap. After characterizing the metabolic phenotypes of liver, subcutaneous and visceral 118
adipose tissues in ovariectomized mice, we delineated the estrogenic component using 119
hormonal replacement. 120
121
2. Materials and methods 122
123
2.1. Animals, diets and experimental design
7 A schematic view of the 3 experimental protocols is described in Supplemental Figure 1. 125
C57Bl/6 female mice (4-week-old) were purchased from Envigo laboratories (Gannat, 126
France), housed by 2 in polypropylene cages (to avoid BPA leaching from polycarbonate 127
cages) at 21°C with a normal light-dark cycle and free access to water (polypropylene 128
bottles) and standard chow (LASvendi-16R; Soest, Germany). After one week of 129
acclimatization, mice of the experimental protocol 1 were fed a high fat-high sucrose (HF) 130
diet (from Envigo) containing (HFp) or not (HF0) a mixture of pollutants (see below for 131
the details). At 7 weeks of age, mice were sham-operated (HF0 sham) or underwent a 132
bilateral ovariectomy after general anesthesia, as previously described [28] followed by 133
the implantation, under the neck skin, of Silastic implants filled either with vehicle (HF0 134
Ovx and HFp Ovx) or with 50µg of 17β-estradiol-3-benzoate, E2 (Sigma-Aldrich, Saint-135
Quentin Fallavier, France) in 30µl of sesame oil (HF0 Ovx+E2 and HFp Ovx+E2) as 136
described [29]. The implants were renewed at 13 weeks of age (8 weeks of diet) as the 137
release of E2 was effective only 6 weeks based on body weight follow-up performed in a pilot 138
experiment (data not shown). In the course of the study, two other protocols were 139
conducted to assess the individual effects of the HF diet and of the ovariectomy 140
(Supplemental Figure 1). All procedures were performed with the approval of the 141
Regional Committee of Ethics for Animal Experiments and the French Ministry for 142
Higher Education and Research. Body weight (for all protocols) and food intake (for 143
protocol 1) were recorded weekly throughout the protocol until mice were 20 weeks of 144
age. Validation of the surgery was assessed at the time of mouse euthanasia with the 145
observation of uterine atrophy in the Ovx females (measurement of uterus weight; 146
Supplemental Figure 2). Food intake measured in Protocol 1 did not change between 147
groups, regardless of treatments (data not shown). 148
The pollutant mixture was made of 2,3,7,8-tetrachlorodibenzo-p-dioxin (TCDD, CAS 149
n° 1746-01-6 from LGC-Promochem, Molsheim, France), polychlorinated biphenyl (PCB) 150
153 (CAS n°35065-27-1), bisphenol A (BPA, CAS n°80-05-7) and di-[2-ethylhexyl]-151
phthalate (DEHP, CAS n°117-81-7) (all three from Sigma-Aldrich). Each pollutant was 152
used at a dose close to its tolerable daily intake (TDI) reference dose of either the 153
pollutant itself (DEHP, BPA) or representative congeners (TCDD, PCB153) [25]. 154
Pollutants were dissolved in dimethylsulfoxide (DMSO) and diluted in corn oil to 155
facilitate uniform homogenization in the food and the making of pellets. Pollutant-free 156
diet contained identical volumes of DMSO and corn oil as the pollutant-containing food. 157
8 HF0 and HFp diets contained 63% fat, 23.6% carbohydrate and 13.4% protein in kcal, as 158
detailed previously [26]. To globally ensure the daily exposure to 2pg/kg bw/d of TCDD, 159
80 ng/kg bw/d of PCB153, 50μg/ kg bw/d of DEHP and 5 μg/ kg bw/d of BPA 1 g of 160
contaminated food per 17 g of body weight was given per day to mice otherwise fed ad 161
libitum as previously described [25, 27]. 162
2.2. Metabolic tests
163
After 13 wks of diet, 16 h-fasted mice were injected intraperitoneally with glucose (1 164
mg/g of body weight) for the glucose tolerance test (GTT). Blood glucose was measured 165
using the Accu-Chek Performa glucometer (Roche Diabetes Care France, Meylan). 166
2.3. Body composition, blood and tissue collection
167
One day before euthanasia, weight and whole body composition were analyzed using 168
nuclear magnetic resonance (Minispec TD-NMR, Bruker BioSpin). Following a 6 hour 169
fasting, blood was collected by retro-orbital sampling. Mice were euthanized by cervical 170
dislocation and liver, inguinal subcutaneous (SAT) and visceral (periovarian+parametrial, 171
VAT) adipose tissue were quickly dissected, snap-frozen in nitrogen liquid and conserved 172
at -80°C until experiments. Small pieces of SAT and VAT were fixed in 4% buffered 173
formaldehyde and embedded in paraffin for histology studies. 174
Blood glucose concentrations (Accu-Chek Performa glucometer) as well as plasma 175
levels of insulin (Mouse Ultrasensitive ELISA, Eurobio), triglycerides (Biolabo, Maizy, 176
France), cholesterol, free fatty acids (FFA), alanine aminotransferase (ALAT) and aspartate 177
aminotransferase (ASAT) activities (Sigma-Aldrich), leptin and adiponectin (Crystal 178
Chem, Zaandam, Netherlands) were measured. Total cholesterol and triglycerides were 179
also measured in the liver after extraction of lipids from frozen liver samples using a 180
lipid Extraction kit chloroform-free (Clinisciences, Nanterre, France). 181
Adipose tissue histology
182
Paraffin-embedded adipose tissues were cut and adipocyte area was assessed by 183
immunostaining of the basal membrane realized on 4µm sections using the rabbit anti -184
laminin antibody (1:100, Merck, L9393). Image acquisition was obtained with the 185
AXIOVERT 200 M inversed fluorescent microscopes (Carl Zeiss S.A.S., Marly le Roi, 186
9 France) equipped with the AxioVision 4.8.2 software. Analyses were performed using the 187
ImageJ software. 188
2.4. Real time PCR analysis
189
Total RNA extracted from frozen tissue samples was reverse-transcribed and 190
analyzed by real-time PCR as described [30] using a set of specific primers 191
(Supplemental Table 1). In each tissue data were normalized relatively to TBP (encoding 192
TATA-Box Binding Protein). 193
2.5. Statistical analysis
194
All results are expressed as means ± SEM and differences between means were 195
considered significant at p-value <0.05. To test for statistical significance, one-way 196
ANOVA followed by Tukey post hoc test was used when comparing HF0 sham, HF0 197
Ovx and HF0 Ovx+E2 groups. To test for pollutant effects, two-way ANOVA for non-198
repeated measures with E2 and pollutants as factors was used, followed by a Bonferroni 199
post hoc test. When significant effects without interaction were obtained, differences 200
were tested using Student's t-test between the pollutant-exposed group and the non-201
exposed group. GraphPad Prism 5.0 software was used for all statistical analysis. 202
203
3. Results 204
205
3.1. Metabolic characterization of sham and ovariectomized females fed a HF diet and 206
effect of 17ß estradiol replacement 207
Sham-operated (sham) and ovariectomized (Ovx) females having received E2 or vehicle 208
supplementation, all fed a HF diet were thoroughly characterized (Protocol 1). Non-operated 209
females fed either a standard diet or a HF diet were monitored in parallel (Protocol 3). As 210
expected, females fed the HF diet were significantly heavier than ST fed mice with high 211
levels of blood glucose and plasma insulin levels resulting in a 3-fold increase of the HOMA-212
IR (Fig. 1A-B; Supplemental Figure 3) which is an index of insulin resistance. Ovariectomy 213
induced an additional increase of body weight and fat mass, a hyperglycaemia after a 16h 214
fasting (time 0 of the GTT) with a trend after a 6h fasting (blood sample at euthanasia), and 215
elevated insulin plasma levels, all resulting in glucose intolerance (GTT) and insulin 216
10 resistance (enhanced HOMA-IR) (Fig. 1). Conversely, triglycerides (TG) and cholesterol 217
levels (both plasma and liver) were not significantly impacted by ovariectomy (Table 1). 218
These metabolic features were also observed in Protocol 2 in which ovariectomy was 219
performed in mice fed a standard diet (Supplemental Figure 4). Neither ovariectomy nor E2 220
treatment induced liver toxicity as there was no increase in plasma AST or ALT in HF0 Ovx 221
and HF0 Ovx+E2 mice (data not shown). 222
Estradiol supplementation to HF0 Ovx mice led to a restoration of insulin and FFA plasma 223
levels as well as glucose tolerance to values measured in HF0-sham mice (Fig. 1; Table 1). 224
Other metabolic parameters including glycaemia, body weight, VAT and SAT weight, plasma 225
cholesterol (total and cholesteryl esters) and leptin levels were significantly lower than those 226
measured in HF0 sham mice (Fig. 1 and Table 1). For some parameters, the range of values 227
was identical to those in standard-fed mice (Fig. 1). Besides, impedance analyses revealed 228
enhanced lean mass and reduced fat mass in E2-replaced Ovx mice compared to HF-fed sham 229
mice (Fig. 1D) which is probably associated to the reduced adipocyte diameter observed in 230
both AT depots (Fig. 1D and Supplemental Figure 5) with E2 replacement. Moreover, 231
adiponectin levels, not affected by ovariectomy, were reduced in E2-replaced females (Table 232
1) as reported elsewhere [31]. 233
234
3.2. Fat depots were differently affected in response to ovariectomy and 17ß estradiol 235
supplementation 236
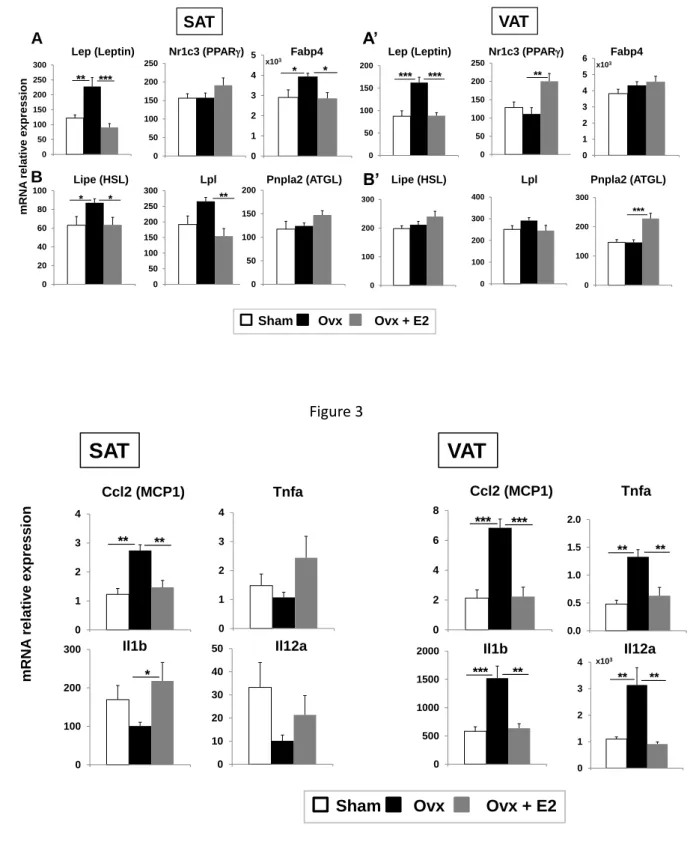
The metabolic explorations showed that the adipose tissue was highly responsive to 237
ovariectomy and E2 replacement consistent with estrogens playing major roles in fat tissue 238
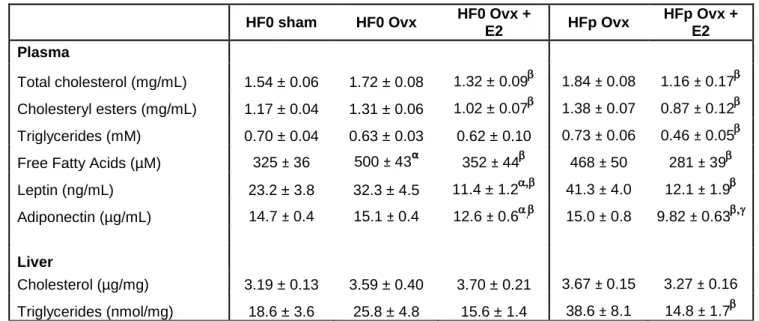
deposition and expansion in females [16, 32]. To go further in-depth, we analyzed by RT-239
qPCR a panel of genes encoding the estrogen receptors and markers of adipogenesis or 240
inflammation. We observed that the expression level of Esr1 and Esr2 genes encoding the 241
nuclear estrogen receptor (ER) α and β, respectively and Gper1 encoding the G protein 242
coupled estrogen receptor 1 (GPR30) responded differently to estrogen withdrawal and 243
replacement. Esr1 mRNA levels were unchanged in Ovx females but significantly increased 244
(2-fold) upon E2 replacement in both SAT and VAT. Gper1 and Esr2 mRNA levels were 245
significantly higher and lower, respectively, in Ovx than in sham females. E2 replacement 246
corrected these effects in SAT but not in VAT (Fig. 2). The pattern of expression of Nr3c4 247
(encoding the androgen receptor) and Esr1 mRNA was quite similar in SAT and VAT (i.e., 248
11 almost no change following ovariectomy and augmentation following E2 replacement relative 249
to sham mice) (Fig 2). Additionally, ten-fold more Esr1 and 1.5-fold more Nr3c4 mRNA 250
levels were found in VAT than in SAT, and 2-fold more Gper1 mRNA levels were found in 251
SAT than in VAT. As for Esr2, mRNA levels were low in both fat pads with large 252
fluctuations in the VAT of sham mice (Fig. 2). 253
Plasma leptin levels of Ovx females (Table 1) which correlated with obesity were consistent 254
with the increase of lep mRNA levels. They returned to sham levels in SAT and VAT of E2-255
treated mice (Fig. 3). A similar pattern of mRNA expression was observed for Ccl2 which 256
encodes the monocyte chemoattractant protein 1 (MCP1) along with estrogen loss and 257
recovery challenges in both fat pads (Fig. 4). Conversely, fluctuations in level of 258
adipogenesis, lipogenesis, lipolysis and inflammation markers were found to vary in fat 259
depots according to body localization i.e., subcutaneous or visceral (Fig. 3, 4). Specifically, 260
we surveyed Nr1c3 encoding peroxisome proliferator-activated receptor PPAR, Fabp4 261
encoding fatty-acid binding protein4, Lipe encoding hormone-sensitive lipase (HSL), Lpl 262
encoding lipoprotein lipase (LPL), Pnpla2 encoding Patatin Like Phospholipase Domain 263
Containing 2 also known as Adipose triglyceride lipase (ATGL) and inflammatory cytokines, 264
Tnfα, Il1β and Il12a encoding tumor necrosis factor (TNF)α and the interleukins 1ß and 12a,
265
respectively. On the one hand, no variations were observed in the level of Nr1c3, Pnpla2, 266
Tnfα and Il12a mRNA in SAT across the groups, while the same genes were up-regulated in
267
VAT in the Ovx group. Specifically, VAT samples from E2-replaced females had higher 268
mRNA levels of Nr1c3 and Pnpla2 than samples from Ovx females which was consistent 269
with PPARγ being a direct transcriptional regulator of ATGL [33] while inflammatory marker 270
mRNA levels increased in Ovx females and returned to sham levels in E2-replaced females 271
(Fig. 3, 4). On the other hand, Fabp4, Lipe and Lpl had a profile of gene expression consistent 272
with estrogens negatively regulating these genes in SAT but not in VAT samples (Fig. 3, 4). 273
Regarding Il1β, the profile was identical to the other inflammatory markers in VAT while the 274
mRNA levels were enhanced following E2 replacement in SAT. 275
276
3.3. Estrogens differentially impact glucose and lipid metabolism in the liver 277
Estrogens act in liver to positively regulate insulin sensitivity and glucose tolerance [16]. ERα 278
being the primary estrogen receptor expressed in mouse liver [34], we explored the hepatic 279
expression of the Esr1 gene in ovariectomized females. We observed a significant decrease 280
12 of Esr1 mRNA levels (Fig. 5A). Interestingly, in E2-replaced Ovx mice a significant doubling 281
in Esr1 mRNA levels was measured compared to those detected in sham mice. We next 282
performed RT-qPCR analyses to discriminate, among genes regulating glucose and lipid 283
metabolism, those under negative and positive estrogen regulation. Consistent with E2 284
positively regulating glucose tolerance, the expression levels of G6pc encoding the catalytic 285
subunit of the gluconeogenic enzyme G6Pase (glucose-6 phosphatase) doubled in Ovx mice 286
and was restored in E2-replaced females, relative to the level of sham mice (Fig. 5B). 287
Expression levels of Gck encoding Glucokinase, mirrored those of G6pc (Fig. 5B) consistent 288
with an adaptive role of Gck in counteracting hyperinsulinemia and insulin resistance and 289
with the reduction of glycaemia [35]. 290
To complete the study and although we did not observe significant changes in hepatic TG and 291
cholesterol levels in ovariectomized mice (Table 1), we undertook a comprehensive analysis 292
of genes encoding proteins involved in hepatic lipid metabolism. Specifically, genes surveyed 293
included Nr1h3 encoding Liver X receptor (LXR)α and its downstream target gene Srebf1 294
encoding sterol regulatory element binding protein 1c (SREBP1c), a master regulator of de 295
novo lipogenesis; Scd1 encoding the stearoyl-CoA desaturase-1 (SCD1), a rate-limiting
296
enzyme of lipogenesis; Dgat2 encoding diacylglycerol O-acyltransferase 2 which catalyzes 297
the final reaction in the synthesis of triglycerides; Cd36 encoding Cluster of differentiation 36 298
involved in fatty acid uptake; Nr1c1encoding peroxisome proliferator-activated receptor 299
(PPAR)α which regulates fatty acid oxidation and its target gene Cpt1a encoding carnitine 300
palmitoyltransferase 1α; Srebf2 which encodes the transcription factor Sterol Regulatory 301
Element Binding Transcription Factor 2 and its downstream target genes Hmgcr and Pcsk9 302
encoding 3-Hydroxy-3-Methylglutaryl-CoA Reductase, the rate limiting enzyme of 303
cholesterol metabolism and Proprotein convertase subtilisin/kexin type 9 which regulates 304
lipoprotein metabolism, respectively. We surveyed Ldlr encoding the low density lipoprotein 305
receptor which mediates the endocytosis of cholesterol-rich LDL; Nr1h4 encoding the bile 306
acid receptor Farnesoid X receptor (FXR), and Cyp7a1 encoding the cholesterol 7α 307
hydroxylase which is the rate-limiting enzyme in the synthesis of bile acids [36]. 308
On this panel of genes, Nr1h4 was unique in that the mRNA level was enhanced by estrogen 309
withdrawal compared to sham mice. There was reduction in mRNA abundance of Srebf1, 310
Dgat2 and Ldlr in the Ovx mice (Fig. 5). All returned to sham levels after E2 replacement.
311
Lower Nr1c1 and Cd36 mRNA levels were found in E2 replaced mice than in sham mice 312
(Fig. 5); mRNA levels of Nr0b2 encoding small heterodimeric partner (SHP) and those of 313
13
Cpt1α, Nr1h3, Scd1 remained the same between the different groups (data not shown). In
314
addition, several genes belonging to the cholesterol metabolism pathway had their mRNA 315
levels strongly increased following E2 supplementation. This included Srebf2 and the target 316
genes Hmgcr, Pcsk9 and Cyp7a1 (Fig. 5E). 317
318
3.4 A low-dose mixture of pollutants differentially impacted the expression levels of E2-319
regulated genes depending on the metabolic tissue explored 320
The expression levels of estrogen receptors and estrogen-regulated genes were analyzed in the 321
liver and adipose tissues of mice exposed to a mixture of low-dose pollutants previously 322
shown to exhibit estrogeno-mimetic activities [25, 27, 28]. 323
Metabolic exploration revealed that exposure to pollutants did not change food intake (not 324
shown), body weight and fat pad weight of the exposed animals (Supplemental Figure 6). No 325
effect of pollutants was observed on blood glucose and plasma insulin levels, HOMA-IR, 326
glucose tolerance, as well as on TG (plasma and hepatic) and FFA levels (Table 1). 327
Notwithstanding, cholesterol (plasma and hepatic) and leptin levels were significantly 328
increased in HFp-Ovx females compared to HF0 sham mice while these parameters were not 329
significantly changed by ovariectomy itself arguing for a pollutant effect. Moreover, liver TG 330
accumulation in HFp Ovx mice was 1.5-fold higher than in HF0 Ovx mice although it did not 331
reach significance. In addition, its level significantly decreased following E2 replacement 332
(HFp Ovx+E2 versus HFp Ovx) which was not observed in pollutant-free conditions (Table 333
1). Adiponectin levels were significantly different in HFp Ovx+E2 versus levels measured in 334
HF0-Ovx+E2 mice which also indicated a pollutant effect (Table 1). 335
Regarding gene expression, exposure to pollutants resulted in the increase of Esr1 mRNA 336
levels in SAT and in the ratio of Esr1 to Nr3c4 expression in SAT and VAT of Ovx mice 337
(Fig. 6). In conditions of E2 supplementation, effects of pollutant exposure included the 338
augmentation of Esr2 mRNA levels in both fat pads as well as Esr1 /Nr3c4 ratio in SAT (HFp 339
Ovx+E2 versus HF0 Ovx+E2) (Fig. 6). Among genes involved in cholesterol metabolism, we 340
observed a significant doubling of Nr1h3, Nr0b2 and Cd36 in pollutant-exposed Ovx mice 341
compared to non-exposed Ovx mice. Interestingly, in E2-replaced females, pollutant exposure 342
triggered significant changes in Cyp7a1 (half-decrease) and Nr1h3 (a doubling) mRNA levels 343
14 (Fig. 6C). These pollutant-induced effects were different than those exerted by E2
344
replacement (Fig.4). 345
To complete the study, we measured the expression levels of genes encoding xenobiotic 346
receptors including the aryl hydrocarbon receptor (AhR), the constitutive androstane receptor 347
CAR (Nr1i3) and the pregnane xenobiotic receptor PXR (Nr1i2) as well as CAR and PXR 348
immediate target genes which encode the cytochrome P450 enzymes CYP2B10 and 349
CYP3A11 [37]. These genes were not found impacted by the pollutant mixture as compared 350
to non-exposed mice except Cyp2b10 which mRNA abundance slightly increased 351 (Supplemental figure 7). 352 353 Discussion 354
In the present study, we developed a model allowing the exploration of the metabolic 355
consequences of ovarian withdrawal and E2 replacement on liver and adipose tissues along 356
with investigating the impact of a low-dose mixture of pollutants previously reported to 357
exhibit some estrogeno-mimetic properties in female mice [25, 27]. Because of differences in 358
the literature regarding the extent of the ovariectomy-induced deleterious metabolic effects, 359
the experimental model developed herein was first characterized. Accordingly [17, 19, 38-40], 360
ovariectomy induced body weight increase, glucose intolerance and insulin resistance and 361
tended toward an increase of leptin and insulin plasma levels. No changes in TG plasma 362
levels and cholesterol or in hepatic lipid deposition could be measured in the ovariectomized 363
mouse model. 364
Importantly, treatment of ovariectomized mice with E2 either reversed the ovariectomy-365
induced adverse effects (e.g., glucose tolerance) to sham levels or improved metabolic 366
functions over the physiological levels (e.g., adipose tissue weight and leptin levels). It 367
suggested that diet-induced obesity could impair estrogenic signaling in the adipose tissues in 368
female mice and that part of the HF effects were counter-balanced by E2 supplementation, 369
extending previous data [31]. Importantly, while ovariectomy and E2 replacement similarly 370
regulated the ERs and AR encoding mRNA expression in SAT and VAT depots, adipogenesis 371
and inflammatory markers were differently regulated in response to estrogen withdrawal and 372
E2 replacement. Specifically, our findings were consistent with estrogens negatively 373
regulating adipogenesis in SAT but not in VAT, and inflammation in VAT but not in SAT. In 374
15 addition, enhanced Nr1c3 and Atgl mRNA expression in VAT, two markers of adipocyte 375
differentiation, suggested a positive effect of E2-treatment on this tissue in Ovx mice. 376
Extending the literature [41, 42], the herein findings underlined distinct functions of SAT and 377
VAT in the development of obesity-induced metabolic disorders in females, with estrogens 378
regulating fat distribution and expansion preferably in subcutaneous depots and opposing 379
inflammation particularly in VAT thus protecting from insulin resistance. Noticeably, the 380
mRNA abundance changes of the estrogen receptors induced by ovariectomy and E2 381
replacement emphasized that, in physiological conditions, circulating estrogens could regulate 382
Gper1 and Esr2 at a transcriptional level. In addition, if considering the reported phenotypes
383
of enhanced adiposity in Esr2-deficient female mice [43] and the protection from diet-induced 384
obesity in Gper1-deficient female mice [44], the alterations (herein observed) of Gper1 and 385
Esr2 expression in the adipose tissues could well be linked to the obesity phenotype of the
386
Ovx mice. The E2 replacement data suggested that the up-regulation of Esr1 and Nr3c4 387
expression in both fat pads and the restored Esr2 and Gper1 mRNA abundance (at least in 388
SAT) could be linked to the observed decreased in adiposity in line with previous data [19, 389
43, 45]. Moreover, the data presented herein indicated that the described estrogen anti-390
inflammatory properties [19, 43] could be mediated through ERß in VAT extending previous 391
reports in female mice [46]. Interestingly, SAT and VAT share identically regulated genes 392
including Ccl2 (in line with previous findings [28] ) and Lep which could be positively 393
regulated by estradiol in adipose tissues via Gper1or negatively via ERß. Such regulations 394
remain to be demonstrated. 395
Within the present study, ovariectomy clearly impacted glucose metabolism but not 396
hepatic steatosis while E2 replacement resulted in altered cholesterol metabolism concurrently 397
with marked changes in liver Esr1, Nr1c1 and Cd36 mRNA abundance linking estrogen 398
signaling to these effects. It could indicate that impairment of glucose metabolism might be an 399
early metabolic consequence of estrogen loss while alteration of lipid metabolism could be 400
indirectly affected. This hypothesis is consistent with the phenotype of hepatosteatosis 401
observed after a long-term ovariectomy [47] but not in the present study. The finding that TG 402
accumulation did not change with ovariectomy is in agreement with the observation that the 403
mRNA levels of FXR, a protein known to oppose hepatic steatosis and hyperlipidemia [48], 404
was increased while the abundance of genes related to lipogenesis (Srebpf1, Dgat2) was 405
reduced. Noticeably, the impairment of cholesterol metabolism observed following E2 406
supplementation extended previous data demonstrating that Esr1 overexpression could trigger 407
16 a loss in the fine tuning of negative feedback regulation of cholesterol synthesis [49].
408
Deregulation of lipid metabolism may as well result from the lack of cycles in E2-replaced 409
females since it has been demonstrated that reproduction and lipid metabolism are tightly 410
coupled in cycling females [47]. Whether changes in the mRNA levels of Esr1, Nr1c1 and of 411
Cd36 in the E2-replaced Ovx mice also resulted from a loss in feed-back regulatory
412
mechanism will await further studies. Collectively, it could be concluded that regulation of 413
glucose metabolism is tightly controlled by estradiol but that lipid metabolism escaped 414
physiological regulatory feedback in E2-treated females. In addition, because ovaries produce 415
progestogens as well as androgens, E2 replacement is not expected to normalize all disorders 416
induced by ovariectomy. 417
The use of a model of estrogen withdrawal and replacement has allowed the 418
identification of a set of estrogen-regulated genes. We expected these genes to exhibit 419
changes in mRNA levels in response to chronic exposure to a mixture of archetypal endocrine 420
disruptors previously identified as bearing some estrogeno-mimetic activities as well as 421
metabolic disrupting effects [25, 27, 50]. Specifically, the protocol used herein was adapted 422
from the published previous model [25, 26] except that female mice were not exposed to the 423
mixture of pollutants from fetal life onwards but continuously from week 5 to week 20 424
through diet. As reviewed previously [7, 51, 52], the mixture of pollutants was designed to 425
question the metabolic health consequences of a multi-exposure scenario to various pollutants 426
at low dosage to approach a real life situation. Specifically, the mixture was made of shortly 427
metabolized (BPA, DEHP) and persistent pollutants (TCDD, PCB153) contaminating food 428
either through bioaccumulation along the food chain (TCDD, PCB153) or leaching from 429
packaging (BPA, DEHP), activating a wide range of signaling molecules, not to mention the 430
many cross-talks occurring between them and triggering estrogeno-mimetic and anti-androgen 431
activities among others [4, 6, 10]. Pollutants constituent parts of the mixture were also chosen 432
because of high concern for links with metabolic diseases in epidemiological and 433
experimental studies [4, 7, 53-55]. Interestingly, we herein observed modest but significant 434
effects in the set-up model of Ovx and E2 replacement in response to the mixture of 435
pollutants. Phenotypically, and in agreement with our previous studies [25, 27, 50], the 436
mixture did not impact body weight. No changes were observed in glucose tolerance or 437
insulin resistance in the mice exposed compared to those not exposed to the pollutant mixture. 438
Nonetheless, adiponectin levels were found to be lower in E2-replaced and pollutant-exposed 439
mice than in E2-replaced and non-exposed females. This finding is indicative of an adverse 440
17 hormonal and metabolic effect triggered by pollutant exposure since adiponectin is an
441
adipokine with positive metabolic properties [56]. In addition, TG accumulation in liver of 442
HFp Ovx mice was trending upward compared to non-exposed Ovx mice. Some genes 443
involved in lipid metabolism in the liver and which mRNA levels were not modified by 444
ovariectomy, were found impacted in response to the mixture of pollutants in Ovx mice (i.e., 445
HFp Ovx versus HF0 Ovx mice). All these findings indicated that the mixture of pollutants 446
had some metabolic impact but did not exert estrogeno-mimetic activities at least on the set of 447
hepatic genes studied. These data do not fully reproduce previous findings in which the same 448
mixture of pollutants was found to enhance Esr1 gene expression in the liver of 449
ovariectomized females and alleviate glucose intolerance [28]. One possible explanation 450
resides in the timing of exposure to the mixture encompassing gestation and lactation in the 451
previous protocol [28] but not in the present study. Indeed, the maternal period has been 452
found to be a highly vulnerable period [57, 58]. For example, it was demonstrated that hepatic 453
metabolic gene expression in adult mice including Esr1 was strongly impacted in mice 454
exposed in utero to BPA as compared to control mice [59]. In addition, the vulnerability of 455
the fetal period towards exposure to the presently used mixture of pollutants has been 456
evidenced in male mice [50]. 457
Importantly, we observed that the response to the mixture of pollutants was highly 458
tissue-dependent extending our previous data [26, 50]. While we did not identify estrogeno-459
mimetic activities of the pollutant mixture in the liver, the situation was clearly distinct in 460
SAT. Indeed, the estrogen receptors Esr1 and Esr2 were found regulated the same way by 461
either the pollutant mixture or E2 supplementation. Conversely, the mixture of pollutants 462
tended to oppose E2 effects in VAT with an up-regulation of Esr2 and Il12a mRNA 463
abundance in E2-replaced mice. The meaning of these distinct effects depending on fat 464
depots, remains to be investigated but may be linked to the distinct functions of the fat depots 465
regarding adipogenesis and inflammation [41, 42]. In addition, it should be reminded that the 466
dosage of the mixture was based on the tolerable daily intake (TDI) doses defined empirically 467
by risk assessment agencies, e.g., the European Food Safety Authority (EFSA) or the U.S. 468
Food and Drug administration (FDA) [60], thus not expected individually to generate a 469
metabolic effect. Therefore, the herein demonstration that several genes were impacted (at 470
least at the mRNA level) by a mixture of low-dose pollutants together with previous data on 471
the adverse metabolic effects of low-dosed mixture [52], emphasizes that current legislation 472
on chemical risk assessment may underestimate the risk and should be updated. 473
18 In summary,analysis of female mice in conditions of withdrawal of estrogen, E2 replacement 474
or exposure to a mixture of pollutants with reported estrogeno-mimetic activities, extended 475
knowledge on the estrogenic regulation of glucose and lipid metabolism in the liver and of 476
adipogenesis and inflammatory markers in the fat depots. Importantly, this model highlighted 477
that the disrupting effect of the mixture of low-dosed pollutants which did not affect body 478
weight, glycaemia, plasma insulin and lipidemia was different in the liver and adipose tissues. 479
Noticeably, alterations concerned adiponectin plasma levels, estrogen receptors in the adipose 480
tissue and lipid metabolism in the liver. The present findings may have important implications 481
for the understanding of the estrogen-dependent metabolic alterations with regards to 482
situations of loss of estrogens as observed with menopause, especially if considering the 483
worldwide context of exposure to chemicals. 484
19 References
486
[1] WHO. Obesity and overweight. 2018;http://www.who.int/mediacentre/factsheets/fs311/en/. 487
[2] Kelly T, Yang W, Chen CS, Reynolds K, He J. Global burden of obesity in 2005 and projections to 488
2030. Int J Obes (Lond). 2008;32:1431-7. 489
[3] Stefanska A, Bergmann K, Sypniewska G. Metabolic Syndrome and Menopause: Pathophysiology, 490
Clinical and Diagnostic Significance. Advances in clinical chemistry. 2015;72:1-75. 491
[4] Casals-Casas C, Desvergne B. Endocrine disruptors: from endocrine to metabolic disruption. 492
Annual review of physiology. 2011;73:135-62. 493
[5] Nadal A, Quesada I, Tuduri E, Nogueiras R, Alonso-Magdalena P. Endocrine-disrupting chemicals 494
and the regulation of energy balance. Nature reviews Endocrinology. 2017;13:536-46. 495
[6] Thayer KA, Heindel JJ, Bucher JR, Gallo MA. Role of environmental chemicals in diabetes and 496
obesity: a National Toxicology Program workshop review. Environmental health perspectives. 497
2012;120:779-89. 498
[7] Le Magueresse-Battistoni B, Labaronne E, Vidal H, Naville D. Endocrine disrupting chemicals in 499
mixture and obesity, diabetes and related metabolic disorders. World J Biol Chem. 2017;8:108-19. 500
[8] Schafer KS, Kegley SE. Persistent toxic chemicals in the US food supply. Journal of epidemiology 501
and community health. 2002;56:813-7. 502
[9] Muncke J. Exposure to endocrine disrupting compounds via the food chain: Is packaging a 503
relevant source? The Science of the total environment. 2009;407:4549-59. 504
[10] Vandenberg LN, Colborn T, Hayes TB, Heindel JJ, Jacobs DR, Jr., Lee DH, et al. Hormones and 505
endocrine-disrupting chemicals: low-dose effects and nonmonotonic dose responses. Endocrine 506
reviews. 2012;33:378-455. 507
[11] Kortenkamp A. Low dose mixture effects of endocrine disrupters and their implications for 508
regulatory thresholds in chemical risk assessment. Current opinion in pharmacology. 2014;19:105-11. 509
[12] Svingen T, Vinggaard AM. The risk of chemical cocktail effects and how to deal with the issue. 510
Journal of epidemiology and community health. 2016;70:322-3. 511
[13] Le Magueresse-Battistoni B, Vidal H, Naville D. Sex-specific metabolic alterations induced by 512
environmental pollutants. Current Opinion in Toxicology. 2018;8 1-7 513
http://www.hal.inserm.fr/inserm-01743795. 514
[14] Zoeller RT, Bergman A, Becher G, Bjerregaard P, Bornman R, Brandt I, et al. A path forward in the 515
debate over health impacts of endocrine disrupting chemicals. Environ Health. 2014;13:118. 516
[15] Gauthier MS, Rabasa-Lhoret R, Prud'homme D, Karelis AD, Geng D, van Bavel B, et al. The 517
metabolically healthy but obese phenotype is associated with lower plasma levels of persistent 518
organic pollutants as compared to the metabolically abnormal obese phenotype. The Journal of 519
clinical endocrinology and metabolism. 2014;99:E1061-6. 520
[16] Mauvais-Jarvis F, Clegg DJ, Hevener AL. The role of estrogens in control of energy balance and 521
glucose homeostasis. Endocrine reviews. 2013;34:309-38. 522
[17] Riant E, Waget A, Cogo H, Arnal JF, Burcelin R, Gourdy P. Estrogens protect against high-fat diet-523
induced insulin resistance and glucose intolerance in mice. Endocrinology. 2009;150:2109-17. 524
[18] Zhu L, Brown WC, Cai Q, Krust A, Chambon P, McGuinness OP, et al. Estrogen treatment after 525
ovariectomy protects against fatty liver and may improve pathway-selective insulin resistance. 526
Diabetes. 2013;62:424-34. 527
[19] Barros RP, Machado UF, Gustafsson JA. Estrogen receptors: new players in diabetes mellitus. 528
Trends in molecular medicine. 2006;12:425-31. 529
[20] Sharma G, Prossnitz ER. G-Protein-Coupled Estrogen Receptor (GPER) and Sex-Specific Metabolic 530
Homeostasis. Advances in experimental medicine and biology. 2017;1043:427-53. 531
[21] Maggi A, Della Torre S. Sex, metabolism and health. Molecular metabolism. 2018;15:3-7. 532
[22] Matthews J, Gustafsson JA. Estrogen receptor and aryl hydrocarbon receptor signaling pathways. 533
Nuclear receptor signaling. 2006;4:e016. 534
20 [23] Diamanti-Kandarakis E, Bourguignon JP, Giudice LC, Hauser R, Prins GS, Soto AM, et al.
535
Endocrine-disrupting chemicals: an Endocrine Society scientific statement. Endocrine reviews. 536
2009;30:293-342. 537
[24] Swanson HI, Wada T, Xie W, Renga B, Zampella A, Distrutti E, et al. Role of nuclear receptors in 538
lipid dysfunction and obesity-related diseases. Drug metabolism and disposition: the biological fate 539
of chemicals. 2013;41:1-11. 540
[25] Naville D, Pinteur C, Vega N, Menade Y, Vigier M, Le Bourdais A, et al. Low-dose food 541
contaminants trigger sex-specific, hepatic metabolic changes in the progeny of obese mice. FASEB 542
journal : official publication of the Federation of American Societies for Experimental Biology. 543
2013;27:3860-70. 544
[26] Labaronne E, Pinteur C, Vega N, Pesenti S, Julien B, Meugnier-Fouilloux E, et al. Low-dose 545
pollutant mixture triggers metabolic disturbances in female mice leading to common and specific 546
features as compared to a high-fat diet. The Journal of nutritional biochemistry. 2017;45:83-93. 547
[27] Naville D, Labaronne E, Vega N, Pinteur C, Canet-Soulas E, Vidal H, et al. Metabolic outcome of 548
female mice exposed to a mixture of low-dose pollutants in a diet-induced obesity model. PloS one. 549
2015;10:e0124015. 550
[28] Julien B, Pinteur C, Vega N, Labaronne E, Vidal H, Naville D, et al. Evidence for estrogeno-mimetic 551
effects of a mixture of low-dose pollutants in a model of ovariectomized mice. Environmental 552
toxicology and pharmacology. 2018;57:34-40. 553
[29] Raskin K, de Gendt K, Duittoz A, Liere P, Verhoeven G, Tronche F, et al. Conditional inactivation 554
of androgen receptor gene in the nervous system: effects on male behavioral and neuroendocrine 555
responses. The Journal of neuroscience : the official journal of the Society for Neuroscience. 556
2009;29:4461-70. 557
[30] Naville D, Rebourcet D, Chauvin MA, Vega N, Jalabert A, Vigier M, et al. Direct and indirect 558
impact of 2,3,7,8-tetrachlorodibenzo-p-dioxin (TCDD) on adult mouse Leydig cells: an in vitro study. 559
Toxicology letters. 2011;207:251-7. 560
[31] Bryzgalova G, Lundholm L, Portwood N, Gustafsson JA, Khan A, Efendic S, et al. Mechanisms of 561
antidiabetogenic and body weight-lowering effects of estrogen in high-fat diet-fed mice. American 562
journal of physiology Endocrinology and metabolism. 2008;295:E904-12. 563
[32] Jia M, Dahlman-Wright K, Gustafsson JA. Estrogen receptor alpha and beta in health and disease. 564
Best practice & research Clinical endocrinology & metabolism. 2015;29:557-68. 565
[33] Kershaw EE, Schupp M, Guan HP, Gardner NP, Lazar MA, Flier JS. PPARgamma regulates adipose 566
triglyceride lipase in adipocytes in vitro and in vivo. American journal of physiology Endocrinology 567
and metabolism. 2007;293:E1736-45. 568
[34] Gao H, Falt S, Sandelin A, Gustafsson JA, Dahlman-Wright K. Genome-wide identification of 569
estrogen receptor alpha-binding sites in mouse liver. Molecular endocrinology (Baltimore, Md. 570
2008;22:10-22. 571
[35] Winzell MS, Coghlan M, Leighton B, Frangioudakis G, Smith DM, Storlien LH, et al. Chronic 572
glucokinase activation reduces glycaemia and improves glucose tolerance in high-fat diet fed mice. 573
European journal of pharmacology. 2011;663:80-6. 574
[36] Wagner M, Zollner G, Trauner M. Nuclear receptors in liver disease. Hepatology (Baltimore, Md. 575
2011;53:1023-34. 576
[37] Aleksunes LM, Klaassen CD. Coordinated regulation of hepatic phase I and II drug-metabolizing 577
genes and transporters using AhR-, CAR-, PXR-, PPARalpha-, and Nrf2-null mice. Drug metabolism and 578
disposition: the biological fate of chemicals. 2012;40:1366-79. 579
[38] Camporez JP, Jornayvaz FR, Lee HY, Kanda S, Guigni BA, Kahn M, et al. Cellular mechanism by 580
which estradiol protects female ovariectomized mice from high-fat diet-induced hepatic and muscle 581
insulin resistance. Endocrinology. 2013;154:1021-8. 582
[39] Lavoie JM. Dynamics of hepatic and intestinal cholesterol and bile acid pathways: The impact of 583
the animal model of estrogen deficiency and exercise training. World journal of hepatology. 584
2016;8:961-75. 585
21 [40] Mauvais-Jarvis F, Manson JE, Stevenson JC, Fonseca VA. Menopausal Hormone Therapy and 586
Type 2 Diabetes Prevention: Evidence, Mechanisms, and Clinical Implications. Endocrine reviews. 587
2017;38:173-88. 588
[41] Maury E, Brichard SM. Adipokine dysregulation, adipose tissue inflammation and metabolic 589
syndrome. Molecular and cellular endocrinology. 2010;314:1-16. 590
[42] Frank AP, de Souza Santos R, Palmer BF, Clegg DJ. Determinants of body fat distribution in 591
humans may provide insight about obesity-related health risks. Journal of lipid research. 2018. 592
[43] Foryst-Ludwig A, Kintscher U. Metabolic impact of estrogen signalling through ERalpha and 593
ERbeta. The Journal of steroid biochemistry and molecular biology. 2010;122:74-81. 594
[44] Wang A, Luo J, Moore W, Alkhalidy H, Wu L, Zhang J, et al. GPR30 regulates diet-induced 595
adiposity in female mice and adipogenesis in vitro. Scientific reports. 2016;6:34302. 596
[45] Fagman JB, Wilhelmson AS, Motta BM, Pirazzi C, Alexanderson C, De Gendt K, et al. The 597
androgen receptor confers protection against diet-induced atherosclerosis, obesity, and dyslipidemia 598
in female mice. FASEB journal : official publication of the Federation of American Societies for 599
Experimental Biology. 2015;29:1540-50. 600
[46] Davis KE, Neinast MD, Sun K, Skiles WM, Bills JD, Zehr JA, et al. The sexually dimorphic role of 601
adipose and adipocyte estrogen receptors in modulating adipose tissue expansion, inflammation, 602
and fibrosis. Molecular metabolism. 2013;2:227-42. 603
[47] Villa A, Della Torre S, Stell A, Cook J, Brown M, Maggi A. Tetradian oscillation of estrogen 604
receptor alpha is necessary to prevent liver lipid deposition. Proceedings of the National Academy of 605
Sciences of the United States of America. 2012;109:11806-11. 606
[48] Cave MC, Clair HB, Hardesty JE, Falkner KC, Feng W, Clark BJ, et al. Nuclear receptors and 607
nonalcoholic fatty liver disease. Biochimica et biophysica acta. 2016;1859:1083-99. 608
[49] Wang HH, Afdhal NH, Wang DQ. Overexpression of estrogen receptor alpha increases hepatic 609
cholesterogenesis, leading to biliary hypersecretion in mice. Journal of lipid research. 2006;47:778-610
86. 611
[50] Naville D, Gaillard G, Julien B, Vega N, Pinteur C, Chanon S, et al. Chronic exposure to a pollutant 612
mixture at low doses led to tissue-specific metabolic alterations in male mice fed standard and high-613
fat high-sucrose diet. Chemosphere. 2019;220:1187-99. 614
[51] Le Magueresse-Battistoni B, Vidal H, Naville D. Lifelong consumption of low-dosed food 615
pollutants and metabolic health. Journal of epidemiology and community health. 2015;69:512-5. 616
[52] Le Magueresse-Battistoni B, Vidal H, Naville D. Environmental Pollutants and Metabolic 617
Disorders: The Multi-Exposure Scenario of Life. Frontiers in endocrinology. 2018;9:582. 618
[53] Gore AC, Chappell VA, Fenton SE, Flaws JA, Nadal A, Prins GS, et al. EDC-2: The Endocrine 619
Society's Second Scientific Statement on Endocrine-Disrupting Chemicals. Endocrine reviews. 620
2015;36:E1-E150. 621
[54] Alonso-Magdalena P, Quesada I, Nadal A. Endocrine disruptors in the etiology of type 2 diabetes 622
mellitus. Nature reviews Endocrinology. 2011;7:346-53. 623
[55] Heindel JJ, Blumberg B, Cave M, Machtinger R, Mantovani A, Mendez MA, et al. Metabolism 624
disrupting chemicals and metabolic disorders. Reprod Toxicol. 2017;68:3-33. 625
[56] Turer AT, Scherer PE. Adiponectin: mechanistic insights and clinical implications. Diabetologia. 626
2012;55:2319-26. 627
[57] Barker DJ, Eriksson JG, Forsen T, Osmond C. Fetal origins of adult disease: strength of effects and 628
biological basis. International journal of epidemiology. 2002;31:1235-9. 629
[58] Barouki R, Gluckman PD, Grandjean P, Hanson M, Heindel JJ. Developmental origins of non-630
communicable disease: implications for research and public health. Environ Health. 2012;11:42. 631
[59] Ilagan Y, Mamillapalli R, Goetz LG, Kayani J, Taylor HS. Bisphenol-A exposure in utero programs a 632
sexually dimorphic estrogenic state of hepatic metabolic gene expression. Reprod Toxicol. 633
2017;71:84-94. 634
[60] Dorne JL. Metabolism, variability and risk assessment. Toxicology. 2010;268:156-64. 635
22 637
Acknowledgments 638
We gratefully acknowledge Emmanuelle Loizon for technical help with PCR primers, Patrick 639
Manas for animal care, Véronique Coxam and Patrice Lebecque for ovariectomy training 640
and Sakina Mhaouty-Kodja for providing us with the E2 pellets. The authors wish to thank Dr 641
Alexandrine Derrien-Colemyn for critically reading the manuscript. 642
Conflict of interest 643
The authors have declared that no competing interests exist. 644
645 646
23
Legends
647
Figure 1: (A) Body weight and weight of visceral and subcutaneous adipose tissues (VAT 648
and SAT, respectively) measured at the end of the protocols (after 6 h of fasting). (B) 649
Biochemical parameters: Blood glucose, plasma insulin and HOMA-IR. (C) Glucose 650
Tolerance test performed after 13 wks of diet and corresponding AUC. (D) Measurement of 651
whole body composition by NMR and of the adipocyte area. 652
Values are means ± SEM with n=7-8. ***P<0.001; ** P<0.01; *P<0.05 (one-way ANOVA 653
followed by Tukey post hoc test). For the adipocyte area, values are means ± SEM with n=3. 654
A significant overall effect was obtained using a Two-way ANOVA followed by the 655
Bonferroni test. Standard: standard diet; HF0: pollutant-free high-fat high-sucrose diet; Sham: 656
sham-operated mice; Ovx: ovariectomized mice; Ovx+E2: ovariectomized mice with E2 657
replacement. 658
Figure 2: Effect of ovariectomy alone (Ovx) or with 17β-estradiol (E2) supplementation 659
(Ovx+E2) on the expression of genes encoding the estrogen receptors ERα, ERβ, GPR30 and 660
the androgen receptor AR in subcutaneous (A) and visceral (B) adipose tissues (SAT and 661
VAT, respectively). Values are means ± SEM with n=6-8. ***P<0.001; ** P<0.01; *P<0.05. 662
Sham: sham -operated mice. 663
Figure 3: Effect of ovariectomy alone (Ovx) or with 17β-estradiol (E2) supplementation 664
(Ovx+E2) on the expression of genes related to adipogenesis and lipogenesis (A, A’), 665
lipolysis (B, B’) in subcutaneous (SAT, A, B) and visceral (VAT A’, B’) adipose tissues. 666
Values are means ± SEM with n=6-8. ***P<0.001; ** P<0.01; *P<0.0; Sham: sham-operated 667
mice. 668
Figure 4: Effect of ovariectomy alone (Ovx) or with 17β-estradiol (E2) supplementation 669
(Ovx+E2) on the expression of genes encoding inflammatory markers in subcutaneous (SAT) 670
and visceral (VAT) adipose tissues.Values are means ± SEM with n=6-8. ***P<0.001; ** 671
P<0.01; *P<0.0. Sham: sham-operated mice. 672
Figure 5: Effect of ovariectomy alone (Ovx) or with 17β-estradiol (E2) supplementation 673
(Ovx+E2) on the expression of genes encoding the nuclear estrogen receptor ERα (A), genes 674
related to glucose metabolism (B), fatty acid metabolism (C), triglyceride metabolism (D), 675
cholesterol metabolism (E) in liver. Values are means ± SEM with n=6-8. ***P<0.001; ** 676
P<0.01; *P<0.05. Sham: sham-operated mice. 677
Figure 6: Effect of the the mixture of pollutants on the expression of genes expressed in 678
subcutaneous (SAT, A), visceral (VAT, B) adipose tissues, or liver (C). Values (expressed as 679
fold-change relative to the HF0 group) are means ± SEM with n=6-8. ***P<0.001; ** 680
P<0.01; *P<0.05. Ovx: ovariectomized mice; Ovx+E2: ovariectomized mice with E2 681
replacement. HF0: pollutant-free high-fat high-sucrose diet; HFp: high-fat high-sucrose diet 682
containing the mixture of pollutants. 683
684 685 686 687
24 688
Table 1: Biochemical parameters 689
HF0 sham HF0 Ovx HF0 Ovx +
E2 HFp Ovx HFp Ovx + E2 Plasma Total cholesterol (mg/mL) 1.54 ± 0.06 1.72 ± 0.08 1.32 ± 0.09 1.84 ± 0.08 1.16 ± 0.17 Cholesteryl esters (mg/mL) 1.17 ± 0.04 1.31 ± 0.06 1.02 ± 0.07 1.38 ± 0.07 0.87 ± 0.12 Triglycerides (mM) 0.70 ± 0.04 0.63 ± 0.03 0.62 ± 0.10 0.73 ± 0.06 0.46 ± 0.05 Free Fatty Acids (µM) 325 ± 36 500 ± 43α 352 ± 44 468 ± 50 281 ± 39 Leptin (ng/mL) 23.2 ± 3.8 32.3 ± 4.5 11.4 ± 1.2 41.3 ± 4.0 12.1 ± 1.9 Adiponectin (µg/mL) 14.7 ± 0.4 15.1 ± 0.4 12.6 ± 0.6, 15.0 ± 0.8 9.82 ± 0.63 Liver Cholesterol (µg/mg) 3.19 ± 0.13 3.59 ± 0.40 3.70 ± 0.21 3.67 ± 0.15 3.27 ± 0.16 Triglycerides (nmol/mg) 18.6 ± 3.6 25.8 ± 4.8 15.6 ± 1.4 38.6 ± 8.1 14.8 ± 1.7 690
Values are means ± SEM with n=6-8. (α): significant effect vs HF0 sham; (β) significant E2 effect; 691
(γ) significant pollutant effect(using a one-way ANOVA followed by Tukey post hoc test). 692
HF0: pollutant-free high-fat high-sucrose diet; HFp: high-fat high-sucrose diet containing the 693
mixture of pollutants; Sham: sham-operated mice; Ovx: ovariectomized mice; Ovx+E2: 694
ovariectomized mice with E2 replacement. 695
25 696 0 10 20 30 40
Standard HF0 sham Ovx Ovx+E2 HF0 B o d y w ei g h t (g ) *** * *** 0 5 10 15 20 25 0 15 30 45 60 75 90 B lo o d g lu co se (mM ) A
Body weight VAT weight SAT weight
0 2 4 6 8 10
Standard HF0 sham Ovx Ovx+E2 HF0 B lo o d g lu co se (mM ) * *** *
Blood glucose Plasma insulin HOMA-IR
B 0 400 800 1200 1600 2000 2400 2800
Standard HF0 sham Ovx Ovx+E2 HF0 p g A T (mg ) *** *** * *** 0 500 1000 1500 2000 2500 3000 3500
Standard HF0 sham Ovx Ovx+E2 HF0 scA T (mg) *** *** *** * 0.0 0.2 0.4 0.6 0.8 1.0 1.2
Standard HF0 sham Ovx Ovx+E2 HF0 Pl asma in su li n (n g /ml ) * *
% Fat mass lean/fat ratio Adipocyte area
C 0 10 20 30 40 50 60 70
(HF0) sham Ovx Ovx+E2
F at mass (% b o d y w ei g h t) ***** *** 0.0 0.5 1.0 1.5 2.0 2.5 3.0 3.5 *** ***
(HF0) sham Ovx Ovx+E2
(lea n ma s s ) vs (f a t ma s s ) ra tio 0 2 4 6 8 10 12
Standard HF0 sham Ovx Ovx+E2 HF0 * ** H OM A -IR * GTT AUC (GTT)Standard HF0 sham HF0 OVX+V HF0 OVX+E2 D 0 1000 2000 3000 4000 5000 Ovx Ovx + E2 SAT VAT (HF0) A d ip o c y te ar ea (µ m 2) *
Figure 1
0 300 600 900 1200 1500 1800 A U C g lu co se (mM *90mi n )Standard sham Ovx Ovx+E2 HF0
26 697 0.0 0.2 0.4 0.6 0.8 1.0 15 20 25 ** A. 0 20 40 60 80 *** SAT mRN A re la tiv e e x pre s s ion 0 50 100 150 200 250 * * B. VAT mRN A re la tiv e e x pre s s ion 0 150 300 450 600 750 *** 0 30 60 90 120 *
Sham Ovx Ovx + E2
Esr1 (ERα) Esr2 (ERβ) Gper1 (GPR30) Nr3c4 (AR)
Esr1 (ERα) ) Esr2 (ERβ) Gper1 (GPR30) Nr3c4 (AR) 0.0 0.2 0.4 0.6 0.8 1.0 1.2 1.4 * 0 20 40 60 80 100 120 140 160 * 0 50 100 150 200 250 * ***
Figure 2
27 698 699 0 50 100 150 200 250 300 ** 0 1 2 3 4 5 * * x103 0 50 100 150 200 250 300 ** *** 0 50 100 150 200 *** *** 0 50 100 150 200 250 0 50 100 150 200 250 ** 0 20 40 60 80 100 * * mRN A re la tiv e e x pre s s ion SAT VAT
Lep (Leptin) Nr1c3 (PPAR) Fabp4
0 50 100 150 200 0 1 2 3 4 5 6 x10³
Lipe (HSL) Lpl Pnpla2 (ATGL)
0 100 200 300 0 100 200 300 400 A B 0 100 200 300 *** A’ B’
Sham Ovx Ovx + E2
Lipe (HSL) Lpl Pnpla2 (ATGL)
Lep (Leptin) Nr1c3 (PPAR) Fabp4
Figure 3 0 500 1000 1500 2000 ** *** 0 2 4 6 8 *** *** 0.0 0.5 1.0 1.5 2.0 ** ** mRN A re la tiv e e x pre s s ion
SAT
VAT
0 1 2 3 4 ** ** 0 1 2 3 4 Ccl2 (MCP1) Tnfa 0 10 20 30 40 50 Ccl2 (MCP1) Tnfa 0 1 2 3 4 ** ** x103 Il1b Il12aSham Ovx Ovx + E2
0 100 200 300 * Il1b Il12a
Figure 4
28 700 0 20 40 60 80 100 ** *** 0 100 200 300 400 500 ** ** 0 50 100 150 200 250 300 * *** Nr1c1 (PPARα) Esr1 (ERα) G6pc Gck
A
B
C
0 25 50 75 100 125 * 0 30 60 90 * 0 50 100 150 200 * ** 0 3 6 9 12 *** Srebf1 (SREBP1c) Dgat2 Cd36D
0 3 6 9 12 15 * 0 50 100 150 200 250 300 * ** 0 200 400 600 800 1000 * 0 20 40 60 80 x103 *** 0 2 4 6 8 *** Srebf2 (SREBP2) Hmgcr Pcsk9E
0 50 100 150 200 250 300 350 * ** Ldlr Cyp7a1 Nr1h4 (FXR) m RN A re la tiv e e x pre s s ionSham Ovx Ovx + E2