Cognitive and communicative pressures in natural
language
by
MASSKyle Mahowald
L
A.B., Harvard University (2009)
M.Phil., University of Oxford (2011)
Submitted to the Department of Brain and Cognitive Sciences
in partial fulfillment of the requirements for the degree of
Doctor of Philosophy in Cognitive Science
at the
MASSACHUSETTS INSTITUTE OF TECHNOLOGY
ACHUSElTS INSTITUTE AHSETSs ISTITUTE OF TECHNOLOGY
JUL 20
2015
LIBRARIES
ARCHIVES
June 2016
Massachusetts Institute of Technology 2016. All rights reserved.
A uthor ...
Certified
by...Sig
Signature redacted
D(artment of Brain and Cognitive Sciences
r7
nature redacted.
May 6, 2016
Edward Gibson
Professor
Thesis Supervisor
Matthew
ison
Sherman Fa c ild Professor of Neuroscience and Picower Scholar
Director of Graduate Education for Brain and Cognitive Sciences
77 Massachusetts Avenue
Cambridge, MA 02139 http://Iibraries.mit.edu/ask
DISCLAIMER NOTICE
Due to the condition of the original material, there are unavoidable flaws in this reproduction. We have made every effort possible to provide you with the best copy available.
Thank you.
The images contained in this document are of the
,best quality available.
Cognitive and communicative pressures in natural language
by
Kyle Mahowald
Submitted to the Department of Brain and Cognitive Sciences on May 6, 2016, in partial fulfillment of the
requirements for the degree of Doctor of Philosophy in Cognitive Science
Abstract
Why do languages have the words they do instead of some other set of words? In the
first part of this thesis, I argue that cognitive and communicative demands strongly influence the structure of the lexicons of natural languages. It is known that words in natural language are distributed such that shorter words are more frequent and occur after more predictive contexts. I provide evidence that, at least in part, this pattern is
driven by word shortenings (i.e., chimp -+ chimpanzee) and that word shortenings can
be predicted by principles of efficient communication. I also show that, using nonce words with no pre-existing semantic meaning, a Zipfian correlation between length and frequency emerges in freely produced text and that this correlation is driven
by participants' tendency to reuse short words more readily than longer words. In
addition to word length, I investigate phonetic probability in a corpus of 97 languages. Across a wide variety of languages and language families, phonetic forms are optimized for efficient communication. And, using baseline phonetic models, I show that the words in the lexicons of four languages (English, Dutch, German, and French) are more tightly clustered in phonetic space than would be suggested by chance alone.
This thesis depends on standard methods in language research. How reliable is the data that we work with as a field? In the second part of this thesis, I tackle that question by examining two dominant methods in modern language research: behavioral experiments (specifically syntactic priming) and linguistic acceptability judgments. I present data, based on large-scale surveys, showing that many of the standard syntactic and semantic judgments in a mainstream linguistic journal are flawed. Using this data, I construct a Bayesian prior over judgments and give recommendations for performing small sample-size experiments in linguistics that will not overly burden researchers. Finally, I present a large-scale meta-analysis of syntactic priming (the largest meta-analysis of a psycholinguistic phenomenon) and find that, while many priming studies are severaly underpowered, there is no evidence of intense p-hacking. Thesis Supervisor: Edward Gibson
Acknowledgments
I've occasionally looked at someone's thesis just to read the acknowledgments. If that's the reason you're here, then welcome! Sorry you're not sticking around.
The first person to thank here is my advisor Ted Gibson, followed closely by Ev Fedorenko. Ted and Ev are my friends as much as they are my advisors, and I couldn't have asked for better advisors as friends or friends as advisors. As friends, they have been there for me every step of the way: countless Flour lunches, trout/steak/burger/Ev salad dinners, retreats, trips, sporting events, Dixit, and so much more. As advisors, they helped me grow from someone with a background in English literature and syntax into a fully fledged quantitative psycholinguistics bunny who knows how to do all sorts of things. I have learned enormous amounts from both of them. While the advisorship half of the advisorship/friendship will necessarily change with my graduation, I look forward to the continuing flourishing of the friendship half.
There are many other mentors to thank, including the non-Tev part of my com-mittee. Steve Piantadosi worked with me and advised me on much of the work in this thesis. His ability to solve seemingly every research problem and answer every question is a wonderful thing to have on one's side, and I am honored to have been among his first students. Josh Tenenbaum is one of the most exciting people there is to talk to about science; I left every conversation with him feeling energized. The same is true of Nancy Kanwisher, who always had something sharp and helpful to say every time I met with her and manages to do it in a way that leaves you convinced that she's the coolest.
I thank all of the collaborators on the work in this thesis - the aforementioned Ted
and Ev and Steve, along with Anne Christophe, Isabelle Dautriche, Richard Futrell,
Peter Graff, Jeremy Hartman, and Ariel James - as well as everyone who contributed
to the individual pieces of research that went into this dissertation.
My fellow Tedlab graduate students and postdocs over the years have been
enor-mously helpful in many ways: Leon Bergen, Peter Graff, Hal Tily, Tim O'Donnell, Alex Paunov, Richard Futrell, Melissa Kline, Laura Stearns, as have the many Evlabbies
including Olessia Jourvalev, Brianna Pritchett, Idan Blank, Zach Mineroff, and Caitlyn Hoeflin.
Among the many others I could list here, I thank my previous academic advisors: Daniel Donoghue at Harvard; Aditi Lahiri and Mary Dalrymple at Oxford. I am also very grateful to Bevil Conway, Vic Ferreira, Roger Levy, Josh McDermott, Alexa Khan, Julian Jara-Ettinger, and everyone else who made MIT a great place to work. Next, I thank my shorter, darker-haired roommate of the last 6 years, Dan Roberts. It's been invaluable having such a good friend right in my apartment, even when that just means making time for Tevensons.
Summing up my family's contributions on this little page feels a bit inadequate.
My mom and dad, my sister Megan, and Nan & Pop have supported my education
every step of the way, from pre-K through this dissertation. They have given me every opportunity I ever could have asked for and much more.
And then there's ZOZ Robbie Kubala. I've now literally written a dissertation about words, but I still don't know any that can do him justice. So I'll just say that he's the best.
Contents
1 Introduction 19
I Lexicon 25
2 Lexicon and word lengths 27
2.1 Info/information theory . . . . 29
2.1.1 Introduction . . . . 29
2.1.2 M aterials . . . . 30
2.1.3 Experiment 1: Corpus study . . . . 31
2.1.4 Experiment 2: Behavioral study . . . . 33
2.1.5 D iscussion . . . . 34
2.2 Zipfian distributions in the absence of semantic differences . . . . 38
2.2.1 Experiment 1 . . . . 39
2.2.2 Experiment 2 . . . . 43
2.2.3 D iscussion . . . . 45
3 Phonotactics and communication 47 3.1 Introduction . . . . 47
3.2 M ethod . . . . 50
3.3 R esults . . . . 52
3.3.1 Large-scale effects of frequency on 97 languages . . . . 52
3.3.2 Testing correlation generalizability to phonemic representations 59 3.4 D iscussion . . . . 59
3.5 Appendix: Dataset of 97 lexicons from Wikipedia . . . . 3.6 Appendix: Lasso regression analysis . . . .
4 Simulating null lexicons
4.1 M ethod . . . .
4.1.1 Real Lexicons . . . .
4.1.2 Generative models of Lexicons . . . .
4.1.3 Selection of the best model . . . .
4.1.4 Building a baseline with no pressure for clu
4.2 Results: Overall similarity in the lexicon . . . . .
4.2.1 Minimal pairs . . . .
4.2.2 Levenshtein distance . . . .
4.2.3 Network measures . . . .
4.2.4 Robustness of the results . . . .
4.2.5 Interim summary . . . .
4.3 Results: Finer-grained patterns of similarity in the
4.3.1 Wordform distinctiveness in minimal pairs
npiness or lexicon 61 62 65 . . . . . 70 . . . . . 71 . . . . . 72 . . . . . 75 dispersion 76 . . . . . 77 . . . . . 78 . . . . . 79 . . . . . 82 . . . . . 88 . . . . . 90 . . . . . 91 . . . . . 92
4.3.2 Wordform similarities within and across grammatical categories
4.3.3 Interim summary . . . .
4.4 D iscussion . . . .
II Evaluating methods in psychology and linguistics
5 Methods in linguistics: SNAP (Small N Acceptability Paradigm) for
Linguistic Judgments
5.1 Introduction . . . .
5.2 Evaluation of Judgments from the Literature . . . . 5.2.1 Experiment 1: Ratings Experiment . . . .
5.2.2 Experiment 2: Forced choice experiment . . . .
5.3 SNAP Judgm ents . . . . 5.3.1 Testing SNAP Judgments . . . .
95 99 99 06 [07 107 112 113 118 121 123
5.3.2 Recommendation for SNAP Judgments . . . . 124
5.3.3 Limitations of SNAP Judgments . . . . 126
5.4 D iscussion . . . . 128
5.5 Appendix A: Rating Study Results . . . . 130
5.6 Appendix B: Forced Choice Results . . . . 130
5.7 Appendix C. References . . . . 131
5.8 Appendix D: Discussion of items that do not show clear results in the predicted direction. . . . . 131
5.9 Appendix E: Math behind SNAP Judgments . . . . 132
5.10 Appendix F. Statistical Power . . . . 138
6 Evaluating methods in psycholinguistics: Meta-analysis of syntactic priming 141 6.1 Introduction . . . . 141
6.2 Meta-analysis . . . . 144
6.2.1 M ethod . . . . 144
6.2.2 R esults . . . . 153
6.3 Assessment of publication bias and statistical power . . . . 169
6.3.1 M ethod . . . . 170
6.3.2 P-curve results . . . . 175
6.4 Sample size recommendations . . . . 177
6.5 D iscussion . . . . 180
7 Conclusion 183 7.1 On functional linguistics . . . . 183
7.2 On functional scientific methods . . . . 186
List of Figures
2-1 Difference in mean surprisal between the long and short form (long
-short) plotted against log combined corpus count of short and long. The pairs above the line at x = 0 show the expected effect whereby
long-form surprisal is greater than short-form surprisal. . . . . 32
2-2 The y-axis shows the proportion of trials where the long form was chosen in predictive contexts subtracted from the proportion of trials for which the long form was chosen in non-predictive contexts. The pairs that fall above the line at x=O show the expected effect whereby the long form was chosen more often in non-predictive contexts than in predictive contexts. The x-axis indicates the alphabetical order of the
w ords. . . . . 35
2-3 For Experiments 1 and 2, the log rank plotted against the log frequency
for nonce words. Both experiments show Zipfian distributions. . . . 41
2-4 The log rank against the log frequency at that rank and shows the classic Zipfian shape. The size of the point is the average length of the word at that rank frequency. Note that the least frequent words are,
on average, the longest. . . . . 42
2-5 Separated by length, the average word position (from 0 to word n) of
the first use of a particular word. . . . . 43
2-6 Separated by length, the average probability of re-using a word of that
3-1 Correlation coefficients between a) orthographic probability and
fre-quency and b) minimal pairs and frefre-quency, by language and length, with 95% confidence intervals based on Fisher transforms for words of length 4 to 6 for non-Indo-European languages. Dots to the right of the dotted line at 0 show a positive correlation. The numbers along the y-axis are the Pearson correlations. Text and points are colored by
language fam ily. . . . . 53
3-2 Correlation coefficients between a) orthographic probability and
fre-quency and b) minimal pairs and frefre-quency, by language and length, with 95% confidence intervals based on Fisher transforms for words of length 4 to 6 for non-Indo-European languages. Dots to the right of the dotted line at 0 show a positive correlation. The numbers along the y-axis are the Pearson correlations. Text and points are colored by
language fam ily. . . . . 54
3-3 This plot shows the lasso regression coefficients (predicting scaled
frequency) for scaled number of minimal pairs and scaled orthographic
probability. . . . . 64
4-1 Evaluation of the lexical models . . . . 76
4-2 Similarity measure: number of minimal pairs . . . . 78
4-3 Similarity measure: number of minimal pairs per word length . . . . 80
4-4 Similarity measure: average Levenshtein distance . . . . 81
4-5 Similarity measure: average Levenshtein distance per word length . . 83
4-6 Example phonological network . . . . 84
4-7 Phonological network for English 4-phone words . . . . 85
4-8 Similarity measures: transitivity, giant component, clustering coefficient 86
4-9 Robustness of the results . . . . 89
4-10 Wordform distinctiveness in minimal pairs . . . . 93
4-11 Wordform distinctiveness in minimal pairs in English . . . . 94
4-13 Wordform similarities within and across grammatical categories (using
stem s) . . . . 98
5-1 Each point is an effect size for the ratings experiment listed on the
y-axis with 95% confidence intervals estimated from the linear mixed effect model. When the error bars extend through 0, the effect is not
significant. . . . . 116
5-2 Each point is an effect size for the forced choice experiment listed on the y-axis with 95% confidence intervals estimated from the linear mixed effect model. When the error bars extend through 0, the effect is not
significant. . . . . 120
5-3 The histograms represent a density map of a draw from a beta
dis-tribution with the shape parameters indicated. The red line is the probability density of the beta distribution at each value for p between
0 and 1. The plot on th left conforms to an instance in which, most
of the time, the probability p is extreme (towards 0 or 1), as in the experiments we tested here. The plot on the right corresponds to a situation in which we have a strong prior belief that the probability p
is near .5. . . . . 135
5-4 This plot corresponds to a smoothed histogram (averaged over many trials) of the data from our forced choice experiment where, for each contrast, one variant is randomly assigned to be Sentence A and one to be Sentence B. Most of the time, there is a strong preference for one sentence or the other. The best fit for the beta distribution is Beta(5.9,
1.1)-which is shown by the red line. . . . . 136
6-2 Effect size estimates (one data point per experimental condition) by
language and construction type are represented by the individual hor-izontal lines and are not weighted by sample size or standard error. The horizontal line represents the median, and the gray blobs represent smoothed density estimates such that fatter parts of the blob represent
m ore likely value. . . . . 155
6-3 Effect size estimates (one data point per experimental condition) by
moderator are represented by the individual horizontal lines and are not weighted by sample size or standard error. The horizontal line represents the median, and the gray blobs represent smoothed density estimates such that fatter parts of the blob represent more likely value. 156
6-4 Forest plot with 95% CIs for dative studies with no lexical overlap . . 157
6-5 Forest plot with 95% CIs for dative studies with lexical overlap . . . . 158
6-6 Forest plot for active/passive and other studies with and without boost. 159
6-7 Forest plot with 95% CIs for main priming effect and moderators . . 162
6-8 Forest plot with 95% CIs for main priming effect and moderators . . 168
6-9 Default plot produced by p-curve for sample of studies in which the
effect of interest is the existence of syntactic priming. The blue line is the distribution of p-values in the study. The red line shows the expected distribution of p-values if there was no underlying effect. The green line shows the expected p-curve under 33% statistical power. The right skew in the blue line shows there is evidential value in this set of
studies . . . . 173
6-10 Default plot produced by p-curve for sample of studies in which the
effect of interest is a moderator of syntactic priming. The blue line is the distribution of p-values in the study. The red line shows the expected distribution of p-values if there was no underlying effect. The green line shows the expected p-curve under 33% statistical power. The right skew in the blue line shows there is evidential value in this set of
6-11 Power to detect priming effect with lexical overlap (on top) and no
lexical overlap (bottom ). . . . . 178
List of Tables
3.1 Table of Indo-European languages used, language families in bold. . 50
3.2 Table of non-Indo-European languages used, language families in bold. 50
3.3 Phonotactically likely and iki words in English with their log
probabilities . . . . 52
3.4 Summary of relationship between orthographic probability and
fre-quency, across languages. Separated by length, (a) the mean correlation across languages for the relationship between orthographic probablility and frequency, (b) the proportion of languages that show a positive correlation between orthographic probability and frequency, and (c) the proportion of languages for which this relationship is significantly different from 0 at p < .05. In parentheses, we include each value for the subset of the lexicons that do not appear in the English Subtlex
subtitles corpus. . . . . 55
3.5 Summary of relationship between minimal pairs and frequency, across
languages. Separated by length, (a) the mean correlation across lan-guages for the relationship between number of minimal pairs and fre-quency, (b) the proportion of languages that show a positive correlation between number of minimal pairs and frequency, and (c) the proportion of languages for which this relationship is significantly different from 0 at p < .05. In parentheses, we include each value for the subset of the
3.6 Separated by length, the model coefficient from the full model including random intercepts and slopes for language, sub-family, and family for orthographic probability and number of minimal pairs. Two asterisks means that by a likelihood test, the predictor significantly improves
model fit at p < .01. Three asterisks means p < .001. . . . . 58
4.1 Similarity measure: number of minimal pairs (statistics) . . . . 79
4.2 Similarity measure: average Levenshtein distance (statistics) . . . . . 82
4.3 Similarity measures: transitivity, giant component, clustering coefficient (statistics) . . . . 87
4.4 Wordform similarities within and across grammatical categories (statistics) 97 5.1 Questionable results . . . . 117
5.2 Means and Cl's for sample sizes n=1 through n=10 . . . . 124
5.3 Power and error rates for ratings studies . . . . 139
Chapter 1
Introduction
When Juliet says "A rose by any other name would smell as sweet," that may well be true from an olfactory perspective. But if a rose had some other name, would Juliet be able to access it just as easily from her mental library of stored words? If the Montagues and Capulets were having a noisy spat somewhere outside Juliet's balcony, would the ruckus cause Romeo to misunderstand Juliet and think that she said something about a nose smelling as sweet? Is it burdensome for Romeo and Juliet's language processing systems that, in addition to being a flower, rose can also be a woman's name and the past tense of rise? A rarer textual variant of Romeo and Juliet, Quarto 2, calls the phrase "any other name" by another name, stating that "a rose by any other word would smell as sweet." Would that version have become as memorable and widely cited?
The first part of this thesis is about an aspect of language that Juliet touches on when she muses about why a rose is called a rose: the relationship between word forms and their meanings. Imagine an alternative version of English in which I took all the meanings we might want to convey and randomly paired them with word forms. Would this bizarro version of English be just as efficient for communication?
I explore that question in two distinct domains: first asking how the distribution of
word lengths observed across languages, emerges through the communicative demands of speakers. Then, I turn to questions of word form: how the phonetic properties of words are affected by their use.
While there is no a priori reason why a dog should be called a dog and a tarantula a tarantula instead of the other way around, there is a good reason that the word dog is shorter: the word dog needs to be accessed much more frequently and therefore, from a communicative perspective, it is advantageous for it to be short. Indeed, across languages, lexicons have evolved such that most frequent words are short (Zipf, 1935) and predictable from context (Manin, 2006; Piantadosi, Tily, & Gibson, 2011). Besides the general property of lexicons that short words are predictable, people selectively use shorter words (Mahowald, Fedorenko, Piantadosi, & Gibson, 2012)-or omit words altogether-when the context is predictive (Frank & Jaeger, 2008; Levy & Jaeger,
2007).
Speakers also have degrees of freedom in the duration used to pronounce a given word. That is, a word can be pronounced differently based on its context (Lindblom,
1990), particularly its predictability in context (Gahl & Garnsey, 2004; Bell et al., 2003; Seyfarth, 2014), in a way that is sensitive not just to the speaker's needs but to
the intended audience (Pate & Goldwater, 2015). Thus, we would expect that the word "dog" in the highly predictable sentence "I have to go home to walk my dog" would be pronounced more quickly than in the sentence "In the office I found a dog," where the italicized word could be just about anything. The logic is that, when the context is unpredictive, the listener needs more time to understand what's coming next and could benefit from a slower, more careful pronunciation. When the next word is known, the word can be pronounced quickly since there is little chance of misunderstanding it. These effects are consistent with the idea that linguistic utterances are structured so as to spread out the rate at which information is transmitted, in the sense of efficient coding theory (Shannon, 1948). By using shorter forms for more frequent and predictable meanings and longer forms for less frequent and less predictable meanings, languages establish a trade-off between the overall effort needed to produce words and the chances of successful transmission of a message (van Son & Pols, 2003; Aylett & Turk, 2004; Levy & Jaeger, 2007).
The efficient profile of word lengths shown across languages raises the question of how this efficient profile emerges, even as meanings of words change and the words
themselves changes. In Chapter 2, I focus first on the question of how efficient word lengths evolve in the lexicon and how languages successfully navigate the tradeoff between the length of words and their robustness to noise. I test the hypothesis that, when a word is highly predictable in context, it will shorten in order to avoid being longer than it needs to be. To do that, I examine word shortenings like chimpanzee to
chimp in a corpus analysis and a behavioral experiment (work published in Mahowald
et al. (2012)). I then turn to a study investigating how, in the absence of meaning, speakers use novel words. Specifically, I give speakers 12 novel words (of varying length) and ask them to use some or all of those words in a science fiction story. In the stories produced, speakers show the same Zipfian distribution of word frequencies and the same length/frequency correlation seen in natural languages.
In Chapter 3, drawing on work in Mahowald, Dautriche, Piantadosi, and Gibson (Under revision), I focus on another prediction from Zipf: that the most frequent words should also be the easiest to produce and understand. That is, is there any systematic phonetic difference between frequent 3-phone words like dog and cat and less frequent 3-phone words like nib and vim? Specifically, we focus on phonotactic
probability (which we approximate using orthographic probability) and phonological neighborhood density.
Phonotactic probability is a measure of the well-formedness of a string in a given language. For instance, in English the word drop is phonotactically quite probable,
dwop is less probable but still allowed, and dsop has, essentially, zero probability. In
this work, I will use orthographic probability, as measured by an n-gram model, as a proxy for phonotactic probability. Under a bigram model of orthographic probability, for instance, the probability of a string like drop would depend on the probability of the two-letter sequences that make up the word: dr, ro, and op. Phonological neighborhood density of a word w is the number of words that differ from word w by one insertion, deletion, or substitution (Luce, 1986; Vitevitch & Luce, 1998).
The result of Chapter 3-that the most frequent words in a language have the most neighbors and the highest phonotactic probability-raises the question whether phonological neighbors are desirable in a lexicon or whether they lead to increased
competition and should be avoided. In Chapter 4, (work submitted as Mahowald, Dautriche, Piantadosi, Christophe, and Gibson (Under revision)), I evaluate the real lexicon against a simple model of phonotactics, asking whether phonological neighbors occur more often than one would expect based on chance alone.
This thesis presents work at the intersection of cognitive science and linguistics. In both of these areas, there has been recent controversy as to best scientific practice. The second part of the thesis focuses on questions in the methodology of linguistics and psycholinguistics. I ask whether dominant methods used in traditional linguis-tics (acceptability judgments in syntax and semanlinguis-tics) and psychology (behavioral experiments, using syntactic priming as a case study) produce robust, generalizable results.
In linguistics, especially research in syntax and semantics, a major source of data is acceptability judgments: judgments as to which sentences are acceptable as compared to others. In recent years, increases in the availability of data have led to discussions of the weaknesses of the informal method (Arppe & Jdrvikivi, 2007; Cowart, 1997; Gibson & Fedorenko, 2013, 2010a; Gibson, Piantadosi, & Fedorenko, 2013; Gross
& Culbertson, 2011; Schutze, 2006; Sorace & Keller, 2005; Wasow & Arnold, 2005;
Linzen & Oseki, 2015). Such weaknesses include potential cognitive biases on the part of the researcher and participants, difficulty in controlling for discourse context, the inability to find interactions among factors, and the inability to find probabilistic effects or relative effect sizes.
Gibson and Fedorenko (2010a), Linzen and Oseki (2015) and others have shown that this method leads to errors in the literature: some of the judgments that underpin major theoretical claims are simply not widely accepted by the linguistic community. In work adapted from Mahowald, Graff, Hartman, and Gibson (2015), I present a large-scale evaluation of the reliability of the linguistic literature by randomly sampling experiments from 10 years of the journal Linguistic Inquiry. I use that data both to evaluate the literature and to act as a prior for future linguistic judgments (Mahowald, Graff, et al., 2015). We call this paradigm SNAP Judgments (Small N Acceptability Paradigm for Linguistic Judgments).
In effect, SNAP Judgments recommends making theoretical linguistics more em-pirically oriented by increasing the amount of empirical data and running more experiments. But has the pscyholinguistic enterprise produced reliable and robust data? The state of the field in other areas of psychology and experimental science more generally has suggested we cannot assume that psycholinguistics is producing consistent and clear results. There has been work in other branches of psychology alleging widespread publication bias (Ioannidis, Munafo, Fusar-Poli, Nosek, & David, 2014; Landy & Goodwin, 2014), low reproducibility (Open Science Collaboration,
2015), and low statistical power (Button et al., 2013b, 2013a), which can lead to
inflated false-positive rates in the literature and unreliable results (Gelman & Carlin, 2014).
As a case study, in Chapter 6, I describe results from Mahowald, James, Futrell, and Gibson (2016), a systematic meta-analysis of syntactic priming in language production. Syntactic priming (Bock, 1986; V. S. Ferreira & Bock, 2006; Pickering & Ferreira,
2008) is a major phenomenon in psycholinguistics that has been central to the field
for 30 years. In effect, it states that, if someone is primed with a syntactic structure X that freely varies with syntactic structure Y, a person is more likely to use X than she otherwise would have.
We report three results: a standard meta-analysis, an analysis of publication bias, and recommendations for sample size in future priming studies. We take effect size to be the log odds ratio of the proportion of target structure produced in the prime condition to the proportion of target structure produced in the no-prime condition. For 45 of the 73 papers in our sample, we obtained raw data from the authors and used it to derive estimates of effect size and standard error. From the remaining papers, we estimated the effect size and standard error using the published estimates. Along with effect sizes and their associated standard errors, we also collected information on several key manipulations that can potentially modulate the priming effect, including the construction used, lexical repetition, lag, and whether the priming is within or across languages. Using these variables, we estimated the average effect size of syntactic priming given various experimental conditions.
As a secondary analysis, I assessed the extent to which the set of papers in our study suffer from publication bias and low power. To assess publication bias and statistical power, I used p-curve, a tool developed for that purpose which works by analyzing the distribution of significant p-values in the literature (Simonsohn, Nelson,
& Simmons, 2014a, 2014b). Using the raw data gathered from the study authors, I
present a power analysis and give guidelines on how to run syntactic priming studies with sufficient statistical power.
Thus, this thesis has two main goals: first to understand pressures on the structure of the lexicon and second to improve the standard for best practices in work at the intersection of these two fields. The hope is that, by seeking to study natural language while simultaneously scrutinizing our own methodologies, we can make meaningful progress towards both goals.
Part I
Lexicon
Chapter 2
Lexicon and word lengths
Zipf famously showed that word length and frequency are inversely correlated: shorter words tend to be more frequent. The reason for this relationship, according to Zipf, is to maximize efficiency by using short words-which take less effort to produce-more often than long ones (Zipf, 1949, 1935). Zipf's ideas about language and efficiency in some ways anticipated information theory (Shannon, 1948), which provides a mathematical framework for formally characterizing the efficiency of communicative systems. However, the application of such ideas to natural language waned in the second half of the twentieth century, perhaps in response to the rise of generative linguistics, which has typically eschewed efficiency-based models of language. Chomsky, for example, has repeatedly argued against communication-theoretic models of language (Chomsky, 1975).
Recently, however, there has been renewed interest in studying language as a communication system. Piantadosi et al. (2011) used insights from information theory to build upon Zipf's claim about word length. As applied to language, the information conveyed by a word can be quantified by its surprisal, a measure of how unpredictable
a word is given its context: -logP(W = w|C = c) (Hale, 2001; Levy, 2008b). This
notion captures the intuition that words that are completely predictable from context
( -logP(W = wIC = c) ) convey no ( log(1) = 0 ) bits of information. For instance,
in the phrase "to be or not to be," the final be is almost entirely predictable from the preceding context so would have surprisal approaching 0. Conversely, words that are
highly unpredictable from context will have surprisal values that tend towards infinity
as the probability of the word given its context approaches 0. The final word in "to be or not to kumquat" would have a surprisal that, while not infinite, would be high indeed.
In any communication system with variable-length communicative units (codes), it is most efficient to assign shorter codes to those elements that convey less information. In language, it is natural to take words as the code units, and study whether shorter words forms are indeed assigned to less informative meanings. Piantadosi et al. (2011) show that this prediction holds-that shorter words tend to convey less information (as measured by an idealized statistical model) than longer words. This result improves on Zipf's theory of frequency-driven word lengths by explicitly considering a word's typical predictability in linguistic context. Like an efficient variable-length code, language is organized such that low-information words-not just more frequent words-are shorter than high-information ones.
An important consequence of this organizational structure is that a lexicon in which word length is a function of information content allows speakers to approach a uniform rate of information conveyance. This Uniform Information Density (UID) allows speakers to maximize information conveyed without exceeding the produc-tion/perceptual channel capacity (Genzel & Charniak, 2003; Van Son & Pols, 2003; Aylett & Turk, 2004; T. Jaeger, 2006; Levy & Jaeger, 2007; Frank & Jaeger, 2008; T. Jaeger, 2010). Much previous work on UID has shown that information density can be manipulated by factors outside lexical content: syntactic variation such as that omission (Levy & Jaeger, 2007; T. Jaeger, 2010), phonetic reduction and lengthening (Aylett & Turk, 2004; Bell et al., 2003), and contraction of phrases like you are to you're (Frank & Jaeger, 2008). A correlation between information content and word length (Piantadosi et al., 2011), however, suggests the possibility that even content words-which are typically perceived as most fundamental to meaning and thus hardest for speakers to manipulate-can be used to control information rate.
Piantadosi et al.'s corpus results alone, however, are not sufficient to draw this conclusion. Because Piantadosi et al. do not attempt to control for meaning and
syntactic category, the relationship between word length and information could arise from broad differences among syntactic classes of words. For instance, the effect could be driven by function words being shorter and less informative than content words, by a large-scale difference between nouns and verbs, or by other unforeseen regularities in the corpora.
In this chapter, we first evaluate whether the information/word length relationship holds for words of the same class, one would want to measure average informa-tion content while varying word length and holding meaning and syntactic category constant. Short/long word pairs, like chimp/chimpanzee, math/mathematics, and
exam/ examination, offer precisely such a controlled comparison by providing
near-synonyms that vary in length. If the information-word length effect holds for words of the same class, shorter words in these pairs are predicted on average to convey less information. We test this prediction in a corpus study and a behavioral experiment.
In the second section of this chapter, we investigate where the observed relationship between word length and frequency comes from since word shortenings clearly cannot explain the whole effect. To do that, we elicited narrative texts from experimental participants, in which they used 12 nonce words that varied in length. Because these words do not have any a priori meaning, it was not obvious that they should follow a Zipfian frequency distribution or that they should show the length/frequency relationship seen in natural language. We tested these properties in the stories and found that, although short words and long words were equally likely to be used at first, the short words were more likely to be re-used. We use these results to explore a memory-based explanation of the Zipfian length/frequency effect.
2.1
Info/information theory
2.1.1
Introduction
In this experiment, we evaluate whether word shortenings (like like chimp/chimpanzee,
In addition to determining whether content words can be used to manipulate information rate, there is another important implication of studying the information content of short/long word pairs. A systematic difference in expected surprisal between short and long forms would serve as evidence that the information/word length relationship constitutes part of a speaker's abstract linguistic knowledge and is not solely a product of long-term linguistic evolution. In other words, the most plausible explanation for a systematic difference in surprisal between nearly synonymous noun pairs differing in length would be that speakers are sensitive to the relationship between word length and predictability and thus actively choose word-forms that conform to that relationship during on-line production. For example, they tend to choose exam after predictive contexts and examination after non-predictive contexts. The absence of such a difference, however, would suggest that Piantadosi et al.'s effect does not constitute part of an individual speaker's knowledge of language. One might instead conclude that the effect arises from differences among classes of words or because of long-term pressure for linguistic efficiency that does not extend to the level of active speaker choice.
2.1.2
Materials
Word pairs of the form exam/examination for both the corpus and behavioral study were selected by generating a list of possible candidates using a combination of
CELEX (R. Baayen, Piepenbrock, & Gulikers, 1995), Wordnet (Fellbaum, 1998), and
(Marchand, 1966). Word pairs were selected to ensure that the short and long form of each pair could be used interchangeably.
Because the corpus does not distinguish between different meanings of identically spelled words, pairs like ad/advertisement were used only in the behavioral experiment since ad is not just an abbreviation for advertisement but is also used in Latin expressions like ad infinitum, ad nauseum, etc. Moreover, multi-word forms, like
United States, were included in the behavioral experiment but not in the corpus
analysis due to limitations of the corpus. Thus, the corpus materials are a subset of the behavioral materials. Every effort was made to include any and all pairs that meet
the criteria above.
2.1.3
Experiment 1: Corpus study
In the corpus study, we first used the data from Piantadosi et al. (2011) (an unsmoothed three-gram model from the Google corpus) to obtain average surprisal estimates for 22 short/long word pairs. Using the corpus, surprisal for each word w was estimated
by the equation:
n
- 1/N logP(W = w|C = ci) (2.1)
i=1
where ci is the context of the ith occurrence of w and N is the total frequency of
w. Because the three-gram model was shown to be the most reliable by Piantadosi et
al., context ci was estimated here as the two words preceding word w.
Replicating Piantadosi et al., the mean surprisal for long forms (9.21) was signifi-cantly higher than that for short forms (6.90) (p =.004 by Wilcoxon signed rank test).
Of the 22 pairs, 18 showed higher average surprisal for the long form than for its
shorter counterpart. A linear regression (with unscaled variables) modeling difference in log frequency between short and long forms as a predictor for difference in surprisal revealed that the effect held even when controlling for the fact that short words tend to be more frequent than long ones. Although there was indeed an expected significant effect of difference in log frequency on difference in surprisal (t=-4.67, p<.001), an intercept of 1.45 (t=2.76, p =0.01) indicated that, when there was no difference in frequency between the forms, the mean surprisal of long forms was 1.45 higher than that of short forms.
Figure 2-1 shows the difference in average surprisal between the long and short form of each word pair plotted against the log corpus count of the pair's short and long form combined (i.e., the frequency of the pair as a unit). For ease of reading, only the short form is listed on the plot. The key feature of the plot is that most pairs fall above the line drawn at x=0.
Corpus Results
14 14 15 15 16 16 i 17Log combined corpus count (short + long)
Figure 2-1: Difference in mean surprisal between the long and short form (long - short)
plotted against log combined corpus count of short and long. The pairs above the line at x = 0 show the expected effect whereby long-form surprisal is greater than short-form surprisal. 0 0 C,, .0 C 0 U) I=.. CL C a, roach chimp hippo ref -0 rhino phot
.dorm memo porn .phone
carbs bike
kilo limo exam
fridge ,undergrad sax math ffat chemo C0 LO) I 12 12 13 13 18 18 1 19
on average than its shorter counterpart, and that this effect cannot be explained only
by a difference in frequency between short and long forms: predictiveness of context
plays an important role.
2.1.4
Experiment 2: Behavioral study
To test whether participants actively choose short forms in predictive contexts, we used Amazon's Mechanical Turk to present 58 native English speakers with forced-choice sentence completions in which they chose between the short and long form of a word pair based on which sounded more natural. The manipulation of interest was whether the context was predictive of the missing final word (supportive-context condition) or non-predictive (neutral-context condition).
Sample item:
Supportive context: Bob was very bad at algebra, so he hated... 1. math 2. mathematics
Neutral context: Bob introduced himself to me as someone who loved...
1. math 2. mathematics
The order of the answer choices was balanced across participants and items. Supportive and neutral contexts were matched for length. To avoid any biases from common phrases like "final exam," the key word was never presented as part of a common phrase. Comprehension questions were included to ensure that participants were engaged in the task.
To ensure that our context manipulation was effective, we presented a separate group of native English speakers (n=80) with the same sentence preambles and asked them to supply a word of their choosing to complete the sentence. For supportive contexts, the target word (either the short or long form) was chosen 52.4% of the time compared to just 1.6% of the time for neutral sentences. The effect of context on whether the word from the target pair was supplied was highly significant by a mixed-effect logistic regression with item and participant slopes and intercepts
( n=5.22, z=13.09, p < 10-s c).
often (67%) than in neutral contexts (56%). This effect of context on choice of form was significant when compared to the overall mean by a mixed-effect logistic regression (R. Baayen, Davidson, & Bates, 2008; Gelman & Hill, 2007), with item and participant slopes and intercepts (0=.75, z=3.65, P<.001). There was also a significant baseline preference for the short form independent of context (0=.77, z=2.76, P<.01). The context dependence of choice of form suggests that the correlation between word length and informativeness is likely influenced by language production phenomena, where users actively prefer to convey meanings with short forms when the meanings are contextually predictable, even when controlling for syntactic category and meaning.
Figure 2-2 shows the proportion of trials for which the long form of a word was selected in supportive contexts subtracted from the proportion of trials for which the long form was chosen in neutral contexts. As expected, the words tend to cluster above 0, which indicates that the long form of a word is chosen more often in neutral contexts.
We conclude that speakers actively select shorter word forms in more predictive contexts and longer forms in less predictive contexts.
2.1.5
Discussion
The information/word length effect holds for pairs of near synonyms that vary in length. The corpus analysis revealed that short forms in almost all instances have significantly lower information content than long forms. The word-choice experiment further showed that speakers are more likely to choose a short form in a supportive context than in a neutral context. We therefore conclude that, just as phonetic and syntactic factors can be used to manipulate information rate, so too can content words.
By looking at the same phenomenon (word shortening) in both a quantitative
corpus analysis and a behavioral experiment with human participants, we have untied two disparate approaches to measuring linguistic context. Our corpus study relied on a precise notion of context: two words immediately preceding the target word. Although this measure of information is a rather impoverished substitute for the rich real-world context that determines a word's surprisal, it has the advantage of being precise and
Behavioral Results
0 _
m c pornS
oA/C chemo Coke burger chimp dorm
.ER carbs. ad -bike I A-E sax. mayo
ofridge -Lab * phone quads
math photo roach
lab. m ref memo *trat exam gas quad rhino a * .kilo ID limo hippo I E-L i L-R i R-V Words
Figure 2-2: The y-axis shows the proportion of trials where the long form was chosen in predictive contexts subtracted from the proportion of trials for which the long form was chosen in non-predictive contexts. The pairs that fall above the line at x=O show the expected effect whereby the long form was chosen more often in non-predictive contexts than in predictive contexts. The x-axis indicates the alphabetical order of the words. veto C 0 0) 0 0 C. 0 0. CL 2. U) ushake undergrad UK. UN 0 us 0
easily quantified. Moreover, n-gram surprisal measures have repeatedly been shown to perform well in predicting many real-world linguistic phenomena like syllable duration (Aylett & Turk, 2004), phonological reduction (Jurafsky, Bell, Gregory, & Raymond, 2001), and word length (Piantadosi et al., 2011). N-grams also serve as an adequate surrogate for real-world context in a wide array of natural language engineering tasks (Jurafsky & Martin, 2009).
That said, n-gram measures of surprisal ignore the semantic and pragmatic cues that play a role in the interpretation of real-world linguistic context. Our behavioral study used an alternative notion of linguistic context in which a context c is deemed either "neutral" or "supportive" for a given word w based on whether speakers routinely supply word w after context c. Thus, for the behavioral study, whether or not a context was supportive was usually a product of salient semantic and pragmatic factors. The fact that our results generalized across both the precise n-gram notion of context
as well as the fuzzier but more intuitive notion of context in the behavioral study is evidence that the relationship between word length and information content is not merely an artifact of using simplified n-gram-based measures of surprisal.
Moreover, these results suggest that considerations of word length and predictability form part of a speaker's knowledge of language. An important outstanding question concerns the level of abstraction at which this knowledge exists. It is possible that the corpus results presented here arise from learned preferences for each specific shortened form in predictive contexts and for each longer form in non-predictive contexts. Indeed, previous work (Fedzechkina, Jaeger, & Newport, 2012) has suggested that acquisition of communicatively optimal forms is easier than acquisition of less efficient forms. One way that this process could work would be for the short form to be preferentially learned in certain highly predictive contexts (final exam, football ref, etc.). But the behavioral experiment rules out this scenario in general since the sentences avoided these types of fixed phrases and presented participants with what were likely novel contexts. Thus, the behavioral results suggest that the corpus results (both the ones presented here and the ones reported by Piantadosi et al., 2011) arise because of an abstract association between word length and information. Such association is most
plausibly due to speakers preferentially varying word length on-line during production. These results thus add to a growing body of work showing that speakers actively control information rate.
This line of research may also have implications for understanding certain types of lexical change. Specifically, if a word's surprisal decreases, one should expect that word to shorten over time. This hypothesis accords with long-held intuitions about language change: "[Shortened forms] originate as terms of a special group, in the intimacy of a milieu where a hint is sufficient to indicate the whole" (Marchand, 1966). Information theory provides a way to formalize this intuition. In future work, it may be possible to model and even predict lexical change based on changes in surprisal.
More broadly, these results demonstrate the power of applying information theory to the study of language. An information-theoretic framework and model was critical in formulating the behavioral experiment, and correctly predicted its outcome. Our results therefore provide further evidence that language-and the cognitive systems that process it-result in part from pressures for efficient communicative design.
Here we have claimed that the frequency with which one wants to talk about
a chimpanzee in the world will affect the probability of shortening. Do we see a
preference for short words even in the absence of semantics? In the next chapter, we ask whether word shortenings occur even without semantic effects like the ones discussed here.
2.2
Zipfian distributions in the absence of semantic
differences
In the previous section, we saw that people selectively shorten words when the context is predictive. This account of the distribution of word lengths is largely based on the semantics of the words. That is, as a word meaning becomes more prominent and a word becomes more predictable in context, the word will shorten. In that sense, the length of a word is determined by a word's meaning and the frequency with which speakers want to convey that meaning.
Because most words are not shortenings of other words, word shortenings cannot explain the full range of effects that we see in natural language. Here, we ask whether the length/frequency effect emerges in the absence of any semantics at all by considering how speakers use a set of nonce words that vary in length. If even these nonce words-which have no a priori semantic meaning and do not obviously pick out different items in the real world-show the predicted length/frequency relationship, that would be evidence that the relationship between word length and frequency is not just mediated through semantics but is a part of speakers' knowledge of language. Using a paradigm developed in Piantadosi (2014), we elicited raw text (a science fiction story) from experimental participants in which they were supplied with and invited to use twelve nonce words. Piantadosi (2014) showed that the frequency distribution of these nonce words was Zipfian. We varied the length of the nonce words from 2 to 12 letters and explore the relationship between the frequency of the nonce words in the stories and their length.
Piantadosi (2014) showed that, even among these nonce words, the rank-frequency distribution is Zipfian. He uses this result to argue against a class of models, known as "random typing models," that have been proposed to explain the Zipfian distribution of word frequencies (Miller, 1957; Ferrer i Cancho & Moscoso del Prado Martin, 2011; Conrad & Mitzenmacher, 2004). Under this account, one can imagine a language being generated by randomly typing on a keyboard (with a new word being generated
points out, this is not a plausible account of natural language. In natural language, words are stored and re-used.
How does the length/frequency correlation emerge in real words, if not just by shortenings and if not by random typing? One default possibility is that the length distribution in natural language is largely determined by the relationship between form and meaning. That is, over time, we assign short forms to meanings such that the most frequently accessed meanings have short code lengths. Under this account, we would not expect the frequency of use of a nonce word to vary based on its length in this task.
The other possibility is that people prefer using short words and will preferentially use short words in this task. Given a length-based difference in how people use the nonce words, there are two further possibilities. Speakers could a) preferentially choose short words from the list of possibilities or b) prefer to re-use short words. The former possibility would suggest a global preference for short words-that, given a choice between a short and a long word, the speaker would rather use the short word. The latter possibility would be consistent with a memory-based account of the word length distribution, whereby short words are easier to remember and therefore more likely to be re-used.
2.2.1
Experiment 1
Participants
We recruited 80 participants on Amazon's Mechanical Turk. Participants were limited to self-identified native English speakers with IP addresses inside the United States who produced at least half the requested amount of text. After exclusions, 59 participants remained.
Materials
An alien space ship crashes in the Nevada desert. Twelve creatures emerge: [list of words]
In at least 2000 words, describe what happens next.
Your submission must be at least 2,000 words long. Your writing must be original, coherent, and based on the prompt.
The nonce words varied in length from 2 to 12 and are comprised of CV syllables. So a 4-letter word is CVCV (e.g., bako), a 12-letter word is CVCVCVCVCVCV (e.g.,
bamoparatofa). Each participant saw 2 words of each length for 12 words total. Cleaning data
In order to asses the frequencies of each nonce word, we cleaned and spell-checked the data as follows. Plurals were counted as uses of the target word. Words were spell checked by looking for all words that are not in an English dictionary or in the stimuli set. Excluding 2-letter words (for which spelling errors are generally impossible to recognize, even by hand), we checked to see if there are 1-edit neighbors of a stimuli word. If so, we counted this as a use of the target word. Then, for words of length 5 and above that fit that criteria, we checked for 2-edit neighbors. We then looked at the corrections by hand and exclude inappropriate corrections (i.e., corrections that were clearly actually intended to be words).
Results
First, we examined whether the distrubion of nonce words used was Zipfian by computing, for each participant, the frequency and frequency rank of reach word. We found that, on a log-log plot of rank frequency against frequency, the words were roughly linear. This held even within words of the same length. That is, a given participant was more likely to use his or her most common 2-letter nonce word more often than his or her second most common nonce word in a way that was consistent with a Zipfian distribution. Figure 2-3 shows the rank frequency distributions.
2 4- 3- 2-C cn -04 . 7 3-4 6 8 if 0 A .... 10 12 Cr CD ID . . ...
log
feunyrn
Figure 2-3: For Experiments 1 and 2, the log rank plotted against the log frequency for nonce words. Both experiments show Zipfian distributions.
'C
-log rank vs -log frequency, dot size is avg word length at that rank
2-Ca 0-Average Length 0Z @6 @7 CU @8 02-* m 0.0 0.5 1.0 1.5 2.0 2.5 log rank
Figure 2-4: The log rank against the log frequency at that rank and shows the classic Zipfian shape. The size of the point is the average length of the word at that rank frequency. Note that the least frequent words are, on average, the longest.
We next tested for the presence of the length/ frequency effect. We ran a Poisson regression to predict count from log length with random effect for worker (intercept and a slope by log length) and a random intercept for word. We found a sigificant effect of length such that a short word was more likely to be used than a long word
(0=-.45, z = -4.4, p < .0001). Figure 2-4 plots the log rank against the log frequency
at that rank and shows the classic Zipfian shape. The size of the point is the average length of the word at that rank frequency. Note that the least frequent words are, on average, the longest.
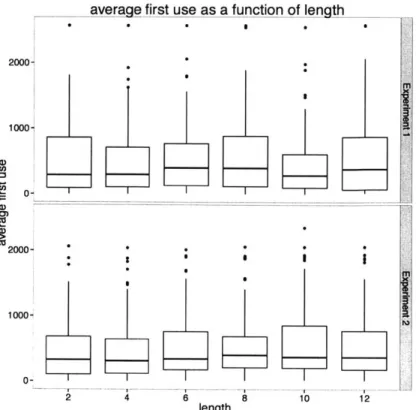
To assess where the length/ frequency effect comes from, we examined how likely a word was to be used for the first time as a function of its length. Among words used, there is a trend (not significant) for short words to be used earlier in the story than later in the story (/3=.012, t=1.78, p = .08), but the overall size of the effect is small. On the other hand, the probability of a short word being reused is much higher than
average first use as a function of length 2000- 1000-U) C') Ca 2000- 100 0-10 12 length
Figure 2-5: Separated by length, the average word position (from 0 to word n) of the first use of a particular word.
the probability of a long word being reused. In a regresssion predicting probability of re-use from length (with random effects of participant and word), there was a clear
effect of length (0=3-.15, z = -. 51, p < .0001).
Thus, the effect for short words to be used more often is largely due to their being more likely to be re-used more often than longer words.
2.2.2
Experiment 2
There is a potential confound in Experiment 1 in that participants were asked to type 2,000 words of text. If they were interested in doing so as quickly as possible (while still receiving payment), they may have been incentivized to use short words as often as possible. To avoid this confound and to test whether the effects reported above replicate in a new sample, we ran a new version of the experiment with identical methods except that the story was required to be 10,000 characters instead of 2,000 words.