HAL Id: hal-03088627
https://hal.archives-ouvertes.fr/hal-03088627
Submitted on 6 Jan 2021
HAL is a multi-disciplinary open access
archive for the deposit and dissemination of
sci-entific research documents, whether they are
pub-lished or not. The documents may come from
teaching and research institutions in France or
abroad, or from public or private research centers.
L’archive ouverte pluridisciplinaire HAL, est
destinée au dépôt et à la diffusion de documents
scientifiques de niveau recherche, publiés ou non,
émanant des établissements d’enseignement et de
recherche français ou étrangers, des laboratoires
publics ou privés.
Distributed under a Creative Commons Attribution - NoDerivatives| 4.0 International
warming in the Glacial North Pacific
J. Rae, W. Gray, R. Wills, I. Eisenman, B. Fitzhugh, M. Fotheringham, E.
Littley, P. Rafter, R. Rees-Owen, A. Ridgwell, et al.
To cite this version:
J. Rae, W. Gray, R. Wills, I. Eisenman, B. Fitzhugh, et al.. Overturning circulation, nutrient
lim-itation, and warming in the Glacial North Pacific. Science Advances , American Association for
the Advancement of Science (AAAS), 2020, 6 (50), pp.eabd1654. �10.1126/sciadv.abd1654�.
�hal-03088627�
O C E A N O G R A P H Y
Overturning circulation, nutrient limitation,
and warming in the Glacial North Pacific
J. W. B. Rae1*, W. R. Gray1,2, R. C. J. Wills3, I. Eisenman4, B. Fitzhugh5, M. Fotheringham1,
E. F. M. Littley1, P. A. Rafter6, R. Rees-Owen1, A. Ridgwell7, B. Taylor1, A. Burke1
Although the Pacific Ocean is a major reservoir of heat and CO2, and thus an important component of the global
climate system, its circulation under different climatic conditions is poorly understood. Here, we present evidence that during the Last Glacial Maximum (LGM), the North Pacific was better ventilated at intermediate depths and had surface waters with lower nutrients, higher salinity, and warmer temperatures compared to today. Modeling shows that this pattern is well explained by enhanced Pacific meridional overturning circulation (PMOC), which brings warm, salty, and nutrient-poor subtropical waters to high latitudes. Enhanced PMOC at the LGM would have lowered atmospheric CO2—in part through synergy with the Southern Ocean—and supported an
equable regional climate, which may have aided human habitability in Beringia, and migration from Asia to North America.
INTRODUCTION
Ocean circulation exerts a fundamental control on heat transport, marine biological productivity, and ocean-atmosphere CO2
ex-change (1). Today, the North Atlantic and North Pacific have con-trasting circulation regimes, with vigorous deep-water formation in the North Atlantic, but only limited local ventilation in the North Pacific (2–4). This drives distinct patterns of CO2 exchange,
nutri-ent supply, and heat transport in each basin (5) and represnutri-ents a first-order asymmetry in global biogeochemistry and climate (Fig. 1). It has been proposed that the circulation of the North Pacific was markedly different in past cold climates, but no consensus on this change exists. Proxies for ocean ventilation suggest enhanced intermediate water formation under glacial conditions (6–11) and local deep-water formation during Heinrich Stadial 1 (12, 13). However, paired nutrient utilization and productivity proxies in-dicate reduced nutrient supply to the surface during cold climates (14, 15), interpreted as the result of more stratified conditions with reduced ventilation. As the Pacific contains around half of the water in the global ocean and 30 times more carbon than the atmo-sphere, the lack of consensus on its behavior in different climate states represents a major gap in our understanding of the global climate system. Understanding the glacial climate of this region is also of interest for understanding the conditions under which early humans first migrated from Asia to North America around the end of the last ice age (16). Here, we use a compilation of sediment core proxy data for ocean ventilation, biological productivity, tem-perature, and salinity (see the Supplementary Materials for details), paired with Earth system modeling experiments, to shed new light on the circulation of the glacial North Pacific and its regional and global impact.
RESULTS AND DISCUSSION
Data compilation
To examine past changes in ventilation, we use proxies including 13C in benthic foraminifera (6, 17), 14C offsets between benthic
1School of Earth and Environmental Sciences, University of St Andrews, St Andrews,
UK. 2Laboratoire des Sciences du Climat et de l’Environnement (LSCE/IPSL), Université
Paris-Saclay, Gif-sur-Yvette, France. 3Department of Atmospheric Sciences,
Uni-versity of Washington, Seattle, WA 98195, USA. 4Scripps Institution of Oceanography,
University of California, San Diego, La Jolla, CA 92093, USA. 5Department of
Anthropology, University of Washington, Seattle, WA 98195, USA. 6Department of
Earth System Science, University of California, Irvine, Irvine, CA 92697, USA. 7
Depart-ment of Earth Sciences, University of California, Riverside, Riverside, CA 92521, USA. *Corresponding author. Email: jwbr@st-andrews.ac.uk
Copyright © 2020 The Authors, some rights reserved; exclusive licensee American Association for the Advancement of Science. No claim to original U.S. Government Works. Distributed under a Creative Commons Attribution NonCommercial License 4.0 (CC BY-NC). 20˚N 40˚N 60˚N
180˚W 90˚W 0˚ Ocean Data View 32
33 34 35 36 37 20˚N 40˚N 60˚N
180˚W 90˚W 0˚ Ocean Data View 0
0.5 1.0 1.5 2.0
Phosphate (µmol/kg)
Ocean Data View 0
1 2 3 4 180˚W 120˚W 60˚W 0˚ 500 0 p( ) Phosphate (µmol/kg) 000 A B C Salinity 1500 1000 500 500 0 1000 10 10 5 5 Temperature contours
Radiocarbon age contours
Fig. 1. Modern hydrography and nutrient content of the northern Pacific and Atlantic Oceans. (A) Sea surface salinity, with sea surface temperature contours for 5° and 10 °C. (B) Surface phosphate concentration, with a sea surface height contour to denote the subpolar gyre boundary. (C) Subsurface phosphate concentra-tion along a zonal secconcentra-tion indicated by the dashed line in (B), with pre-bomb radiocarbon age contours. Note the relative isolation of the subpolar gyre in the North Pacific, which allows pooling of cold, fresh water in the surface, and old, nutrient- rich waters to upwell from below. In contrast, the active overturning circulation of the North Atlantic flushes warm, salty, nutrient-poor water from the subtropics through the upper reaches of this well-ventilated basin. Salinity, temperature, and phosphate data are gridded annual averages from WOA09; radiocarbon data from Global Ocean Data Analysis Project version 2 [GLODAPv2 (101)]; and sea surface height from (159).
on January 6, 2021
http://advances.sciencemag.org/
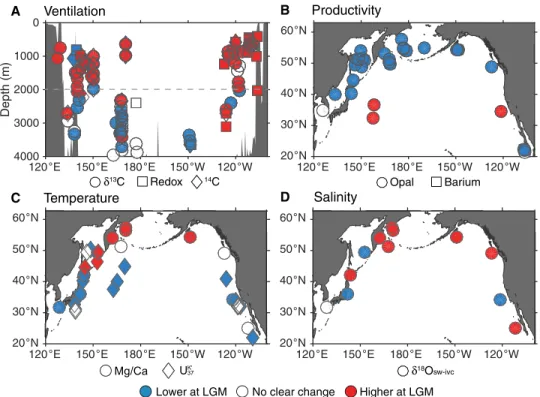
and planktic foraminifera (18, 19), and various redox tracers (7). These data indicate that waters below ~2000 m are poorly ventilated at the Last Glacial Maximum (LGM), with lower 13C, 14C, and oxygen (Figs. 2A and 3). This is consistent with previous interpre-tations of the deep glacial Pacific as a likely store of glacial CO2
(1, 20). In contrast, waters above ~2000 m show enhanced venti-lation (Figs. 2A and 3). This is seen across all tracers, with 73% of the 72 sites above 2000 m indicating increased ventilation, 17% showing no change outside of 1 uncertainty, and only 10% indi-cating reduced ventilation. This suggests a substantial increase in North Pacific Intermediate Water (NPIW) formation at the LGM (6). This result is further supported by profiles of 18O in
ben-thic foraminifera (6, 11): In contrast to the modern, where a smooth and modest increase in 18O with depth suggests a dominantly
diffusive regime, LGM profiles (6, 11) exhibit a notable transition at ~2000-m water depth (Fig. 3A). This indicates a sharp transi-tion in temperature and/or 18Osw, which, as conservative
trac-ers, provide evidence of a physical water mass boundary (21), with increased advection of NPIW overcoming the smoothing influence of diffusion. A local source of intermediate waters in the glacial North Pacific is also supported by meridional sections of benthic 14C age and 13C (Fig. 3 and fig. S3), which show the
spread of well-ventilated waters from the surface into the ocean’s interior.
To examine changes in sea surface temperatures (SSTs), we use Mg/Ca in planktic foraminifera and the alkenone saturation index
UK′37. SSTs in the subtropical gyre are cooler at the LGM, as expected
for glacial conditions, and there is a large midlatitude cooling due to the southward expansion of the subpolar gyre (Fig. 2C and fig. S4) (22). In contrast, LGM temperatures in the subpolar gyre are either similar to or warmer than today (80% of records show warmer tem-peratures or no significant change), with ~2°C warming observed in the western North Pacific (Fig. 2C and figs. S1C and S4) (23, 24). These warm SSTs require a circulation change to counter lower CO2 and greater ice coverage (25) at the LGM and are consistent
with enhanced heat transport by an invigorated Pacific Meridional Overturning Circulation (PMOC).
Sea surface salinity change at the LGM is estimated using 18O in
planktic foraminifera, corrected for temperature using Mg/Ca and for whole-ocean 18O/salinity change. Increased salinity is indicated
throughout the North Pacific subpolar gyre (Fig. 2D and fig. S4), which would have aided intermediate water formation.
To reconstruct changes in export productivity, we use sedimen-tary opal and biogenic barium contents (26). All data poleward of 40°N indicate a reduction in glacial export productivity (Fig. 2B and fig. S1B). However, tracers of nutrient utilization (e.g., 15N) suggest
that biological nutrient drawdown was more complete (15). For more complete nutrient drawdown to be achieved despite reduced export productivity, the pool of available major nutrients (phosphate, nitrate, and silicic acid) must have been smaller (1, 15). This is fur-ther supported by considering that micronutrient (e.g., iron) avail-ability, which partially limits productivity in the North Pacific today,
120°E 150°E 180°E 150°W 120°W
Depth (m) 0 1000 2000 3000 4000
120°E 150°E 180°E 150°W 120°W 20°N
30°N 40°N 50°N 60°N
120°E 150°E 180°E 150°W 120°W 20°N
30°N 40°N 50°N 60°N
120°E 150°E 180°E 150°W 120°W 20°N 30°N 40°N 50°N 60°N B Productivity A Ventilation Opal Barium
No clear change Higher at LGM Lower at LGM δ13C Redox 14C D Salinity C Temperature Mg/Ca U K' 37 δ18Osw-ivc
Fig. 2. Reconstructions of changes in ventilation, export productivity, temperature, and salinity at the LGM relative to the Holocene. Red indicates an increase at the LGM relative to the Holocene, blue a decrease, and white no clear change outside of 1 uncertainty (see the Supplementary Materials for details of data compi-lation). (A) Ventilation proxies, including 13C (circles), radiocarbon (diamonds), and a variety of redox tracers (squares), taken from sites above 20°N. (B) Export
produc-tivity proxies, including sediment core opal (circles) and biogenic barium (squares) contents. (C) Sea surface temperature proxies, including planktic foraminiferal Mg/Ca (circles) and alkenone saturation index UK’37 (diamonds). (D) Change in sea surface salinity, derived from paired 18O and Mg/Ca data on planktic foraminifera,
corrected for whole-ocean 18O and salinity changes due to ice volume. At the LGM, North Pacific intermediate waters are better ventilated, and productivity in the
subpolar North Pacific is lower. An increase in salinity is seen throughout the North Pacific, and although the subtropical gyre cools, the subpolar North Pacific shows an anomalous warming, despite peak glacial conditions. See fig. S1 for an alternative presentation of these data.
on January 6, 2021
http://advances.sciencemag.org/
was enhanced because of higher dust fluxes (27). The decrease in export productivity in the LGM North Pacific thus requires a de-crease in major nutrient supply.
Mechanisms for glacial nutrient limitation
Previous studies have suggested that nutrient limitation in the gla-cial North Pacific was driven by enhanced freshwater stratification in surface waters under a colder climate (14, 15). However, this sug-gestion is difficult to reconcile with our evidence for enhanced in-termediate water formation (Figs. 2A and 3) and saltier, warmer surface waters (Fig. 2, C and D, and fig. S4). An alternative model is thus required for large-scale changes in nutrients and circulation in the northern subpolar basins.
To explore controls on circulation and nutrient supply in the North Pacific, we first consider modern phosphate concentrations in an adaptation of Warren’s box model [(2, 3); the Supplementary Materials], which was previously used to demonstrate that the low salinity that currently stratifies the subpolar North Pacific is a result
of low evaporation rates relative to precipitation, as well as minimal exchange with the saltier subtropical gyre (2–4). Isolation of the subpolar gyre also contributes to high surface nutrients in the mod-ern North Pacific, by limiting the input of low-nutrient water from the subtropics (fig. S5). Although salinity stratification limits the depth of convection, subsurface waters are still brought to the sur-face via wind and tidally driven mixing, wintertime convection, and Ekman suction (5). As these subsurface waters have been long iso-lated in the deep ocean, they are extremely rich in nutrients ac-quired through remineralization, with little input of low-nutrient subtropical water or newly ventilated intermediate water to dilute this potent subsurface nutrient reservoir (Fig. 1C). This contrasts with the North Atlantic, where a less zonal wind-stress pattern and an active overturning circulation supplies warm, salty, and nutrient- poor subtropical water to high latitudes (Fig. 1). Subduction of this water creates nutrient-poor intermediate and deep waters and effectively flushes nutrients from the upper reaches of the modern North Atlantic. C D 0 0.2 0.4 0.6 LGM 14C age 5 4 3 2 1 Depth (km) 5 4 3 2 1 Depth (km) EQ 20˚S 40˚S 20˚N 40˚N 14C years 1000 1500 2000 2500 3000 Modern 14C age 0 0 LGM δ13C Depth (km) 5 4 3 2 1 Depth (km) EQ 20˚S 40˚S 20˚N 40˚N δ13C (‰) Late Holocene δ13C 0 5 4 3 2 1 0 A B Modern LGM 4 3 2 1 2.5 3.0 3.5 4.0 18O ivc (‰) Depth (km) 0.0 1.0 13C (‰) 0.5 4 3 2 1 Depth (km)
Fig. 3. Profiles and meridional sections of proxies for deep ocean circulation. The 18O profile (A) uses Cibicidoides spp. (circles) and Uvigerina spp. (squares), with
Uvigerina data corrected for vital effects by –0.47‰ (160); the 13C profile (B) uses Cibicidoides spp. only; profile data are from the NW Pacific (6). LGM 13C data (in B and
D) and 18O are corrected for the –0.34 and 1‰ whole ocean changes in 13C and 18O
sw (17). Generalized additive model fits are shown for Holocene 13C and 18O
(dashed lines) and LGM 13C (solid line) (161). The thin dotted-dashed line through the LGM 18O data in (A) is the Holocene 18O fit with a +0.6 ‰ offset; while the
Holo-cene 18O profile increases smoothly with depth, the LGM data exhibit a marked transition at ~2000 m, indicative of a water mass boundary. 14C data in (C) are shown as 14C age relative to the contemporaneous atmosphere, with modern data from GLODAPv2 and LGM data from benthic foraminfera (see Materials and Methods for details).
13C section data in (D) are from the western Pacific (17)—see inset map. Locations of sediment core data are shown in black dots and areas of poor data coverage in white, and further details are given in figs. S2 and S3.
on January 6, 2021
http://advances.sciencemag.org/
Thus, today we have two realizations of basin-scale nutrient dy-namics and circulation at high northern latitudes: The Pacific is stratified and poorly ventilated, with cold, fresh, and nutrient-rich surface waters, supplied by upwelling of old, nutrient-rich waters from below, while the Atlantic is well ventilated, with a vigorous overturning circulation that flushes warm, salty, and nutrient-poor waters from the subtropics through its upper reaches. At the LGM, our data show that the North Pacific was better ventilated, had lower nutrients, and was saltier and warmer. This is consistent with a more Atlantic-like circulation regime, with enhanced overturning down to ~2000-m depth.
Modeling experiments
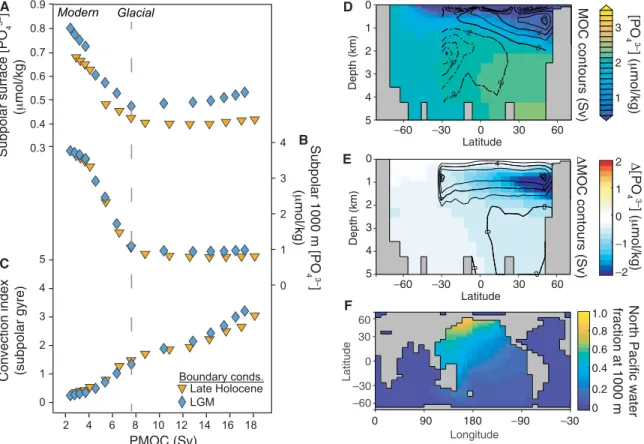
The ability of enhanced overturning to reduce nutrient supply to the surface of the glacial North Pacific is further supported by a se-ries of experiments with an Earth system model (cGENIE) and tests with a simple box model (see the Supplementary Materials). We simulate Pacific overturning in cGENIE by reducing the prescribed transport of fresh water from the North Atlantic to the North Pacific. As the North Pacific gets saltier, its meridional overturning circulation increases (fig. S6), driving a decrease in surface and subsurface nu-trients (Fig. 4 and figs. S5 and S7) due to increasing input of nutrient-
poor subtropical waters. Although convective mixing increases and stratification is reduced (Fig. 4C), the dilution of the subsurface nutrient reservoir by freshly ventilated waters has a much larger ef-fect (Fig. 4 and figs. S5 and S7; see Materials and Methods). This pattern is observed across different model base states and is also seen in the higher-resolution LOVECLIM and UVic Earth system models (fig. S8) (28). Recent work using the Paleoclimate Modelling Intercomparison Project (PMIP3) ensemble shows that Ekman suction in the glacial North Pacific was around 60% higher than today (29). Given this increase in upwelling, a substantial decrease in the nutri-ent contnutri-ent of the upwelled water is required to result in lower sur-face nutrient concentrations; our modeling results show this can be effectively achieved by enhanced overturning circulation.
Pacific overturning and biogeochemistry during other climate states
The presence or absence of a PMOC may help explain biogeochem-ical transitions in other time intervals. For example, the peak in nutrient supply during the Bølling-Allerød warm interval [14.7 to 12.9 thousand years ago (ka)] appears to be associated with an abrupt decrease in PMOC (12, 29), while the decrease in export productivity and increase in SST during intensification of Northern Hemisphere
0.3 0.9 0.8 0.7 0.6 0.5 0.4 0 1 2 3 4
Convection index (subpolar gyre) 0 1 2 4 5 3 2 4 6 8 10 12 14 16 18 PMOC (Sv) Late Holocene LGM Boundary conds. –60 –30 0 30 60 Latitude 5 4 3 2 1 0 Depth (km) 0 0 0 0 4 4 4 8 8 –2 –1 0 1 2 0 0 0 4 4 8 8 –6 -6 –2 –2 –2 –2 Latitude Depth (km) 5 4 3 2 1 0 –60 –30 0 30 60 3 2 1 MOC contours (Sv) Longitude –60 –30 0 30 60 Latitude 0 90 180 –90 –30 0 0.2 0.4 0.6 0.8 1.0 fraction at 1000 m North Pacific water
D E A C B F Modern Glacial
Fig. 4. cGENIE Earth system model experiments illustrating the impact of changes in North Pacific overturning on nutrient concentrations. Each symbol (A to C) represents a 5000-year-long model experiment under preindustrial (orange triangles) or glacial (blue diamonds) boundary conditions. Experiments are forced by decreas-ing the atmospheric freshwater flux into the North Pacific, which increases surface salinity and enhances PMOC (fig. S6). Output is plotted against the maximum meridi-onal stream function in the North Pacific below 280 m. Phosphate concentrations are shown for (A) the surface layer (top 80 m) and (B) intermediate depths (928 to 1158 m) in the subpolar gyre (grid cells spanning 43°N to 66°N and 115°W to 225°W). Convection frequency (C), a count of convection events throughout the water column per model time step, is shown for the same region. Meridional sections of phosphate concentration (shading) at 165°W and Pacific meridional overturning stream function (contours) are shown in (D), for an experiment with a salinity forcing of −0.19 Sv and a PMOC of 8 Sv [indicated by a dashed line in (A) to (C)] that produces the best fit to our LGM data (Fig. 5 and fig. S10); anomalies of phosphate and overturning from the glacial base state are shown in (E); and the spread of North Pacific water at 1000-m depth, predominantly on the basin’s western boundary, is shown in (F).
on January 6, 2021
http://advances.sciencemag.org/
glaciation ~2.7 million years ago (14) could be explained by in-creased PMOC, analogous to the change from modern to LGM conditions. We note that, as a transient condition, the onset of deep-water formation can lead to a short-lived peak in surface nu-trients and CO2, as convection initially taps into high-nutrient
sub-surface waters before they have been replaced with well-ventilated low-nutrient waters (fig. S9); this remains a likely explanation for North Pacific pH, 13C, and 14C excursions (12) during Heinrich
Stadial 1 (HS1; ~17.5 to 16.0 ka). However, the typical pattern under steady-state conditions—both in paleo records and our mod-eling—appears to be that increased overturning drives a decrease in nutrient supply (Fig. 4).
The dynamics of a glacial PMOC
Increased ventilation of the North Pacific at the LGM would be fa-cilitated by an increase in the salinity of subpolar surface waters (2, 3), as implied by the available data (Fig. 2D and fig. S4). Higher salinity in the glacial North Pacific may be driven by reduced net precipitation (P-E), due to a weakened hydrological cycle under globally cooler conditions (30), and a southward shift in storm track precipitation (31). Increased Ekman suction in the presence of the Laurentide ice sheet (29) would also bring up salt from subsurface waters. Salinity may be further elevated by increased exchange with the saltier subtropical gyre, due to an intensification of the westerly winds in response to the Laurentide ice sheet (22, 29), or as a Stommel feedback to an initial increase in overturning (32). Although an in-crease in SST would, in isolation, dein-crease the density of surface waters, this may be overcome by an increase in salinity, in part re-sulting from enhanced evaporation and divergent moisture trans-port (2); the combination of increased SST and increased North Pacific ventilation is indeed found in ocean circulation models (figs. S7 and S11). Last, it is possible that seasonal sea ice formation and brine rejection play a role (8, 25), in particular, in helping to set the local sites of downwelling, which are likely to be in the marginal
seas (10). Enhanced sea ice production may be reconciled with warmer SSTs either by a difference in seasonality or if sea ice pro-duction occurs predominantly in coastal settings (8). Although ba-sin geometry and a closed Bering Strait may, in part, limit salinity in the North Pacific (4), our proxy reconstructions show that local ventilation to intermediate depths is indeed possible, a result also found in the higher-resolution NCAR CCSM3 and GFDL CM2Mc models under some instances of colder climate conditions (figs. S11 and S12).
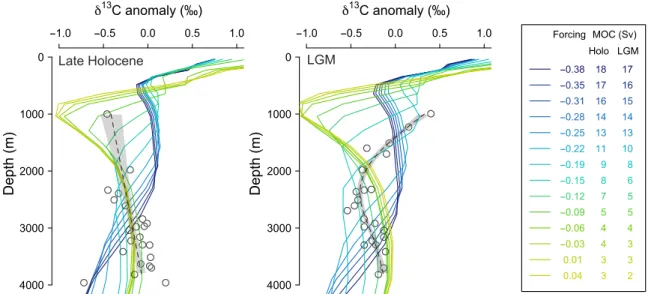
Comparing reconstructed 13C profiles and other ventilation data with cGENIE output (Fig. 5 and fig. S10) suggests a PMOC of around 8 Sv at the LGM, which is also consistent with the changes seen in SST (fig. S7). Note, however, that the PMOC cell remains largely above 2000 m and within the Pacific basin in our cGENIE experiments (fig. S7), in contrast with Atlantic Meridional Over-turning Circulation (AMOC) at similar overOver-turning rates. 13C values
in the intermediate North Pacific also remain lower than those in the glacial North Atlantic (fig. S13). These observations may, in part, be explained by the much greater volume of the Pacific, which increases the residence time of northern-sourced waters within the basin, and allows remineralization and mixing with southern- sourced waters to exert greater influence. While glacial AMOC may have remained higher than PMOC, the LGM’s overturning circula-tion, with northern-fed cells in both basins to ~2000 m overlying southern-sourced waters, was substantially more symmetrical than today. It is possible that this more symmetrical glacial circulation is the most common configuration of the overturning circulation during the late Pleistocene, with today’s asymmetric mode limited to peak interglacial conditions.
Impact of PMOC on CO2
Enhanced PMOC would have increased the North Pacific’s influ-ence on the glacial carbon cycle and climate (Fig. 6). Today, the North Pacific is a High Nutrient Low Chlorophyll zone, with an
-1.0 -0.5 0.0 0.5 1.0 13C anomaly (‰) 4000 3000 2000 1000 0 Depth (m) Late Holocene -1.0 -0.5 0.0 0.5 1.0 13C anomaly (‰) 4000 3000 2000 1000 0 Depth (m) LGM Forcing -0.38 -0.35 -0.31 -0.28 -0.25 -0.22 -0.19 -0.15 -0.12 -0.09 -0.06 -0.03 0.01 0.04 17 16 15 14 13 10 8 6 5 5 4 3 3 2 MOC (Sv) Holo LGM 18 17 16 14 13 11 9 8 7 5 4 4 3 3
Fig. 5. Simulated 13C profiles in cGENIE compared to benthic 13C data in the NW Pacific. Data (6) are shown as symbols with a general additive model fit shown by
the gray dashed line. cGENIE simulations are given by the colored lines. To aid comparison, all profiles are shown as 13C anomalies from the mean 13C for each profile.
Left: Late Holocene data and the experiments run under preindustrial boundary conditions. Right: LGM data and experiments run under glacial boundary conditions. The legend lists the maximum North Pacific overturning for each experiment. The upper portion of the LGM 13C profile shows the closest match to the simulation run with
an Atlantic to Pacific freshwater forcing of −0.19 Sv, which has a PMOC of 8 Sv. As the lower portions of the profiles likely remain ventilated by Southern Ocean waters, and as we have not made any changes to the Southern Ocean in our simulations, some offset at depth is to be expected.
on January 6, 2021
http://advances.sciencemag.org/
inefficient biological pump and high CO2 outgassing. By reducing
the carbon content of the high-latitude North Pacific, an invigorated PMOC would have helped stem this CO2 leak, as indicated by boron
isotope data, which show LGM surface ocean CO2 close to
equilib-rium with the atmosphere (29). Furthermore, these changes in the surface ocean would have had a greater impact on the net ocean CO2 storage, because enhanced intermediate water formation would
lower the preformed nutrient content of the ocean’s interior. Com-bining our cGENIE results with a simple scaling between preformed phosphate and atmospheric CO2 (33) shows that atmospheric CO2
is relatively sensitive to modest increases in PMOC and suggests CO2 drawdown on the order of ~16 parts per million (ppm) (see
Materials and Methods and fig. S14). CO2 drawdown may be
fur-ther enhanced by PMOC’s impact on biogeochemistry in the Southern Ocean (34). Today, carbon-rich waters recirculated from the Pacific upwell in the Southern Ocean and contribute to high surface nutrients and CO2 outgassing in this region. Replacing a
portion of this upwelling water with well-ventilated glacial NPIW reduces the carbon and nutrient supply to the Southern Ocean surface (see Earth system model results in fig. S8), thus increasing the effi-ciency of the Southern Ocean biological pump and further lowering atmospheric CO2. This process may help explain the similarity in
nutrient utilization records from the North Pacific and Southern Oceans [the “polar twins” (35)]. If enhanced glacial PMOC results from increased sea ice and ice sheet size, then this would provide a feedback between Northern Hemisphere insolation and atmospheric CO2, linking the orbital pacing of the ice ages to global glacial
cli-mate change.
Regional warming in Beringia due to enhanced PMOC
The relatively mild regional climate supported by heat transport from an enhanced PMOC may have implications for the first
hu-man migration to the Americas. Recent genetic studies suggest that the founding population of early Native North and South Americans were isolated from other, future Asian populations during the LGM, before dispersing into and through the American continents (16). This isolation is thought to have been located in northeastern Siberia or on the now submerged Bering Sea shelf, lasting between 7000 and 15,000 years (36) during what is known as the “Beringian standstill.” Some terrestrial records support the interpretation that this region was an ecological refugium, with spruce, birch, and alder pollen and fossil insects providing evidence of a relatively mild and maritime climate (37). However, given the extremely cold conditions further inland (38), it has remained unclear how habitable conditions could have been maintained. Our data and modeling suggest that an enhanced overturning circulation helped warm this region at the LGM, countering the influence of lower greenhouse gasses and higher albedo, to bring Pacific Beringian temperatures up to, or even warmer than, modern (Fig. 2C and figs. S1C and S4). Warm-ing may have been particularly enhanced durWarm-ing LGM winters, as seen in CCSM3 (fig. S11B), which shows that for a mean annual temperature change of ~2°C in the glacial northwest Pacific (similar to our reconstructions), winter warming may have been around 6°C. An enhanced Pacific overturning circulation could have thus aided human habitation in Beringia during a period of refuge before migration to North America.
MATERIALS AND METHODS
Ventilation data
Sediment core proxy data for ventilation at the LGM includes 13C data on benthic foraminifera, tracers of sedimentary redox, and ra-diocarbon age offsets between benthic and planktic foraminifera, taken from sites above 20°N in the North Pacific (with a version above 40°N shown in fig. S1A). Stable carbon isotope data (13C) (6, 9, 11, 39–53) on benthic foraminifera of the genus Cibicides are largely taken from the recent synthesis by Peterson et al. (17), sup-plemented with recent studies (9, 53). Where possible, we compare foraminiferal data for the LGM (19 to 23 ka) and late Holocene (0 to 6 ka). At sites where Holocene foraminiferal data are not available (24 of 62), we use seawater 13C data taken from the PACIFic ocean Interior CArbon (PACIFICA) database (52), with values interpo-lated for these core sites using the three-dimensional estimation tool in Ocean Data View [ODV, (54)], except at Keigwin’s (6) depth transect in the NW Pacific and Max’s (9, 53) sites in the Bering Sea, where we use the accompanying water column measurements. Both approaches show an increase in 13C at intermediate depths. To ac-count for whole-ocean change in 13C at the LGM (attributed to a
smaller terrestrial biosphere), and thus better reveal patterns of change in circulation, we correct LGM 13C values by +0.34‰ (17).
We then calculate the LGM minus Holocene 13C difference, with positive values indicating higher 13C and increased ventilation
at the LGM. We use a threshold value of ±0.1‰ for a significant increase/decrease in 13C when comparing LGM and Holocene
foraminiferal data, based on 1 SD of replicate samples of benthic foraminifera from the NW Pacific (6). When comparing LGM foram 13C to modern water 13C, we use a threshold value of 0.2‰, to account for calibration error [e.g., (42)] and the sparseness of water column 13C data in this region.
Redox reconstructions (55–79) follow the approach and compi-lation of Jaccard and Galbraith (7), who estimated whether oxygen
LGM
CO2
Modern
STG SPG
CO2
Fig. 6. Schematic of ocean circulation and productivity in the modern and LGM North Pacific. The modern North Pacific (left) lacks vigorous local ventilation (thin black arrows), because of low salinity in surface waters of the subpolar gyre (SPG). This is a result of high net precipitation (P-E) and minimal exchange with the saltier waters of the subtropical gyre (STG). The modern subpolar North Pacific is thus dominated by upwelling of nutrient- and CO2-rich subsurface waters (gray
vertical arrow), driving relatively high export productivity (green wavy arrows) and CO2 outgassing. During the LGM (right), our data compilation suggests that
venti-lation at intermediate depths was enhanced, export productivity was reduced, and subpolar surface waters were saltier and warmer (red wavy arrows). This is consist-ent with an invigorated meridional overturning circulation, with enhanced forma-tion of intermediate waters and advecforma-tion of warm, salty, and nutrient-depleted subtropical waters to high latitudes, analogous to a shallower version of the over-turning circulation seen in the modern North Atlantic.
on January 6, 2021
http://advances.sciencemag.org/
concentrations increased or decreased at the LGM (defined in their study to be 20 to 22 ka) compared to Holocene (5 to 10 ka). Redox proxies include trace metals, sediment laminations, assemblages of benthic foraminifera, and nitrogen isotopes from regions of modern denitrification. Following Jaccard and Galbraith (7), redox changes based on nitrogen isotopes are plotted at 400 m to reflect the depth of water column denitrification. We use the published thresholds for significant change in redox, quoted as approximately 1 SD.
Radiocarbon data (12, 20, 53, 70, 76, 80–100) are taken largely from syntheses by (13, 18–20). Glacial data shown in Fig. 2A consist of 14C age offsets between benthic and planktic foraminifera from the same sample and include data with calendar ages in the window 18 to 23 ka. Holocene benthic-planktic 14C data are rare in this region be-cause of poor carbonate preservation, so we compare LGM benthic- planktic offsets to deep-surface offsets in water column 14C. These are calculated from nearby deep-water 14C data from GLODAPv2
(101) and a surface water age of 400 14Cyr south of the subpolar gyre boundary (43°N) and 700 14Cyr within the subpolar gyre. The
thresh-old for a significant change at the LGM is the quadratic combination of 14Cyr 1-SE measurement uncertainties on LGM benthic and
plank-tic 14C data and a 200-14Cyr uncertainty on modern deep-surface offsets, and averages 289 14Cyr. The section view in Fig. 3C uses the
datasets listed above with benthic data shown as age offsets from the contemporaneous atmosphere (102). Note that despite their varying influences and sources of uncertainty, each set of ventila-tion proxy data shows the same patterns of change at the LGM, with enhanced ventilation at intermediate depths and reduced ventilation in the abyss.
Productivity data
Biogenic opal and barium data (26, 59, 74, 76, 87, 103–118) were taken from the compilation of Kohfeld and Chase (26) and supple-mented with recent data from (12, 15, 87, 119–122). LGM and Ho-locene mean values and SEs were calculated from data in the time windows 0 to 10 ka (Holocene) and 19 to 23 ka (LGM). A significant change is noted when the difference between the LGM and Holo-cene means exceeds the quadratic sum of their 1-SE values. Sedi-mentary opal (%) and barium (ppm) content are shown in Fig. 2B. Where available, published mass accumulation rate estimates of these biogenic components are shown in fig. S1B, largely based on sediment core age models (from 18O and 14C) and dry bulk density (either measured or estimated); fluxes based on 230Th are indicated
with bold symbol outlines (fig. S1B). Each of these treatments of the data indicates reduced export productivity in the LGM subpolar North Pacific.
Temperature and salinity data
Published records of planktic foraminiferal Mg/Ca and 18O calcite
(24, 29, 82, 87, 123–127), UK′37 (112, 113, 128–135) covering the
Holocene (0 to 10 ka) and LGM (19 to 21 ka) were collated for the North Pacific, spanning both the subpolar and subtropical gyres. All age models are as given in the original publication. All Mg/Ca were recalibrated (see below). UK′37 temperatures are as given in
the original publication. For both Mg/Ca and UK′
37, temperature
change during the LGM is given as a difference to proxy-derived temperature in the Holocene.
We recalibrated the published Mg/Ca data using the “MgCaRB” approach, as detailed in (136), which accounts for changes in the non-thermal influences of salinity and pH downcore. For Globigerinoides
ruber and Globigerina bulloides, we use the species-specific
equa-tions from (136). For Neogloboquadrina pachyderma, we use the species-specific sensitivities given in (137), which we incorporate into the MgCaRB protocol (note that N. pachyderma Mg/Ca ap-pears insensitive to pH). While the direct temperature sensitivity of Mg/Ca in planktic foraminifera is ~6%/°C (136), because of the ef-fect of temperature on pH through the disassociation constant of water (Kw), the “apparent” Mg/Ca temperature sensitivity is higher
in pH-sensitive species (138). The MgCaRB approach accounts for the mean changes in surface salinity (due to sea level) and pH (due to atmospheric CO2) downcore, iteratively solving Mg/Ca and
pCO2 to overcome the covariance induced by the thermal effect on
Kw. Our approach does not account for local changes in salinity/pH;
however, as local salinity and pH changes in both increase during the LGM, their effects on Mg/Ca work against each other, such that the bias on reconstructed temperature are likely to be small (a local 1–practical salinity unit (PSU) salinity and 0.05–pH unit increase would sum to zero temperature bias). Dissolution can also affect foraminiferal Mg/Ca, although this influence is thought to be rela-tively minor in lower-Mg planktic foraminifera such as N. pachyderma (139), the species analyzed most frequently in the high latitudes. LGM-Holocene changes in bottom water carbonate ion concentra-tion are also relatively minor within the deep Pacific, decreasing by ~10 mol kg−1) during the LGM (140). Hence, although
dissolu-tion is unlikely to have a significant influence on changes in SST calculated from changes in Mg/Ca, the slight decrease in glacial bottom water carbonate ion concentration within the Pacific (140) would result in an apparent cooling in Mg/Ca SSTs. If we consider the sign of change in the secondary influences on Mg/Ca (local salinity, pH, and dissolution) from Holocene to LGM, then the warming signal that we see in Mg/Ca SSTs during the LGM is likely to be a conserv ative estimate; hence, the increase in ice volume– corrected seawater 18O (salinity) that we see is also likely to be a conservative estimate. For UK′
37, the change in temperature at
each site was calculated using the calibrations given in the original publications (141, 142); the temperature range in this study is too low to be significantly influenced by the nonlinearity of UK′37
at >~24° (143).
The change in ice volume–corrected 18O of seawater (18Osw-ivc)
was calculated from samples with paired measurements of Mg/Ca and 18Ocalcite. We use the change in temperature calculated from
the Mg/Ca values (described above) and the temperature-18O
frac-tionation factor of (144) to remove the temperature signal from 18Ocalcite. The effect of sea level was accounted for using the
whole-ocean glacial 18Osw change of 1‰ (145) scaled to the sea level
re-cord of (146). Note that the ice volume correction on 18O accounts
for the fact that whole-ocean salinity was higher at the LGM; thus, an increase in 18O
sw-ivc represents an increase in salinity beyond
the whole-ocean salinity increase.
We calculate the change in temperature and 18O
sw-ivc between the
Holocene (0 to 10 ka) and LGM (19 to 21 ka) time slices for each record individually, with the change in temperature defined against the average for the Holocene. For five sites, we use the interval 0 to 11.5 ka for the Holocene and/or 17.9 to 21 ka for the LGM, and these sites are marked with a gray outline in Fig. 2C and fig. S1C; exclud-ing these sites makes no difference to any of the conclusions drawn. We note that the use of data of early Holocene (which is relatively warm compared to the late Holocene and preindustrial; fig. S4) (147) within our Holocene time window means that the estimate of
on January 6, 2021
http://advances.sciencemag.org/
LGM warming is again likely to be conservative. An increase/ decrease is indicated by a change of >±1°C for Mg/Ca, >±1.2°C for UK′37, and >±0.25‰ for 18Osw-ivc. These thresholds
corre-spond to the uncertainties associated with the temperature proxies (136, 141, 142) and the equivalent in 18O (144).
Time windows
Our data compilations take advantage of available syntheses of data from the North Pacific where available, supplemented with recently published data. Time slices selected for the LGM in these syntheses, as detailed above, are fairly consistent. Holocene time slices show more variety although, in each case, aim to most accurately repre-sent postglacial Holocene conditions. For 13C, this requires that the glacial-interglacial whole-ocean/atmosphere/biosphere change is complete, which was only achieved in the late Holocene. For some redox proxies, core-top values are liable to disturbance, so an early Holocene slice may be more appropriate. Late Holocene car-bonate preservation in the North Pacific is poor, limiting Holocene proxy records based on planktic foraminifera. As a result, LGM benthic-planktic 14C data are compared to modern values from the
water column. Last, as noted above, the use of early Holocene data within our LGM to Holocene temperature comparison is likely to underestimate the magnitude of LGM warming compared to pre-industrial, given the warmth of the early Holocene (147), so the LGM warming signal seen in Fig. 2C and figs. S1C and S4 is likely to be conservative. We also provide a 13C profile for a time slice ~3000 years
older than the original LGM pick in fig. S2, which demonstrates that the enhanced ventilation signal is robust to age model uncer-tainties, and cannot be attributed to aliasing of an HS1 signal.
Box model
We use an adaptation of Warren (2) and Emile-Geay et al.’s (3) sa-linity budget for the North Pacific subpolar gyre to explore controls on salinity and nutrients in this region. The model considers a mass balance for water in a subpolar gyre box, representing latitudes 43°N to 63°N, longitudes 140°E to 120°W, and water depth 0 to 200 m, with inputs from the subtropical gyre (VSTG), upwelling (VUP), net
precipitation (P-E), and riverine runoff (R). Salinity of the subpolar gyre (SSPG) is calculated from the ratio of inputs of salt to inputs
of water
S SPG = S ───────────────UP V UP + S STG V STG V UP + V STG + (P − E ) + R
and depends on the salinity of subtropical input (SSTG) and
upwell-ing water (SUP). For the derivation of this equation, see (2) and (3).
We follow the same approach to model phosphate concentration in the subpolar gyre (PO43−SPG)
PO 43− SPG = PO 4 3− UP V UP + PO 43− STG V STG ───────────────── V UP + V STG + (P − E ) + R
using the volume transport terms and box definitions as described above and substituting salinity for phosphate concentrations in the subtropics (PO43−STG) and in upwelled waters (PO43−UP). Note that
this formulation considers only phosphate supply by ocean advec-tion and does not attempt to model removal by productivity. As a result, our modeled phosphate concentrations are equivalent to winter values before significant drawdown in the spring bloom.
We use Emile-Geay’s (3) estimates of advective transport from the subtropical gyre and upwelling, Wills and Schneider’s (148) es-timates of P-E and R (taken from ERA-Interim reanalysis), and sa-linity and phosphate concentrations for subtropical and upwelled waters from World Ocean Atlas, computed using the box averaging tool in Ocean Data View (149). Following Warren (2), we consider only advection and do not attempt to account for the influence of diffusion or eddy flux, which have large uncertainties for salinity and are poorly constrained for phosphate. We checked this assump-tion with an estimate of phosphate eddy flux, based on the eddy transport terms determined by Emile-Geay (3) for salinity and using regional phosphate gradients. This made little difference (<5%) to our results, as the resulting values were small, and the supply of phosphate by vertical eddy flux is countered by the influence of nutrient- poor water from horizontal eddy flux. We use Warren’s approach (2) to obtain subtropical and upwelling salinity and phosphate values with minimal influence from eddy exchange with water from the subpolar gyre, by excluding values immediately adjacent to the subpolar gyre. Our subtropical surface values use a box spanning 24°N to 40°N, 135°E to 115°W, and depths 0 to 200 m, and our upwelling values are taken from 2000 m, with the same latitude and longitude bounds as the surface subpolar box. All model input values are given in table S2.
The model accurately reproduces the salinity of the modern North Pacific subpolar gyre (33.0). The model gives phosphate in the subpolar gyre of 2.0 mol/kg, slightly higher than annual average values of 1.8 mol/kg in the modern North Pacific, but matching February (prespring bloom) values of 2.0 mol/kg. The influence of possible glacial conditions is shown in fig. S5 and table S1. Subpolar salinity increases when (i) net precipitation is reduced, (ii) upwell-ing is increased, and (iii) exchange with the subtropics is enhanced, particularly when subtropical salinity is elevated. Phosphate con-centrations in the subpolar gyre are reduced by exchange with the subtropics and by decreasing the phosphate concentrations of upwelled waters and are increased by increasing the upwelling flux. However, the increase in the upwelling flux has less impact on surface phosphate than the reduction of the phosphate concentration of the upwelled water; indeed, the net effect of doubling vertical exchange while halving subsurface nutrients is similar to that of halving subsur-face nutrients alone (fig. S5). Because the wind- and tidally driven transfer of water from the subsurface to the surface North Pacific is high, vertical nutrient gradients are relatively low, so further increase in vertical exchange (e.g., with reduced stratification) has less influ-ence than decreasing the nutrient content of the upwelled water, as a result further substantiated by Earth system modeling (see below).
cGENIE Earth system model
To explore the impact of enhanced North Pacific overturning on nutrients and tracers in more detail, we ran a series of sensitivity tests with the “muffin” release of the cGENIE Earth system model (150). cGENIE consists of a three-dimensional frictional geos-trophic ocean circulation model, two-dimensional sea ice and energy-moisture balance atmospheric models and incorporates representations of the marine geochemical cycling of carbon and other biologically mediated tracers (151). We use cGENIE with a 36 × 36 equal-area horizontal resolution and 16 vertical levels, with highest vertical resolution toward the ocean surface. Ocean physics and carbon cycle configuration are as described and evaluated in (150), with the addition of iron colimitation on marine productivity (152). Despite its coarse resolution, cGENIE successfully reproduces
on January 6, 2021
http://advances.sciencemag.org/
many of the large-scale features of marine biogeochemical cycles in the present-day (150, 151). Of particular relevance to this study, cGENIE predicts nutrient (PO43−) distributions in the North Pacific
that are in agreement with present-day observations (151). The coarse resolution also allows cGENIE to be run efficiently and a broad parameter space to be explored: here, we show 28 × 5000–year runs for two sets of boundary conditions.
To test the potential influence of background climate state on our results, we ran experiments under preindustrial and glacial boundary conditions. To simulate a glacial climate state, we reduced the radiative forcing consistent with concentrations of the major greenhouse gases (CO2, CH4, and N2O of 191 ppm, 350 parts per
billion (ppb), and 216 ppb, respectively; 153–155). In addition, we increased the zonally averaged planetary albedo profile in the Northern Hemisphere and increased average ocean salinity by ~1 PSU, similar to that used in (12). Our experiments start from the end of 20,000-year equilibrium spin-ups carried out with prescribed atmospheric CO2
of 278 ppm, 13C of −6.50‰, and 14C of 0‰. The same prescribed
atmospheric CO2 concentration and isotopic compositions are used
for both preindustrial and glacial boundary conditions, so that the size of the ocean-atmosphere carbon inventory is similar across our experiments. Radiative forcing by CO2 is set independently of the
actual concentration of atmospheric CO2 calculated by the ocean-
atmosphere biogeochemistry modules and is held constant at either preindustrial or glacial levels as described above.
To simulate an increase in North Pacific ventilation, we reduced the prescribed transfer of atmospheric fresh water from the Atlantic to the Pacific, which implicitly accounts for the net moisture trans-port between these basins (156, 157). We ran 28 total experiments under preindustrial and glacial boundary conditions, with a range of freshwater transport anomalies from 0.04 to −0.38 Sv. Experi-ments were run for 5000 years, which allows ocean circulation and nutrient concentrations to stabilize, with <2% change in mean global surface PO43− over the last 500 years of the simulations.
The decrease in atmospheric freshwater transport from the Atlantic to the Pacific increases PMOC and reduces AMOC. The re-distribution of surface salinity also changes deep-water formation in the Southern Ocean, in turn changing biological pump efficiency. Each of these processes may change atmospheric CO2, and
decon-volving their individual influences is beyond the scope of this study. To place broad constraints on changes in pCO2 due to enhanced
PMOC, we calculate changes in the ocean’s preformed phosphate inventory resulting from increased input of NPIW and use the the-oretical scaling of Ito and Follows (33) to estimate the pCO2 impact.
We use a dye tracer to calculate the volumetric contribution of North Pacific waters to the ocean’s interior and use the end-member preformed phosphate composition of the grid box with the maxi-mum contribution of NPIW. We assume that this NPIW replaces water in the Pacific’s interior that has a preformed phosphate of 1.4 µmol/kg (158) and calculate the resulting difference in pre-formed phosphate inventory by mass balance. The results of this mass balance calculation are shown in fig. S14, with contours showing the general relationship between NPIW volume, preformed phosphate, and pCO2 change, and symbols showing the
realiza-tions found in our cGENIE simularealiza-tions. With enhanced PMOC, the preformed phosphate content of NPIW decreases, as nutrients are flushed from the subpolar gyre, and this low-phosphate water occupies a greater ocean volume, thus increasing the net efficiency of the biological pump and decreasing atmospheric CO2. To estimate
the cGENIE scenario most representative of LGM conditions in the North Pacific, we compare modeled 13C profiles in the NW Pacific
to the data (Fig. 5 and fig. S10). An overturning rate of 8 Sv, found with an Atlantic to Pacific freshwater forcing anomaly of −0.19 Sv, best matches the shape of the LGM 13C profile (Fig. 5) and also shows a good match to observed changes in 13C, redox, and 14C
across the basin (fig. S10). We thus estimate a change in pCO2 of
~16 ppm as a result of enhanced PMOC at the LGM. However, we note that the influence of changes in ocean circulation and pre-formed nutrient inventory on pCO2 may vary depending on
circu-lation regime in the Southern Ocean (34), and that other processes, including sea ice and carbonate compensation, will also influence CO2 but are not captured by this treatment. Further work is
re-quired to constrain the impact of PMOC on pCO2 in more detail.
SUPPLEMENTARY MATERIALS
Supplementary material for this article is available at http://advances.sciencemag.org/cgi/ content/full/6/50/eabd1654/DC1
REFERENCES AND NOTES
1. D. M. Sigman, M. P. Hain, G. H. Haug, The polar ocean and glacial cycles in atmospheric CO2 concentration. Nature 466, 47–55 (2010).
2. B. A. Warren, Why is no deep water formed in the North Pacific? J. Mar. Res. 41, 327–347 (1983). 3. J. Emile-Geay, M. A. Cane, N. Naik, R. Seager, A. C. Clement, A. van Geen, Warren revisited: Atmospheric freshwater fluxes and “why is no deep water formed in the North Pacific”. J. Geophys. Res. 108, 3178 (2003).
4. D. Ferreira, P. Cessi, H. K. Coxall, A. de Boer, H. A. Dijkstra, S. S. Drijfhout, T. Eldevik, N. Harnik, J. F. McManus, D. P. Marshall, J. Nilsson, F. Roquet, T. Schneider, R. C. Wills, Atlantic-Pacific asymmetry in deep water formation. Annu. Rev. Earth Planet. Sci. 46, 327–352 (2018).
5. J. L. Sarmiento, N. Gruber, M. A. Brezinski, J. P. Dunne, High-latitude controls of thermocline nutrients and low latitude biological productivity. Nature 427, 56–60 (2004).
6. L. D. Keigwin, Glacial-age hydrography of the far northwest Pacific Ocean. Paleoceanography 13, 323–339 (1998).
7. S. L. Jaccard, E. D. Galbraith, Large climate-driven changes of oceanic oxygen concentrations during the last deglaciation. Nat. Geosci. 5, 151–156 (2011). 8. K. P. Knudson, A. C. Ravelo, North Pacific Intermediate Water circulation enhanced by
the closure of the Bering Strait. Paleoceanography 30, 1287–1304 (2015).
9. L. Max, N. Rippert, L. Lembke-Jene, A. Mackensen, D. Nürnberg, R. Tiedemann, Evidence for enhanced convection of North Pacific Intermediate Water to the low-latitude Pacific under glacial conditions. Paleoceanography 32, 41–55 (2016).
10. M. S. Cook, A. C. Ravelo, A. Mix, I. M. Nesbitt, N. V. Miller, Tracing subarctic Pacific water masses with benthic foraminiferal stable isotopes during the LGM and late Pleistocene. Deep Sea Res. II Topical Stud. Ocean. 125–126, 84–95 (2016).
11. K. Matsumoto, T. Oba, J. Lynch-Stieglitz, H. Yamamoto, Interior hydrography and circulation of the glacial Pacific Ocean. Quat. Sci. Rev. 21, 1693–1704 (2002). 12. J. W. B. Rae, M. Sarnthein, G. L. Forster, A. Ridgwell, P. M. Grootes, T. Elliot, Deep water
formation in the North Pacific and deglacial CO2 rise. Paleoceanography 29, 645–667 (2014). 13. Y. Okazaki, A. Timmermann, L. Menviel, N. Harada, A. Abe-Ouchi, M. O. Chikamoto,
A. Mouchet, H. Asahi, Deepwater formation in the North Pacific during the last glacial termination. Science 329, 200–204 (2010).
14. D. M. Sigman, S. L. Jaccard, G. H. Haug, Polar ocean stratification in a cold climate. Nature
428, 59–63 (2004).
15. H. Ren, A. S. Studer, S. Serno, D. M. Sigman, Glacial-to-interglacial changes in nitrate supply and consumption in the subarctic North Pacific from microfossil-bound N isotopes at two trophic levels. Biogeosciences 30, 1217–1232 (2015).
16. E. Tamm, T. Kivisild, M. Reidla, M. Metspalu, D. G. Smith, C. J. Mulligan, C. M. Bravi, O. Rickards, C. Martinez-Labarga, E. K. Khusnutdinova, S. A. Fedorova, M. V. Golubenko, V. A. Stepanov, M. A. Gubina, S. I. Zhadanov, L. P. Ossipova, L. Damba, M. I. Voevoda, J. E. Dipierri, R. Villems, R. S. Malhi, Beringian standstill and spread of Native American founders. PLOS ONE 2, e829–e826 (2007).
17. C. D. Peterson, L. E. Lisiecki, J. V. Stern, Deglacial whole-ocean 13C change estimated from 480 benthic foraminiferal records. Paleoceanography 29, 549–563 (2014). 18. N. Zhao, O. Marchal, L. Keigwin, D. Amrhein, G. Gebbie, A synthesis of deglacial deep-sea
radiocarbon records and their (In)Consistency with modern ocean ventilation. Paleoceanogr. Paleoclimatol. 33, 128–151 (2018).
on January 6, 2021
http://advances.sciencemag.org/
19. L. C. Skinner, F. Primeau, E. Freeman, M. de la Fuente, P. A. Goodwin, J. Gottschalk, E. Huang, I. N. McCave, T. L. Noble, A. E. Scrivner, Radiocarbon constraints on the glacial ocean circulation and its impact on atmospheric CO2. Nat. Commun. 8, 16010 (2017). 20. L. D. Keigwin, S. J. Lehman, Radiocarbon evidence for a possible abyssal front near 3.1 km
in the glacial equatorial Pacific Ocean. Earth Planet. Sci. Lett. 425, 93–104 (2015). 21. D. C. Lund, J. F. Adkins, R. Ferrari, Abyssal Atlantic circulation during the Last Glacial
Maximum: Constraining the ratio between transport and vertical mixing. Paleoceanography 26, PA1213 (2011).
22. W. R. Gray, R. C. J. Wills, J. W. B. Rae, A. Burke, R. F. Ivanovic, W. H. G. Roberts, D. Ferreira, P. J. Valdes, Wind-driven evolution of the north pacific subpolar gyre over the last deglaciation. Geophys. Res. Lett. 47, 208–212 (2020).
23. N. Harada, O. Seki, A. Timmermann, H. Moossen, J. Bendle, Y. Nakamura, K. Kimoto, Y. Okazaki, K. Nagashima, S. A. Gorbarenko, A. Ijiri, T. Nakatsuka, L. Menviel, M. O. Chikamoto, A. Abe-Ouchi, S. Schouten, Sea surface temperature changes in the Okhotsk Sea and adjacent North Pacific during the last glacial maximum and deglaciation. Deep Sea Res. II Top. Stud. Oceanogr. 61-64, 93–105 (2012). 24. J.-R. Riethdorf, L. Max, D. Nürnberg, L. Lembke-Jene, R. Tiedemann, Deglacial
development of (sub) sea surface temperature and salinity in the subarctic northwest Pacific: Implications for upper-ocean stratification. Paleoceanography 28, 91–104 (2013). 25. M. Méheust, R. Stein, K. Fahl, R. Gersonde, Sea-ice variability in the subarctic North Pacific
and adjacent Bering Sea during the past 25 ka: New insights from IP25 and Uk′37 proxy records. Ark. Dent. 4, 1–19 (2018).
26. K. E. Kohfeld, Z. Chase, Controls on deglacial changes in biogenic fluxes in the North Pacific Ocean. Quat. Sci. Rev. 30, 3350–3363 (2011).
27. S. Serno, G. Winckler, R. F. Anderson, E. Maier, H. Ren, R. Gersonde, G. H. Haug, Comparing dust flux records from the Subarctic North Pacific and Greenland: Implications for atmospheric transport to Greenland and for the application of dust as a chronostratigraphic tool. Paleoceanography 30, 583–600 (2015).
28. L. Menviel, M. H. England, K. J. Meissner, A. Mouchet, J. Yu, Atlantic-Pacific seesaw and its role in outgassing CO2 during Heinrich events. Paleoceanography 29, 58–70 (2014). 29. W. R. Gray, J. W. B. Rae, R. C. J. Wills, A. E. Shevenell, B. Taylor, A. Burke, G. L. Foster,
C. H. Lear, Deglacial upwelling, productivity and CO2 outgassing in the North Pacific Ocean. Nat. Geosci. 11, 340–344 (2018).
30. I. M. Held, B. J. Soden, Robust responses of the hydrological cycle to global warming. J. Climate 19, 5686–5699 (2006).
31. J. M. Lora, J. L. Mitchell, A. E. Tripati, Abrupt reorganization of North Pacific and western North American climate during the last deglaciation. Geophys. Res. Lett. 43, 11796–11804 (2016). 32. H. Stommel, Thermohaline convection with two stable regimes of flow. Tellus 13,
224–230 (1961).
33. T. Ito, M. J. Follows, Preformed phosphate, soft tissue pump and atmospheric CO2. J. Mar. Res.
63, 813–839 (2005).
34. M. P. Hain, D. M. Sigman, G. H. Haug, Carbon dioxide effects of Antarctic stratification, North Atlantic Intermediate Water formation, and subantarctic nutrient drawdown during the last ice age: Diagnosis and synthesis in a geochemical box model. Global Biogeochem. Cycles 24, GB4023 (2010).
35. G. H. Haug, D. M. Sigman, Palaeoceanography: Polar twins. Nat. Geosci. 2, 91–92 (2009). 36. K. E. Graf, I. Buvit, Human dispersal from Siberia to Beringia: Assessing a Beringian
standstill in light of the archaeological evidence. Curr. Anthropol. 58, S583–S603 (2017). 37. V. D. Meyer, J. Hefter, G. Lohmann, L. Max, R. Tiedemann, G. Mollenhauer, Summer
temperature evolution on the Kamchatka Peninsula, Russian Far East, during the past 20 000 years. Clim. Past 13, 359–377 (2017).
38. M. Melles, J. Brigham-Grette, P. S. Minyuk, N. R. Nowaczyk, V. Wennrich, R. M. De Conto, P. M. Anderson, A. A. Andreev, A. Coletti, T. L. Cook, E. Haltia-Hovi, M. Kukkonen, A. V. Lozhkin, P. Rosén, P. Tarasov, H. Vogel, B. Wagner, 2.8 million years of Arctic climate change from Lake El'gygytgyn, NE Russia. Science 337, 315–320 (2012).
39. J. C. Herguera, T. Herbert, M. Kashgarian, C. Charles, Intermediate and deep water mass distribution in the Pacific during the Last Glacial Maximum inferred from oxygen and carbon stable isotopes. Quat. Sci. Rev. 29, 1228–1245 (2010).
40. J. Lynch-Stieglitz, R. G. Fairbanks, C. D. Charles, Glacial-interglacial history of Antarctic Intermediate Water: Relative strengths of Antarctic versus Indian Ocean sources. Paleoceanography 9, 7–29 (1994).
41. L. D. Stott, M. Neumann, D. Hammond, Intermediate water ventilation on the Northeastern Pacific Margin during the Late Pleistocene inferred from benthic foraminiferal 13C. Paleoceanography 15, 161–169 (2000).
42. J.-C. Duplessy, N. J. Shackleton, R. K. Matthews, W. Prell, W. F. Ruddiman, M. Caralp, C. H. Hendy, 13C Record of benthic foraminifera in the last interglacial ocean: Implications for the carbon cycle and the global deep water circulation. Quatern. Res. 21, 225–243 (1984). 43. D. H. Andreasen, M. Flower, M. Harvey, S. Chang, A. C. Ravelo, Data report: Late
Pleistocene oxygen and carbon isotopic records from sites 1011, 1012, and 1018. Proc. ODP Sci. Results 167, 141–144 (2000).
44. E. A. Boyle, Cadmium and 13C paleochemical ocean distributions during the stage 2 glacial maximum. Annu. Rev. Earth Planet. Sci. 20, 245–287 (1992).
45. T. Oba, M. Murayama, M. Yamauchi, M. Yamane, S. Oka, H. Yamamoto, Oxygen isotopic ratio of foraminiferal tests in marine sediment cores collected during “Mirai” MR97-04 cruise. JAMSTEC-R, (1999).
46. M. Lyle, I. Koizumi, C. Richter, R. J. Behl, P. Boden, J.-P. Caulet, M. L. Delaney, P. deMenocal, M. Desmet, E. Fornaciari, A. Hayashida, F. Heider, J. Hood, S. A. Hovan, T. R. Janecek, A. G. Janik, J. Kennett, D. Lund, M. L. Machain C., T. Maruyama, R. B. Merrill, D. J. Mossman, J. Pike, A. C. Ravelo, G. A. Rozo Vera, R. Stax, R. Tada, J. Thurow, M. Yamamoto, Sites 1010 and 1011, in Proceedings of the Ocean Drilling Program, Initial Reports, R. N. Riegel, Ed. (Ocean Drilling Program, 1997), vol. 167, pp. 49–173.
47. C. Sancetta, M. Lyle, L. Heusser, R. Zahn, J. P. Bradbury, Late-glacial to holocene changes in winds, upwelling, and seasonal production of the northern California current system. Quatern. Res. 38, 359–370 (1992).
48. University of Cambridge, “Delphi”, https://www.esc.cam.ac.uk/images/research-images/ research-group/research-projects/delphi.
49. L. Wang, M. Sarnthein, H. Erlenkeuser, J. Grimalt, P. Grootes, S. Heilig, E. Ivanova, M. Kienast, C. Pelejero, U. Pflaumann, East Asian monsoon climate during the Late Pleistocene: High-resolution sediment records from the South China Sea. Mar. Geol. 156, 245–284 (1999).
50. S. A. Hovan, D. K. Rea, N. G. Pisias, Late Pleistocene continental climate and oceanic variability recorded in northwest Pacific sediments. Paleoceanography 6, 349–370 (1991).
51. R. Zahn, A. Rushdi, N. G. Pisias, B. D. Bornhold, B. Blaise, R. Karlin, Carbonate deposition and benthic 13C in the subarctic Pacific: Implications for changes of the oceanic carbonate system during the past 750,000 years. Earth Planet. Sci. Lett. 103, 116–132 (1991). 52. T. Suzuki, M. Ishii, M. Aoyama, J. R. Christian, K. Enyo, T. Kawano, R. M. Key, N. Kosugi,
A. Kozyr, L. A. Miller, A. Murata, T. Nakano, T. Ono, T. Saino, K.-i. Sasaki, D. Sasano, Y. Takatani, M. Wakita, C. L. Sabine, PACIFICA Data Synthesis Project. (ORNL/CDIAC-159, 2013); 10.3334/CDIAC/OTG.PACIFICA_NDP092.
53. L. Max, L. Lembke-Jene, J.-R. Riethdorf, R. Tiedemann, D. Nürnberg, H. Kühn, A. Mackensen, Pulses of enhanced North Pacific Intermediate Water ventilation from the Okhotsk Sea and Bering Sea during the last deglaciation. Clim. Past 10, 591–605 (2014).
54. R. Schlitzer, Ocean Data View (2010); http://odv.awi.de.
55. K. G. Cannariato, J. P. Kennett, Climatically related millennial-scale fluctuations in strength of California margin oxygen-minimum zone during the past 60 k.y. Geology 27, 975–978 (1999).
56. T. S. Ivanochko, T. F. Pedersen, Determining the influences of Late Quaternary ventilation and productivity variations on Santa Barbara Basin sedimentary oxygenation: A multi-proxy approach. Quat. Sci. Rev. 23, 467–480 (2004).
57. I. L. Hendy, T. F. Pedersen, Is pore water oxygen content decoupled from productivity on the California Margin? Trace element results from Ocean Drilling Program Hole 1017E, San Lucia slope, California. Paleoceanography 20, PA4026 (2005).
58. W. E. Dean, Sediment geochemical records of productivity and oxygen depletion along the margin of western North America during the past 60,000 years: Teleconnections with Greenland Ice and the Cariaco Basin. Quat. Sci. Rev. 26, 98–114 (2007). 59. A. S. Chang, T. F. Pedersen, I. L. Hendy, Late Quaternary paleoproductivity history
on the Vancouver Island margin, western Canada: A multiproxy geochemical study. Can. J. Earth Sci. 45, 1283–1297 (2008).
60. Y. Zheng, A. van Geen, R. F. Anderson, J. V. Gardner, W. E. Dean, Intensification of the northeast Pacific oxygen minimum zone during the Bölling-Alleröd warm period. Paleoceanography 15, 528–536 (2000).
61. R. S. Ganeshram, T. F. Pedersen, S. E. Calvert, G. W. McNeill, M. R. Fontugne, Glacial-interglacial variability in denitrification in the world's oceans: Causes and consequences. Paleoceanography 15, 361–376 (2000).
62. T. J. Nameroff, S. E. Calvert, J. W. Murray, Glacial-interglacial variability in the eastern tropical North Pacific oxygen minimum zone recorded by redox-sensitive trace metals. Paleoceanography 19, PA1010 (2004).
63. R. J. Behl, J. P. Kennett, Brief interstadial events in the Santa Barbara basin, NE Pacific, during the past 60 kyr. Nature 379, 243–246 (1996).
64. K. G. Cannariato, J. P. Kennett, R. J. Behl, Biotic response to late Quaternary rapid climate switches in Santa Barbara Basin: Ecological and evolutionary implications. Geology 27, 63–66 (1999).
65. E. Emmer, R. C. Thunell, Nitrogen isotope variations in Santa Barbara Basin sediments: Implications for denitrification in the eastern tropical North Pacific during the last 50,000 years. Paleoceanography 15, 377–387 (2000).
66. W. E. Dean, The geochemical record of the last 17,000 years in the Guaymas Basin, Gulf of California. Chem. Geol. 232, 87–98 (2006).
67. H. Cheshire, J. Thurow, A. J. Nederbragt, Late Quaternary climate change record from two long sediment cores from Guaymas Basin, Gulf of California. J. Quat. Sci. 20, 457–469 (2005).
68. T. M. Hill, J. P. Kennett, D. K. Pak, R. J. Behl, C. Robert, L. Beaufort, Pre-Bølling warming in Santa Barbara Basin, California: Surface and intermediate water records of early deglacial warmth. Quat. Sci. Rev. 25, 2835–2845 (2006).
on January 6, 2021
http://advances.sciencemag.org/