Digital Transformation for Flexible Last Mile Distribution
by
Krishna V Kuppuswamy
B.E., Production Engineering, PSG College of Technology, India
SUBMITTED TO THE PROGRAM IN SUPPLY CHAIN MANAGEMENT IN PARTIAL FULFILLMENT OF THE REQUIREMENTS FOR THE DEGREE OF
MASTER OF APPLIED SCIENCE IN SUPPLY CHAIN MANAGEMENT AT THE
MASSACHUSETTS INSTITUTE OF TECHNOLOGY June 2021
© 2021 Krishna V Kuppuswamy. All rights reserved.
The authors hereby grant to MIT permission to reproduce and to distribute publicly paper and electronic copies of this capstone document in whole or in part in any medium now known or hereafter created. Signature of Author: ____________________________________________________________________
Krishna V Kuppuswamy Department of Supply Chain Management
May 14, 2021
Certified by: __________________________________________________________________________ Dr. María Jesús Sáenz Executive Director, Supply Chain Management Blended Program Capstone Advisor
Certified by: __________________________________________________________________________ Dr. Ozden Tozanli Postdoctoral Associate, Digital Supply Chain Transformation Capstone Co-Advisor
Accepted by: __________________________________________________________________________ Prof. Yossi Sheffi Director, Center for Transportation and Logistics Elisha Gray II Professor of Engineering Systems Professor, Civil and Environmental Engineering
Digital Transformation for Flexible Last Mile Distribution
by
Krishna V Kuppuswamy
Submitted to the Program in Supply Chain Management on May 14, 2021 in Partial Fulfillment of the
Requirements for the Degree of Master of Applied Science in Supply Chain Management
ABSTRACT
Flexibility in last-mile distribution has become a key differentiator for companies that are obsessed with driving up customer experience. For most fast-moving consumer goods (FMCG) companies like BeverageCo, it is crucial to succeed in fast-growing emerging economies which are dominated by the traditional retail channel, characterized by small stores. With this channel contributing to more than 90% of BeverageCo’s customer base, and its tremendous growth potential, digital transformation to drive flexibility in last-mile distribution is no longer a choice but a mandate. However, the path to digital transformation and the metrics to measure the ‘value’ behind flexible last-mile distribution remains a challenge for BeverageCo. With ‘value creation’ at the core of this transformation, this project implements a Value Stream Mapping (VSM) methodology to map the current and future state of distribution value stream. VSM helps identify the gaps, system inefficiencies, and the metrics impacted in the current state; leverages simulation-based future state design and a multi-criteria-decision-model to assess the digital capabilities required for the transformation. This approach resulted in the design of a 4 to 6-hour distribution model (as against the current 31-hour distribution), with minimal changes to the processes and investments required to run the operations. With clear definition of metrics to measure ‘value’ behind flexibility, the outcomes suggest that more than 90% of the customers will benefit from this flexible and expedited distribution, at a high value-to-cost ratio. This project unlocks the value of digitalization with a frugal investment of time and money versus conventional large scale business transformations.
Capstone Advisor: Dr. María Jesús Sáenz
Title: Executive Director, Supply Chain Management Blended Program
Capstone Co-Advisor: Dr. Ozden Tozanli
ACKNOWLEDGMENTS
I would like express sincere gratitude to my MIT advisors Maria Jesús Sáenz and Ozden Tozanli for their support and wisdom in guiding me through this interesting and challenging project. Thank you, Maria and Ozden for your invaluable guidance throughout this project.
I would also like to thank BeverageCo SMEs for their incredible support and guidance throughout this project. Their depth of knowledge about BeverageCo processes and their tireless efforts in providing several data points was key in shaping the design and outcomes of this project.
Lastly, deepest gratitude to my wife Lakshmi and my son Ram, who backed me through several challenging personal situations and encouraged me to see through the finish line.
Table of Contents
1 INTRODUCTION ... 8
BeverageCo’s background ... 9
Motivation ... 11
2 Literature Review ... 13
Digital Transformation imperatives ... 13
Value Stream Mapping ... 14
Simulation-based Future State Value Stream Design ... 14
Multi-criteria-decision-model (MCDM) ... 15
How is this framework relevant for BeverageCo? ... 16
3 Methodology ... 17
Current state Value Stream Mapping ... 18
3.1.1 Data Gathering ... 18
3.1.2 Understanding As-is business processes & digital capabilities. ... 19
3.1.3 Benchmarking KPIs ... 20
3.1.4 Building VSM for the current Information and Product flow ... 22
3.1.5 Identifying gaps in the current value stream and the reasons behind ... 23
Creating the Vision for future state ... 25
3.2.1 Vision for flexible last mile distribution ... 25
3.2.2 Establishing target channels for flexible distribution ... 25
Realizing the vision for future state value stream ... 27
3.3.1 Critical success factors and the key flexibility drivers to realize the vision ... 27
3.3.2 Drivers of flexibility – mapping and scoring ... 28
Future state value stream design ... 29
3.4.1 Feasibility analysis of the flexibility in the current distribution model ... 30
3.4.3 What it takes to make a 4-hour distribution model work? ... 33
3.4.4 Future state value stream design for flexible distribution model ... 34
3.4.5 Measuring ‘value’ behind flexibility ... 38
MCDM based Digital Transformation drivers’ prioritization. ... 40
4 Results and Analysis ... 41
Simulation input parameters and scenarios ... 41
4.1.1 Simulation results ... 42
Multi-criteria-decision-model (MCDM) – feasibility assessment & prioritization ... 44
4.2.1 Feasibility assessment – Technology, Process and Organizational change impact ... 44
4.2.2 TOPSIS decision matrix for Multi-dimensional evaluation ... 46
5 Managerial Insights and Recommendations... 48
Summary of the key project outcomes ... 48
What it takes to transform to the future state? ... 48
What is the ‘value’ behind flexibility? ... 49
Roadmap for future - Implementation recommendations ... 49
6 CONCLUSION ... 51
Future research opportunities ... 51
REFERENCES ... 53
Appendix A. Multi-criteria-decision-model (MCDM) – feasibility assessment & prioritization ... 55
LIST OF TABLES
Table 1: BeverageCo’s Last Mile Distribution – Key KPIs ... 21
Table 2: Key takeaways for the product flow gap-analysis ... 24
Table 3: BeverageCo’s customer categories (Strategic Directories) & its need for flexibility ... 26
Table 4: Critical success factors and the key flexibility drivers ... 28
Table 5: Drivers of Flexibility – mapping and scoring ... 29
Table 6: Feasibility analysis – critical observations and changes needed. ... 31
Table 7: What does it take to make a flexible distribution model work? ... 34
Table 8: Metrics to measure ‘Value’ ... 39
Table 9: Simulation Input parameters ... 41
Table 10: Simulation Scenarios ... 41
Table 11: Simulation scenarios with 8-hour distribution ... 42
Table 12: Simulation scenarios and Output parameters ... 43
Table 13: MCDM – Technology feasibility analysis ... 45
Table 14: MCDM – Feasibility analysis - normalized values ... 45
Table 15: TOPSIS decision matrix with normalized values ... 46
Table 16: TOPSIS – Final ranking of flexibility drivers ... 47
Table 17: Flexibility drivers – mapping and scoring ... 55
Table 18: MCDM – Technology feasibility analysis ... 56
Table 19: MCDM – Process change feasibility analysis ... 57
Table 20: MCDM – Organizational change feasibility analysis ... 57
Table 21: MCDM – Feasibility analysis - normalized values ... 58
Table 22: TOPSIS decision matrix for multi-dimensional evaluation ... 59
Table 23: TOPSIS decision matrix with normalized values (rij matrix) ... 60
Table 24: TOPSIS decision matrix of positive & negative ideal values. ... 61
Table 25: TOPSIS – Positive Ideal Matrix ... 62
Table 26: TOPSIS – Negative Ideal Matrix ... 62
LIST OF FIGURES
Figure 1: BeverageCo’s current & future state (vision) business model ... 10
Figure 2: Detailed view of the Project Methodology ... 17
Figure 3: Methodology for diagnosing the current state. ... 18
Figure 4: BeverageCo’s distribution process flow ... 19
Figure 5: BeverageCo’s current last-mile distribution KPIs ... 20
Figure 6: BeverageCo’s current last-mile distribution process flow ... 22
Figure 7: Gap analysis of the Information flow of distribution process ... 23
Figure 8: Gap analysis of the Product flow of distribution process ... 24
Figure 9: Feasibility analysis of flexibility in the current distribution model ... 30
Figure 10: Simulation Input parameters and multiple scenario paths ... 33
Figure 11: Simulation Scenarios ... 33
Figure 12: As-Is Order processing & Route planning. ... 35
Figure 13: To-Be Order processing & Route planning ... 35
Figure 14: As-is and To-be value streams in flexible distribution model... 36
Figure 15: End-to-end Order to Delivery flow in flexible distribution model ... 38
1 INTRODUCTION
While fast-moving consumer goods (FMCG) companies around the world have been perpetually challenged with change and disruption, today’s pandemic environment has put a giant spotlight on the inflexible, often broken, supply chains due to siloed processes and disparate systems. There is an expedited need for pursuing Digital Transformation to improve the flexibility and resilience of supply chains (Saenz, 2020).
Elon Musk once said, “The supply chain stuff is really tricky,” and he was referring to the growing complexity of global supply chains, making it difficult for large enterprises to anticipate risk, monitor progress, and forecast trends that impact customer service (Flex.com, 2018). With growing uncertainties and ever-changing market dynamics, companies across the globe need to rethink their value proposition in order to continuously innovate, deliver superior products, services and experiences to their customers and consumers. This new value proposition calls for a paradigm shift from a focus on pure cost-cutting and operational efficiencies to visionary digital value propositions. This value proposition must reassess how digital technologies and information can enhance an organization’s existing assets and capabilities to create new customer value, to redefine business, and possibly even redefine the industry its operating in (Ross, 2017).
Digital transformation is no longer a buzzword: it is fast becoming a mandate for organizations to thrive in this pandemic environment. With an array of powerful game-changing technologies like social, mobile, cloud, analytics, internet of things and cognitive computing available today, companies need to adapt and learn quickly to take advantage of these technologies. Digital Transformation will lay the foundation for reimagining business, defining new experiences for customers by identifying the right technologies to deliver the new supply chain capabilities like flexibility, resilience, responsiveness, visibility, and collaboration that have become the new order of the day.
Flexibility is a critical capability not just to navigate through supply chain disruptions but also to deliver enhanced value to customers Especially in the era of instant gratification (led by Amazon and other digitally native companies), there is a growing pressure for FMCG companies to deliver the same day or within a few hours or at the time that is most convenient to their customers. In fast-growing emerging economies, often characterized by small retail stores, flexible distribution has become a default expectation. For most FMCG companies, it is crucial to succeed in fast-growing emerging economies as this contributes to a significant portion of their revenues and future growth. Emerging economies are
developing nations with an increasing middle class, driven by economic liberalization (Hoskisson et al., 2000). Flexibility in distribution is key to capture the growing consumer goods market in emerging economies effectively.
There is an added complexity in last-mile distribution in emerging economies due to the large presence of traditional retail channel, characterized by small retail stores, often referred to as ‘nanostores’ (Fransoo et al., 2017). With high degree of fragmentation and limited storage capacity, traditional channel retailers tend to order lower quantities and more frequently, further increasing the distribution complexity (Winkenbach, 2020).
Companies attempting to build flexible last-mile distribution deploy consolidation points (proximity fulfillment centers) and multi-echelon distribution networks with a range of facility types (dark stores, micro fulfillment centers among others), with multi-modal last-mile delivery. However, these initiatives involve significant changes to network design and investments in fixed assets. The digital innovations available today like predictive analytics, dynamic demand allocation and intelligent routing provide huge scope for generating significant ‘value’ with minimal changes to the current network, systems, and processes. The key here is to establish the vision, define ‘value’, identify the new supply chain capabilities, and baseline the digital capabilities that will help realize the vision. Companies running successful digital transformations start with a humble curiosity to explore, pilot new ideas in a fail-fast mode, and set the foundation for continuous innovation and value creation.
BeverageCo’s background
BeverageCo is a multinational multi-category beverage leader enabled by its complex supply chain. BeverageCo has grown through acquisitions, which has led to a lack of standardization of processes across countries.
BeverageCo operates in a dynamic market that includes modern and traditional retail channels, restaurants, among others, where there is a constant change in consumer demand. Additionally, more than 90% of BeverageCo’s customers (~50,000) are from traditional retail channels (mom & pop stores, referred as ‘nanostores’) with a small store footprint and large concentration in urban areas. The small size and financial limitations faced by traditional retail channels force them to place frequent orders in small quantity, resulting in significant complexity in last-mile distribution.
Customer satisfaction is core to BeverageCo’s value system; hence the company continuously seeks opportunities to raise its bar with service levels and customer delight. Flexibility in distribution is one of the key strategic areas for BeverageCo to drive up customer satisfaction and growth. BeverageCo understands that the flexibility in distribution would entail changing current business processes and having different types of fulfillment centers to be able to deliver to its customers when it is most convenient to them, be it same-day delivery or on the specific day and time they choose.
A market survey of the beverage industry indicates growth at around 8-12% in LATAM region (Statista 2021). Given the strategic nature of the traditional retail channel and its growth potential, it is important for BeverageCo to bring in flexible last-mile distribution not only as a lever to raise customer satisfaction, but also to set the foundation to build scale and to adopt a customer-centric and demand-driven supply chain as shown in Figure 1.
Figure 1:
Motivation
BeverageCo’s vision is to become the best-in-class provider to its customers, and distribution is one of the key strategic areas for BeverageCo to drive a customer-centric and demand-driven supply chain strategy. Customer-centric supply chain strategy demands a high degree of flexibility in the distribution to be able to deliver to customers when it is most convenient to them. Also, with 90+% of BeverageCo’s customers in the traditional retail format (with a small footprint and large concentration in urban areas), flexible last-mile distribution becomes a critical differentiator.
In the last few years, there has been a big drive at BeverageCo for transforming the distribution process with the goal of improving customer-centricity and making it more demand-driven to improve flexibility. However, these initiatives did not deliver the expected outcomes as they lacked an overarching strategy and a clear path to transformation. Also, BeverageCo leaders have been challenged with a lot of questions to justify the time and effort required for driving flexible last-mile distribution. This project is focused on finding the answers to some of these key questions that concern BeverageCo:
• What is the ‘value’ behind flexibility in distribution and how could it be measured? • What is the impact (of flexibility) on the current distribution network and processes? • How would this transformation impact the people in the warehouses and delivery points? • What are the new capabilities needed at the warehouses to drive flexibility in distribution? • How easy or difficult it is to implement this change and how would it impact costs of distribution? These are the key questions that motivate BeverageCo to define a digital transformation path, to determine the impact on the current systems, processes and people involved, and most importantly to develop key metrics to measure the ‘value’ behind flexibility.
Typically, transformation projects to enable flexible distribution consider network redesign and related investments in fixed assets. However, digital maturity in the last-mile distribution has grown tremendously in the last few years, providing huge scope for generating ‘value’ for organizations like BeverageCo with minimal changes to the current systems and processes. Though this project recognizes the need for network design and optimization as a long-term strategic solution, the primary focus of this project is to identify the digital drivers to extract maximum flexibility within the current network design. This digitalization would involve fine tuning the information flow and product flow with new digital capabilities, thereby minimizing the impact on processes, people, and costs of distribution.
With this motivation, this project implements a Value Stream analysis to map end-to-end connectivity in distribution network, identify the gaps in information flow and product flow, determine the digital capabilities needed to fill the gaps and baseline key performance indicators and priorities influencing the value delivered to the organization and its customers.
In this regard, Value Stream Mapping (VSM) is leveraged to map the current state of interconnected value streams and to identify the gaps, system inefficiencies and the business/value metrics impacted in the current state. Drawing on this deep understanding of the current distribution model, Simulation-based Future State Value Stream Design is built based on iterations of multiple (realistic) future scenarios, and the key digital drivers to enable this transformation are identified. Also, a Multi-Criteria-Decision-Model (MCDM) is used to assess the feasibility and fitness of these digital drivers to BeverageCo, based on their impact to technology (ease of implementation and integration to current systems), process changes, and organizational readiness to adapt to the new distribution model.
Considering the nature and complexity of BeverageCo operations in a diverse set of markets, this project scope is limited to the Brazil market, one of the largest and the most complex markets that could provide the opportunity to identify the key challenges and build a robust model that other markets can benefit from.
2 Literature Review
This chapter reviews the existing literature on Digital Transformation, Value Stream Mapping (VSM), Simulation-based future-state value stream design and Multi-Criteria-Decision-Model. This study will introduce the concepts and terminologies that will be used throughout the project.
Digital Transformation imperatives
Digital Transformation could open a new paradigm for companies to redefine its business and possibly even an industry. To become digital, companies must define a visionary value proposition to reimagine new supply chain capabilities that leverages digital technologies, existing assets, and organizational capabilities to create new customer value. (Ross, 2017).
Data connectivity is another critical component needed for successful digital transformations. This includes building the data foundation, the plumbing needed for connecting enterprise systems, and designing cognitive and predictive capabilities to provide insights throughout the value chain. Successful transformations mandate organizations to have a well-defined digital strategy, courage to take calculated risks and maniacal focus on creating value. Some of the key digital transformation imperatives are (Catlin et. al, 2015):
• Crafting a vision to reimagine new capabilities.
• Establishing a clear value proposition – value to both internal and external stakeholders. • Senior management commitment – to review, govern and bring in required investments. • PMO for holistic change management that helps with cultural alignment, prioritization, risk
management, and conflict resolution.
• Cross-functional collaboration with an inclusive and participative ecosystem.
• Defining KPIs and KLIs (Key Learning Indicators) – that help in defining what success looks like as an outcome of the transformation journey.
• Building the Data Foundation – that can provide the right real-time data.
• Digital Transformation Office – that helps in selecting the right technology and partners, to achieve the value proposition.
• Creating a Data Science COE – that helps in shaping data-driven analytics.
• Setting up a fail-fast, learn-quick culture with the spirit of continuous innovation and value creation.
Digital transformation needs a paradigm shift in thinking of how an organization leverages technology, people, and processes to reimagine their value propositions (Westermann, 2020).
BeverageCo’s vision is to transform its distribution as the source of competitive advantage, to drive customer centricity and deliver value. Digital transformation is a key priority for BeverageCo to realize its vision and set the foundation for continuous value creation.
This project will implement Value Stream Mapping (VSM) to map current and future state of interconnected value streams. VSM will help identify the gaps, system inefficiencies and the business / value metrics impacted in the current state and define the value-adding activities that will contribute to Digital Transformation of the last-mile distribution.
Value Stream Mapping
Value steam refers to a collection of information and product flow sequences that is required to deliver goods or services to a customer or an end consumer. Value stream mapping (VSM) is a powerful organization transformation tool that helps in visualizing complex systems to identify gaps and recommend changes to optimize information and product flow (Martin and Osterling, 2014).
VSM helps in breaking down a complex business process into simple stream of activities to better understand the bottlenecks in the current state and to design a future state value stream that can result in improved lead time and optimized product flow (Kayakutlu, et. al., 2004).
However, typical value stream maps provide only a static analysis of a system, without reflecting on the system behavior for various realistic scenarios of future. Hence it is important to integrate VSM with simulation-based analysis to visualize the future state under different constraints and assess the impact to the performance metrics (Liu and Yang, 2020).
Simulation-based Future State Value Stream Design
Simulation is a powerful tool to stress test the future state behavior of a value stream in a short time frame without having to make large investments in time and cost. Integrating VSM and simulation provides a realistic view of the future state, to help understand the feasibility and impact to critical performance metrics. Also, simulation of the VSM allows iteration of multiple real-time scenarios without the constraints of process limitations or system limitations in the current state. VSM and simulation
together provides a holistic view of the future state and its alignment to the overall vision of the transformation initiative (Alzubi et al. 2019).
With this understanding, this project leveraged both VSM and simulation to map the current value stream and design future state value stream based on the simulation outcomes for multiple real-time scenarios.
The simulation approach involves setting up a base scenario, replicating the current state value stream with necessary constraints like distribution point locations, customer locations, number of orders to be delivered by each distribution point, time to deliver, type of vehicles to use, vehicle capacity, among others Once the base scenario is established and the results closely mimic the current state performance outcomes, then it is easy to run multiple ‘what-if’ anlaysis for future state scenarios by fine tuning a combination of input variables and comparing the outcomes with that of the base scenario to understand
the impact of each scenario to the performance metrics (Ivanov, 2019).
Multi-criteria-decision-model (MCDM)
With digital transformation as the foundation for value creation, and with multiple digital solutions available to reach the destination, it is important to identify appropriate digital tools that are best fit for purpose and can scale for more complex scenarios in future. This challenge requires multi-dimensional/criteria, and decision-making models that integrates the aspirations of the subject matter experts at BeverageCo and literature review of insights from the researchers and thought leaders in this domain. In this regard, multi-criteria-decision-model will be leveraged to identify the technical, process and organizational change levers that aligns with the digital transformation drivers in realizing the vision (Beyaz and Yıldırım, 2020).
This framework leverages the future state value stream design and the simulation outcomes to define the key digital drivers that are relevant for the transformation. The significance level of these drivers (impact to the performance outcomes) is mapped and scored by BeverageCo subject matter experts (SMEs) for evaluating the appropriateness of digital transformation tools for future state value design.
While performance outcomes are critical in assessing the digital drivers, there are other dimensions such as technology (ease of implementation and integration to current system), process change and organizational readiness that are critical in this fitment assessment. However, it is difficult establish a quantitative assessment approach on these parameters and hence it is needed to utilize qualitative evaluations based on the scores and ratings from BeverageCo SMEs.
MCDM is integrated with a prioritization framework -- Technique for Order of Preference by Similarity to Ideal Solution (TOPSIS) -- that will help determine the final set of flexibility drivers that are key to this transformation. TOPSIS framework works on the principle of prioritizing the alternatives that are close to ideal solution. This framework is typically used along with MCDM to assess the fitment of multiple solution options qualitatively and quantitatively (Pagone, et al., 2020).
TOPSIS prioritization framework involves building decision matrix for each digital driver, against each feasibility dimension by measuring the similarity to ideal solution. To measure the variation of each decision point (digital driver) of each feasibility dimension (technology, process, and organization), from the positive ideal (best fit) and negative ideal (least fit) solution set, Euclidian distance approach is used. This approach helps in determining the ‘relative closeness’ to ideal solution for each digital driver and to baseline the critical drivers to enable the transformation (Beyaz and Yıldırım, 2020).
How is this framework relevant for BeverageCo?
The primary focus of this project is to establish a digital transformation strategy for flexible last-mile distribution. This involves understanding the current distribution value stream, identifying the gaps, defining the digital drivers that are best fit for purpose and finally designing the future state value stream that meets the objective of flexible last-mile distribution.
Value stream mapping helps in understanding the current information flow and the product flow, the digital and process limitations, the gaps that need to be addressed to realize the vision. Given the dynamic nature of the distribution model at BeverageCo, it is important to integrate simulation with VSM to design the future state value stream for different realistic scenarios.
MCDM along with TOPSIS decision framework, helps in prioritizing the key digital drivers that are best fit for purpose to realize the vision. This approach not only uses the performance outcomes of each digital driver but also helps assess the feasibility and value of each digital driver based on its ease of integration with current systems at BeverageCo, ease of implementation with minimal impact to processes and ease of adoption for the people involved in the distribution function.
3 Methodology
BeverageCo’s vision is to transform the supply chain as the source of competitive advantage, to drive customer centricity and deliver value. Distribution is one of the key strategic areas for BeverageCo that is critical to drive customer-centric and demand-driven supply chain strategy.
With ‘value creation’ at the core of this transformation, this project will implement a Value Stream Mapping (VSM) methodology to map current and future state of interconnected value streams. VSM will help identify the gaps, system inefficiencies and the metrics impacted in the current state and define the value-adding activities that will contribute to Digital Transformation for flexible last mile distribution. Considering the dynamic nature and complexity of BeverageCo distribution model, it is essential to extend Value Stream Mapping with simulation-based future state design that addresses the operational nuances and takes into account the current process limitations, digital maturity, and value to be realized. Figure 2 shows the stages of the methodology used in this project to define the future state value stream design and the core set of digital transformation drivers that enable flexible last-mile distribution.
Figure 2:
Considering the nature and complexity of BeverageCo operations in a diverse set of markets, it is essential to identify a pilot market for Value Stream Mapping, which becomes a representative sample for implementation across other markets. This project scope is limited to the Brazil market, one of the largest and the most complex markets that could provide the opportunity to identify the key challenges and build a robust model that other markets can benefit from.
Current state Value Stream Mapping
Diagnosis of the as-is state of BeverageCo is the foundation for the entire project. Understanding the company’s current process and digital maturity will help identify opportunities and gaps in the last mile execution with a focus on flexibility and the value associated. Figure 3 depicts the critical steps involved in this analysis.
Figure 3:
Methodology for diagnosing the current state.
3.1.1 Data Gathering
To understand the current situation of BeverageCo, meetings were conducted with BeverageCo’s supply chain executives, specifically in the distribution function. This provided insights into the company’s priorities, digital capabilities, processes, actors, and technologies. Based on these meetings, the main aspects for digital transformation of distribution were considered as follows:
• Order batching with a cut-off point for intake of orders, to streamline the product flow strategy. • Predictive route planning and optimization to optimize vehicle utilization and occupancy. • 3rd party integration to expand the multi-modal vehicle selection for last-mile delivery.
Apart from the data collected during the meetings, BeverageCo also provided a database of critical distribution operational details that includes Order to delivery tracking data, Distribution Center shipment volumes, Delivery tracking analysis, and Distribution network map. These are the critical data points instrumental in building the current state value stream map with specifics on information flow and product flows including delays and points of failure.
5. Identifying Gaps & Whys 1. Data Gathering 2. Understanding As-Is business process 3. Benchmarking KPIs 4. Building VSM for current Product & Information
3.1.2 Understanding As-is business processes & digital capabilities.
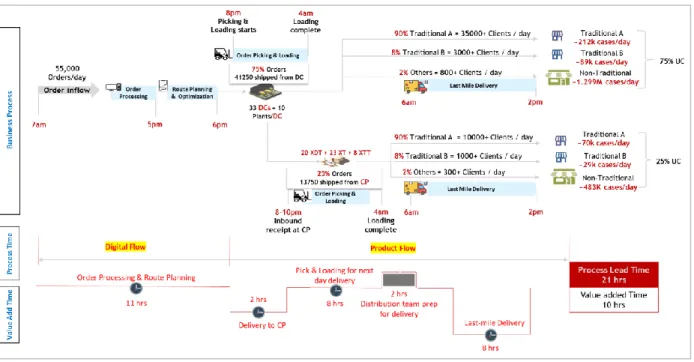
The last-mile distribution (outbound to customers) is a tightly controlled process at BeverageCo with more than 90% of customer orders delivered within 31 hours (from the time of ordering). Figure 4 illustrates the current distribution process flow, highlighting a 11-hour Information flow and 20-hour Product flow. BeverageCo uses several order intake channels like call-centers, mobile ordering and whatsapp ordering among others. The core order management system is SAP that processes the orders in multiple batches during the day to create delivery notes and delivery groups for the Distribution Centers (DCs) and the Consolidation Points (CPs) for delivering each order. BeverageCo uses RoadNet as the route planning and optimization engine and Greenmile as the delivery tracking tool. Once the order processing and the route generation is completed, the product flow journey starts. The DCs and CPs have a continuous picking and loading from 6pm to 8am and followed by the last-mile delivery to customers between 8am and 2pm, completing a 20-hour product flow journey.
Figure 4:
3.1.3 Benchmarking KPIs
BeverageCo has a robust tracking and monitoring capability of the entire distribution process with a deep focus on Customer satisfaction, Cost of Operations, and Productivity. Figure 5 shows some of the categories of key KPIs currently monitored, reflecting a high degree of operational maturity and performance excellence benchmark set by BeverageCo.
Figure 5:
BeverageCo’s current last-mile distribution KPIs
Table 1 below shows the actuals of the most critical customer centric KPIs and Operational KPIs that BeverageCo is tracking currently, highlighting vehicle utilization and vehicle occupancy as the lagging indicators.
Client KPIs: Costs KPIs:
Order fulfillment Fill Rate Cost to serve Delivery Effectiveness Cost to deliver Delivery Efficiency (# of clients -
# clients with returns)
Cost per distribution model (own fleet; third-party) Delivery Service Metric
(Customer Engagement)
Cost per vehicle type (van, truck, toco, etc)
Productivity KPIs: Digital Technologies KPIs: Unit cases/ Head Count Adherence to digital distribution initiatives Unit Cases /number of deliveries Real Time Routing
Client Dropsize RTR, Geo-efficiency
Operations KPIs: Asset & Legal KPIs:
Costs Load occupancy (in vehicle)
Productivity Fleet utilization
Asset (vehicle utilization) Workday (labor journey) Adherence to technology
Table 1:
BeverageCo’s Last Mile Distribution – Key KPIs
Key observations on the critical metrics:
• Vehicle utilization rate at 76% reflects inflexible network design and distribution strategy resulting in vehicles being under-utilized.
• Vehicle occupancy rate at 75% reflects planning inefficiency with a lot of LTL (Less than Truck Load) that needs to be optimized.
The assessment of the current KPIs and the actuals reflects a high standard that BeverageCo has set for its operations and the focus on continuously improving on its own benchmark. However, one of the challenges that BeverageCo is facing today is the lack of clarity in defining ‘value’ of flexibility in last mile execution and the ability to measure it. Hence there is need for a redefined focus on a new set of metrics. The following are some of the potential metrics that needed to be defined and baselined collaboratively with BeverageCo:
• Visibility of the value of each client category (bronze, silver, and gold) • Adherence to delivery window at the convenience of the customers • Order processing and route planning efficiency (target less than 5min) • Picking and loading efficiency (target less than 60min)
• Compliance to shorter delivery lead times – 2-hour, 4-hour or same-day delivery • Utilization of multi-modal distribution types
• Net Promoter Score
Most Important KPIs Unit of Measure FY '19 FY '20
Order Fulfillment Orders delivered / Orders received 86.6% 89% Delivery Effectiveness Volume (in Unit cases) 97.97% 98.52%
Cost per unit case Currency BRL (R$) 0.98 0.99
Cost per unit case with inflation Currency BRL (R$) 1.00 0.98
Vehicle Occupancy Volume (unit cases) 73.42% 75.11%
On Time Delivery Actual Dly Dt / Requested Dly Dt 90.20% 91.10% Case Fill Rate Cases delivered / Cases Ordered 96.80% 96.60%
OTIF On Time Delivery x Case Fill Rate 87.31% 88.00%
Total Availability of KOF + 3PL fleet # Vehicles (abs %) 96.18% 96.85%
Some of the KPIs listed above are aspirational, and current benchmarks may not exist. However, the critical requirement for this project is to analyze and understand how these metrics could be made operational and as well to suggest a path for continuous improvement.
3.1.4 Building VSM for the current Information and Product flow
Figure 6 depicts BeverageCo’s current last mile distribution process highlighting the information flow and product flow serving more than 55,000 clients (also referred as customers) each day, accounting for a volume of 2-million unit-cases (UC). It is important to note that 90% of the clients are from traditional retail channel that are small stores, spread across dense urban cities, adding to the complexity of last-mile distribution. The Information flow (11 hours lead time) involves continuous flow of orders between 7am and 5pm followed by route planning and optimization process scheduled to complete by 6pm. The product flow (20 hours lead time) takes two distinct routes, one through the distribution centers (DCs) and the other through the consolidation points (CPs). DCs (40+ sites) are large warehouses that serve the customers and as well feed the CPs with its daily orders for fulfillment. Consolidation points (around 50 sites) are small fulfillment centers (some of them are cross docking locations) with limited storage capacity. Hence, CPs need daily replenishment for the daily orders to be fulfilled, serving 25% of the volume.
Figure 6:
BeverageCo’s current last-mile distribution process flow
3.1.5 Identifying gaps in the current value stream and the reasons behind
BeverageCo runs an efficient distribution operation, delivering more than 2 million cases each day. However, the current process and digital capabilities may not help scale for the huge aspirations of transforming from the 31-hour distribution model to a same-day or 4-hour delivery model. Figure 7 shows some of the key opportunities (gaps) in the information flow of highlighting the need for batching the orders to reduce the 11-hour order intake lead time, predictive route planning and optimization capability to improve the vehicle utilization and occupancy metrics.
Figure 7:
Gap analysis of the Information flow of distribution process
The product flow gap-analysis is even more critical as it involves a 20-hour lead time. Figure 8 depicts the a detailed gap-analysis of the product flow of distribution process at BeverageCo, indicating the need for flexible picking and loading at CPs to align with flexible delivery schedule and the need for third party integration for multi-modal delivery options that are critical for urban last mile logistics.
Figure 8:
Gap analysis of the Product flow of distribution process
Table 2 reflects the key takeaways from the product flow gap-analysis, highlighting the importance of flexible delivery scheduling at DCs and CPs to accommodate the new distribution model.
Table 2:
Key takeaways for the product flow gap-analysis
Creating the Vision for future state
Distribution is one of the key strategic areas for BeverageCo that is critical to drive customer-centric and demand-driven supply chain strategy. Customer obsession is core to BeverageCo value system and flexibility in distribution is critical to improve customer satisfaction. To establish the vision for future state distribution, it is important to understand BeverageCo’s definition of flexibility and aspirations of value, increased flexibility could deliver. For BeverageCo, flexibility in distribution is having the capacity to deliver when it is most convenient to the clients, be it same-day delivery or on the specific day and time clients choose. BeverageCo understands that this would bring tremendous value to its clients. Flexibility would entail changing the fixed sales-distribution process, which is selling and taking orders from the clients between 7 am – 5 pm and delivering the following day in the current setup.
3.2.1 Vision for flexible last mile distribution
BeverageCo’s definition of ‘value’ is associated with consistency in service excellence and flexibility in adapting to new customer requirements thereby driving up customer delight. While this is a powerful, customer-centric value proposition, it needs to be refined to reimagine the business, to reimagine new possibilities of creating value for all the partners in the network. The foundation to this transformation is in setting the ‘vision’ and the ‘value’ proposition that flexibility could deliver, as described below: • to transform BeverageCo to become the best-in-class provider to its customers.
• to redefine company’s value proposition to deliver enhanced services, and customer engagement. • to clearly understand customer expectations and implement new technologies and best practices. • to become a reference for outstanding service capability to customers
• to be extremely efficient with costs (resource optimization capacity, route planning capacity, among others), while continuously delivering ‘value’ to customers
• to create new possibilities to redefine the business, going beyond beverage distribution as the core, to create new value proposition and new business opportunities.
3.2.2 Establishing target channels for flexible distribution
Flexible last-mile distribution is a complex transformation journey; hence it is important to not to boil the ocean but rather target specific channels of distribution where the flexibility makes most sense. BeverageCo currently has 5 customer categories (Strategic Directories). Table 3 is a snapshot of BeverageCo’s customer categories and their order and delivery characteristics. This table highlights
BeverageCo’s aspiration of a 4-hour lead time for the Traditional retail channel customers. Another important consideration is the order characteristics of the Traditional retail channel (with 90+% customer base), that it is highly ad hoc (referred to as ‘less planned’ in the table) as these customers carry a small store footprint with limited storage capacity and hence tend to order more frequently in small sizes. These orders flow throughout the day (7am to 5pm), unlike the other customer categories which are ‘well planned’ with less frequent and predictable flow of orders.
Table 3:
BeverageCo’s customer categories (Strategic Directories) & its need for flexibility
Though large retailers and distributors contribute to around 50% of the volume delivered each day, these categories are characterized by low order frequency and large order size, due to the increased storage capacity or shelf space. The challenge is with traditional customers with a small store size/storage space. The number of customers in this segment is more than 90% with the daily volume of distribution around 50%. The demand for these customers is in lesser volumes with higher frequency and hence the need for higher degree of flexibility in daily deliveries. This project focuses on flexible last mile distribution for traditional customers with a target 4hr delivery model. Some of the key challenges in traditional customer segments are:
• Extremely high volume of small customers, spread across densely populated urban cities, and hence the need for high number of routes/vehicles with increased delivery lead times.
Realizing the vision for future state value stream
BeverageCo’s vision is to transform the distribution model for traditional customers, from the current 31-hour lead time to less than 4 31-hours. This is aspirational and may demand significant changes to current distribution process, bringing in new digital capabilities for seamless execution right from order capture to last-mile execution. The key here is to establish the critical success factors, identify the flexibility drivers and most importantly the ‘value’ it will deliver.
3.3.1 Critical success factors and the key flexibility drivers to realize the vision
To realize this vision, it is important to set the priorities, build the foundation, baseline the current metrics, and identify new metrics to measure ‘value’. Identifying the critical success factors, the transformation drivers, will help BeverageCo, accelerate the journey to realize its vision. Digital Transformation is a critical component needed to meet the objective of extracting maximum value from within the current network and minimizing the impact to current processes and people. Also, it is important to transform the fixed sales-distribution process to align with the new flexible distribution model. Nevertheless, this change must be driven with new digital capabilities than pure process changes to reduce impact to the current operations and people. This includes integration with third party logistics providers for implementing multi-modal distribution that will enable significant flexibility in last-mile distribution with different choices of vehicles based on the delivery requirements. Finally, defining a clear set of metrics to measure ‘value’ in driving increased flexibility is critical as well to monitor, track, and course correct the progress of the transformation.
While there are multiple options for BeverageCo to consider in driving this transformation, there are a few that has the profound impact in realizing the vision of flexible distribution. Based on the discussions with BeverageCo, some of the critical success factors jointly identified are: (1) changing the fixed sales-distribution process to add more flexibility (in ordering process, delivery schedule, among others), (2) increasing the flexibility and agility in fulfillment centers (DCs and CPs) with flexible picking and loading schedule, (3) establishing new fulfillment channels at proximity to customers and (4) integration with third party logistics for multi-modal delivery. For each of these critical success factors, it is important to identify the flexibility drivers, the new digital and process capabilities that will enable this transformation. Table 4 summarizes the discussion outcomes with BeverageCo, in identifying the key flexibility drivers to enable each critical success factor. Also, for each flexibility driver the expected performance outcomes are
Table 4:
Critical success factors and the key flexibility drivers
3.3.2 Drivers of flexibility – mapping and scoring
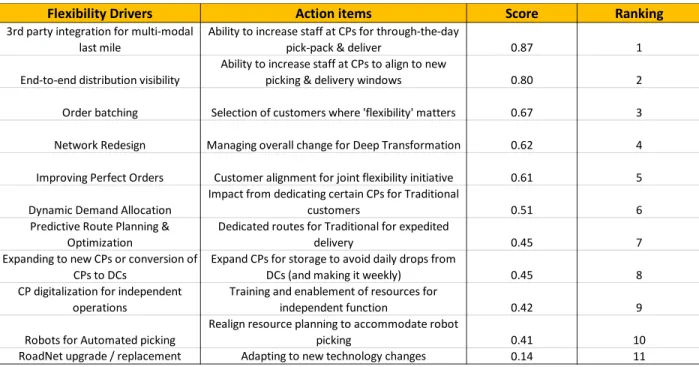
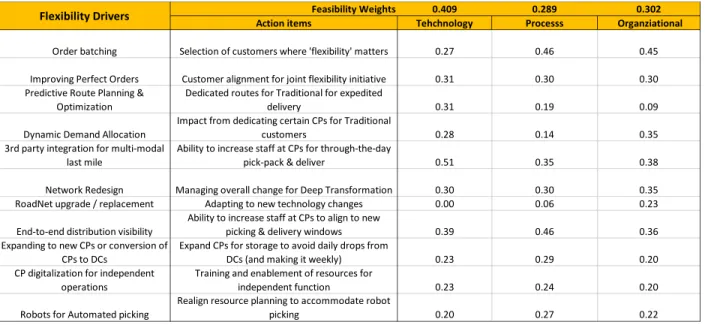
Flexibility drivers are the new digital and process capabilities that are key to this transformation and hence it is important to understand the value each flexibility driver could bring to the entire distribution value stream. Table 5 depicts the mapping of each flexibility driver against each life-cycle stage of the complete distribution process and the scoring (significance level) provided by BeverageCo SMEs. The main idea behind this mapping and scoring is to understand how BeverageCo SMEs weigh the transformation drivers considering their process and systems limitations. This is a critical input for the future state value stream design as it integrates the drivers with higher values to optimize the information and product flow.
Table 5:
Drivers of Flexibility – mapping and scoring
Future state value stream design
The critical phase of this project is to define the path for transformation from the current state to the future state vision for the flexible distribution model. BeverageCo’s vision is to transform from a 31-hour delivery model to less than 4 hours for the traditional customers that accounts for 90+% of the deliveries. The traditional channels are highly fragmented and unorganized, leading to a higher density and network complexity. Furthermore, these customers are challenged by limited storage capacity and hence are inclined to smaller order quantities and more frequent replenishments, which drives uncertainty of demand, time and quantity thereby increasing last-mile distribution complexity.
The future state value stream design not only accounts for the distribution complexity, but also the limitations of the current processes and digital maturity at the DCs and Consolidation points. Hence the future state value stream is designed with the following key design principles:
• Feasibility analysis of the flexibility in the current distribution model to understand the degree of complexity in effecting the change.
• Simulation based future state value stream analysis based on realistic future scenarios of last-mile distribution
• Assessing what it takes to make a 4-hour distribution model work with focus on ease of implementation and impact to the current people, processes, and tools.
3.4.1 Feasibility analysis of the flexibility in the current distribution model
The current distribution at BeverageCo is a 31-hour model with digital flow lead time of 11 hours and product flow lead time of 20 hours. The target state of 4-hour distribution is a significant shift from the current state and hence it is important to understand how feasible it is to drive this change. The objective of the feasibility check is to determine the degree of flexibility in the current distribution model and to identify what it takes to transform. Figure 9 illustrates the outcome of the feasibility analysis conducted across digital capabilities and process requirements in the current distribution model. It highlights the ability to optimize the digital flow to a near real-time process by fine tuning the current systems (SAP and RoadNet). Given that the current order processing happens in batches (though not in line with the customer delivery requirements), this change can be implemented. However, optimizing the 20-hour product flow journey in the current setup will be difficult and might involve network redesign or process changes.
Figure 9:
Feasibility analysis of flexibility in the current distribution model
Table 6 below summarizes the feasibility analysis with critical observations and the changes needed to design the future state value stream. Specifically, fine tuning the current order management and route planning systems SAP and Roadnet to near real-time mode is feasible and will bring down the overall lead time by 11 hours. However, the picking and loading would still incur 12 hours lead time due to the current
process setup at the DCs and CPs and that CPs need daily replenishment from the DCs due to its size limitations. This highlights the importance of reimagining the product flow in a way the process lead time impact is minimized. Finally, the 8-hour last-mile delivery is another opportunity for optimization by choosing the right balance of load between DCs and CPs, and as well the right vehicle types through integration with third-party logistics providers with multi-modal distribution.
Table 6:
Feasibility analysis – critical observations and changes needed.
The key takeaways from the feasibility analysis are:
• Reducing the picking and loading is critical to this transformation and needs new perspective on how digital capabilities can be leveraged to minimize this lead time.
• Need for fine tuning the DC and CP picking & loading schedule and as well the resource planning to bring in flexibility that reduces the picking and loading lead time.
• Simulate multiple last-mile delivery scenarios to explore the possibility of 2-hour, 4-hour, 6-hour and 8-hour models to explore the possibility of lead time reduction with last-mile delivery.
3.4.2 Simulation-based future state value stream design
Simulation is a powerful tool to stress test the future state behavior of a value stream in a very short time frame without having to make large investments in time and cost. Integrating VSM and simulation provides a realistic view of the future state, to help understand the feasibility and impact to critical performance metrics. Also, simulation of the VSM allows iteration of multiple real-time scenarios without the constraints of process limitations or system limitations in the current state. For BeverageCo, the objective is to design a flexible distribution model with a target 4-hour distribution from the time of order capture cut-off to the time of delivery. Based on the feasibility analysis, the two product flow areas that induces the latency are, picking and loading and the last-mile delivery. Given that the picking and loading is largely dependent on the process changes, the real opportunity is in last-mile delivery that can be expedited by choosing the right balance of load between DCs and CPs, and as well the right vehicle types. The key consideration here is in ensuring that the expedited deliveries do not incur high costs of transportation to make this entire pursuit in flexibility, financially unviable.
3.4.2.1 Simulation approach and scenarios
The simulation approach involves setting up the base scenario, that mimics the current state value stream with necessary constraints and running ‘what-if’ analysis for multiple future state scenarios by fine tuning a combination of input variables. The following steps detail the simulation approach: (1) setting up the distribution network with DCs, CPs and Customer locations; (2) setting up the capacity constraints at each DC and CP; (3) mapping the demand requirement for each customer and the expected lead time requirement; (4) setting up the type of vehicles, its capacity constraints and cost of transportation. With this setup, the base scenario is run a few times to make sure the results closely mimic the current state performance outcomes. Once the base scenario is established, the future state scenarios are run, and the simulation outcomes are compared with that of the base scenario to understand the impact of each scenario to the performance metrics.
Figure 10 and 11 below illustrates the key input parameters used in the simulation runs: and as well the specific future state scenarios considered. The first scenario considers the product flow as it is in the current setup with DCs and CPs delivering to customers. The second and the third scenarios consider the delivery from only DCs or CPs. The main idea here is to identify if the lead time could be reduced by choosing either of this distribution points instead of delivering from both locations. For each of these scenarios, multiple scenario iterations are considered for each of the 2hour, 4-hour, 6-hour and 8-hour lead time options.
Figure 10:
Simulation Input parameters and multiple scenario paths
Figure 11:
Simulation Scenarios
3.4.3 What it takes to make a 4-hour distribution model work?
The feasibility analysis and simulation outcomes provide key insights on how both digital flow and the product flow must be adapted to design a flexible distribution model be it 4-hour or a same-day delivery model. The digital flow that takes about 11 hours currently, must be refined to be near real-time to get to zero-latency. The product flow journey that takes about 20 hours currently must be refined to 4-hour or less than 8-hours to make it a same-day delivery. Though the shift from a 31-hour distribution to a 4-hour model appears to be a massive transformation initiative with significant changes to processes and adoption of new tools, the primary objective of this project is to identify new digital capabilities that would make this transformation feasible with limited changes to existing systems and current processes. Table 7 articulates the changes needed in the Information flow and product flow to realize the future state value stream for the traditional customers. The salient features of this design recommendations are with digitalization of order processing and route planning with intelligent forecasting and predictive route planning that will help DCs and CPs to plan ahead of time for the deliveries to be made the following day. Also, this digitalization will keep the process change requirements to minimum as the current picking and loading at DCs and CPs can continue with intelligent forecasting and planning of daily deliveries. The process changes required are with order in-take from customers, happening between 7am and 8am (8am
order intake cut-off) on the day of delivery, and with the resource planning at DCs and CPs to have delivery personnel available for final loading and last-mile delivery at 8am.
Table 7:
What does it take to make a flexible distribution model work?
3.4.4 Future state value stream design for flexible distribution model
Digitalization is key for future state value stream design, to meet objective of flexible distribution while
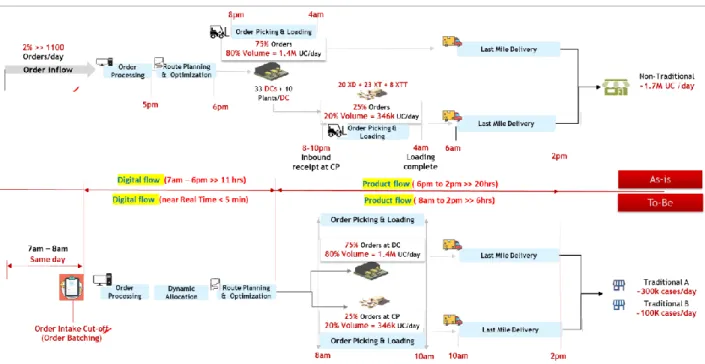
keeping the process changes to minimum. This involves introducing an intelligent forecast driven delivery planning and as well predictive route planning at DCs and CPs, to ensure majority of the picking and loading required for the delivery next day, is already accomplished even before the daily orders are received (7 – 8am, the next day). Figures 12 and 13 helps with the comparison of current digital flow with that of the suggested digital flow for order processing and route planning:
Figure 12:
As-Is Order processing & Route planning.
Figure 13:
The next important design component of future state value stream is in shaping the picking, loading and last-mile execution the following day, the day orders are received (by 8am) and delivered (by 12 – 2pm). Figure 14 below provides a comparative view of the current value stream and future state value stream highlighting the key changes needed in future. This involves introducing an order intake window between 7am and 8am to batch the orders (only for traditional customers – our target segment) for delivery in the next 4 – 6 hours. This step requires near real-time order processing and route planning with fine tuning of the existing systems. and minimal changes to resource planning to have personnel be available for final loading and last-mile execution.
Figure 14:
As-is and To-be value streams in flexible distribution model.
The salient features of this future state value stream design are: • Order intake window 7am – 8am on the same day of delivery
• Order intake cut-off at 8am, to allow for order batching and route planning for 4 – 6-hour delivery. o This order batching stage can be extended for multiple order cut-off points and corresponding
delivery timing. For e.g., order intake cut-off at 10am can be delivered at 2 – 4pm same day and order intake cut-off at 12noon can be delivered at 4 – 6pm, the same day.
o This order batching provides flexibility to not only expedite delivery but also the flexibility to deliver when it is most convenient to customers.
• For more than 80% of the deliveries to be made, the picking and loading is already completed as part of the daily picking and loading process scheduled between 8pm (the previous day) and 4am. o Picking and loading for the traditional orders is planned based on the intelligent forecasting and
predictive route planning models, built based on daily demand data for the past 3 years, from each customer.
o The intelligent forecasting and predictive route planning steps in digital flow will also include appropriate demand allocation across DCs and CPs that minimizes the last-mile delivery time. o Also, as indicated earlier, BeverageCo’s current distribution process needs improvement on two
critical metrics – vehicle occupancy and vehicle utilization. These metrics average at around 75% due to lack of visibility into availability of vehicles, heavy dependency on large truck-based delivery and less leverage of multi-modal delivery options with third-party logistics providers. o One of the key outcomes of this digital transformation is to not just bring in flexibility in
distribution for expedited delivery, but also to improve on some of the shortcomings in the current distribution model thereby making this flexible distribution, a profitable execution model at frugal investment.
o With this consideration, optimizing the digital flow will include seamless integration with third-party logistics providers, better visibility into vehicle availability and efficient load planning, all leading to higher vehicle utilization and vehicle occupancy.
The value stream map in Figure 15 depicts end-to-end order to delivery flow as designed for the future state flexible distribution model. The key value proposition of this future state design is in not just reducing the digital flow lead time from 11 hours to near real-time, but also in reducing the 20-hour product flow lead time to 4 – 6 hours.
Figure 15:
End-to-end Order to Delivery flow in flexible distribution model
With limited process change (resource planning required to get delivery personnel for last-mile delivery at 8am), the adoption of this value stream design would mean, minimal organization change management, process training and orientation needed for warehouse and delivery personnel, and most importantly the short lead time required to implement this change.
3.4.5 Measuring ‘value’ behind flexibility
BeverageCo is convinced about the need for flexibility in distribution; however, the key challenge it has is in measuring the ‘value’ to understand if it justifies the time and effort to drive the transformation. There are three critical dimensions to measure ‘value’:
• the intangible benefits related to customer delight by exceeding service levels and delivering at the time that is most convenient to customers.
• the monetary gains, a measure of ‘value’ exceeding the cost of implementation.
• the most critical is the ‘value beyond’ generated from reimagining the distribution model that could create new business avenues for BeverageCo, by expanding its distribution capabilities beyond beverage products and entre into new domains of other consumer goods, medical supplies, among others and become the distributor of choice in the LATAM region.
Table 8 articulates the key ‘value’ metrics addressing the dimensions mentioned above.
Table 8:
Metrics to measure ‘Value’
The interesting aspect to note in this value creation journey is the widespread coverage of customers (with more than 90% customer base) benefitting with same-day or 4–6-hour delivery. This amplifies the potential for value creation with increased volume of business within the current customer base or through references to new customers.
MCDM based Digital Transformation drivers’ prioritization.
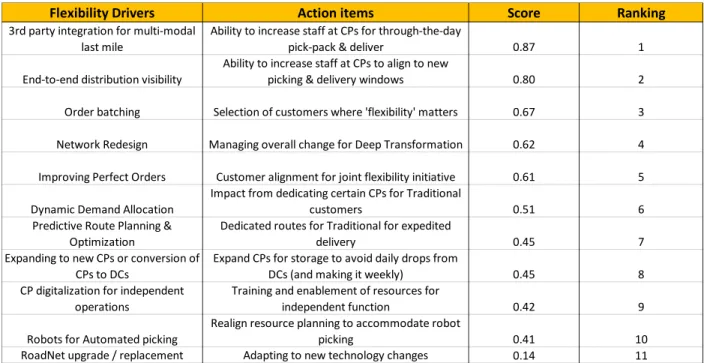
With multiple digital and process capabilities available to realize the vision, it is important to identify appropriate drivers that are best fit for purpose and can scale for more complex scenarios in future. This challenge requires multi-dimensional criteria, and decision-making models that integrates the feasibility and value assessment of each flexibility driver by the subject matter experts at BeverageCo along with the limitations people, processes, and systems. In this regard, multi-criteria-decision-model (MCDM) is implemented to identify the technical, process and organizational change levers that aligns with the digital transformation drivers in realizing the vision.
MCDM leverages the future state value stream design and the simulation outcomes to define the flexibility drivers that are relevant for the transformation. While performance outcomes measure is critical in assessing the flexibility drivers, there are other dimensions such as technology (ease of implementation and integration to current system), process change and organizational readiness that are critical in this fitment assessment. MCDM is integrated with a prioritization framework - Technique for Order of Preference by Similarity to Ideal Solution (TOPSIS), to help prioritize the flexibility drivers that are key to this transformation.
4 Results and Analysis
The future state value stream design and the prioritization of the digital drivers needed for digital transformation involved outcomes from two critical components of analysis - simulation and multi-criteria-decision-model (MCDM). This chapter details the input parameters for multiple scenarios, the anlaysis, and the results from simulation and MCDM methods.
Simulation input parameters and scenarios
The need for simulation is to ensure that the expedited deliveries do not incur high costs of transportation to make this entire pursuit of flexibility, financially unviable. For this simulation anlaysis a representative region in Brazil was selected with exact DCs and CPs locations as in the current distribution network and with 91 representative customer locations for delivery. Table 9 and 10 below illustrates the key input parameters used in the simulation runs: and as well the specific future state scenarios considered.
Table 9:
Simulation Input parameters
Table 10:
4.1.1 Simulation results
Based on the scenarios and input parameters illustrated above, multiple simulation runs were modeled, and Table 11 reflects the summary of the 8-hour distribution for deliveries from only DCs, only CPs and combination of DCs and CPs, clearly indicating that delivering only from CPs (due to proximity) or only from DCs (due to scale) is not feasible as the number of routes and the net distance would need to increase significantly to justify costs.
Table 11:
Simulation scenarios with 8-hour distribution
The key takeaway from this simulation run is, the as-is distribution model from DCs and CPs is critical for flexible and expedited distribution. With this key consideration, the following additional scenarios were constructed:
• Scenarios with different distribution lead times (8-hour, 6-hour, 4-hour, and 2-hour)
• Scenarios with improving vehicle occupancy and vehicle utilization – the performance metrics that is on a low – moderate scale currently. The idea is to consider future scenarios of how predictive analytics in route planning would positively impact these performance metrics and more importantly if this digital driver would justify its leverage.
• Scenarios with the consideration that customers will be willing to pay a premium of 5% for expedited or flexible delivery options.
Table 12 illustrates the simulation outcomes for each of these scenarios highlighting,
• 2-hour last-mile delivery is infeasible with the current network design (location of DCs & CPs). • 4-hour last-mile delivery is feasible with the following considerations:
o Vehicle utilization and Vehicle occupancy must improve to 85% from its current ~75% o Premium of 5-8% charged to customers for expedited delivery.