HAL Id: inserm-00168580
https://www.hal.inserm.fr/inserm-00168580
Submitted on 31 Jan 2008
HAL is a multi-disciplinary open access archive for the deposit and dissemination of sci-entific research documents, whether they are pub-lished or not. The documents may come from teaching and research institutions in France or abroad, or from public or private research centers.
L’archive ouverte pluridisciplinaire HAL, est destinée au dépôt et à la diffusion de documents scientifiques de niveau recherche, publiés ou non, émanant des établissements d’enseignement et de recherche français ou étrangers, des laboratoires publics ou privés.
Attitudes associated with behavioral predictors of
serious road traffic crashes: results from the GAZEL
cohort.
Hermann Nabi, Louis Rachid Salmi, Sylviane Lafont, Mireille Chiron, Marie
Zins, Emmanuel Lagarde
To cite this version:
Hermann Nabi, Louis Rachid Salmi, Sylviane Lafont, Mireille Chiron, Marie Zins, et al.. Attitudes associated with behavioral predictors of serious road traffic crashes: results from the GAZEL cohort.. Injury Prevention, BMJ Publishing Group, 2007, 13 (1), pp.26-31. �10.1136/ip.2006.013342�. �inserm-00168580�
Title: Attitudes associated with behavioural predictors of serious road traffic crashes: Results
from the GAZEL cohort
Authors:
Hermann Nabi, PhD research student1
Louis Rachid Salmi, Physician epidemiologist2,3 Sylviane Lafont, Statistician4
Mireille Chiron, Senior researcher4 Marie Zins, Physician epidemiologist1 Emmanuel Lagarde, Senior researcher2
(1) INSERM, U687-IFR69, Saint-Maurice, F-94415 France
(2) INSERM, Equipe Avenir « Santé et insécurité routière » U593-ISPED-IFR99, Bordeaux, F-33076 France (3) Service d’information médical, CHU, Bordeaux, F-33076 France
(4) INRETS, UMRESTTE, Bron, F-69675 BRON, France
Word count: 2 951
Correspondence to:
Hermann Nabi
Hôpital National de Saint-Maurice INSERM U687
14, rue du Val d’Osne 94415 Saint-Maurice Cedex Tel: + 0 (33) 1 45 18 38 55 Fax: + 0 (33) 1 45 18 38 89 France
Abstract
Objectives: To test the hypothesis that behavioural predictors of serious Road Traffic Crashes
(RTC) are correlated with unfavourable attitudes towards traffic safety.
Design: Prospective and cross-sectional cohort study Setting: France
Participants: 13 447 of the 19 894 living members of the GAZEL cohort, workers and recent
retirees of a French national utility company followed up since 1989.
Main outcomes measures: Driving behaviours and attitudes towards traffic safety in 2001 by
questionnaire. Serious RTCs were recorded over the succeeding 3 years using the cohort annual questionnaire. Behavioural predictors of serious RTCs were assessed using generalized linear Poisson regression models with time-dependent covariates. Factor scores extracted from the first four attitudinal factors of principal component analysis (PCA) were saved and then regressed on behavioural predictors as independent variables.
Results: After controlling for potential confounders, the best predictors of serious RTCs
were: “exceeding speed limits on rural roads”, “risky use of cellular phone”, and “sleepy driving”. Adjusted Rate Ratio (RR) ranged from 1.47 to 2.16. Predictors of contravention of the Highway Code (the first two) were found to be strongly associated with negative attitudes towards “enforcement” and “speed limitations” with an adjusted odds ratio (OR) ranging from 1.31 to 2.02.
Conclusion: Our study supports the view that individuals with a high propensity for driving
behaviours associated with an increased risk of RTCs were more likely to have negative attitudes towards traffic safety. Changing drivers’ negative or distorted opinions of traffic “enforcement” as well as “speed limitations” and “alcohol prohibition on roads” could improve their compliance with road traffic rules.
Introduction
Numerous studies have illustrated how risky driving behaviours play a major role in the occurrence of road traffic crashes (RTCs), leading to the consensus that changes in driver behaviour are one key to traffic safety interventions.1-7 One of the approaches considered to be effective and long-lasting is to change attitudes towards traffic safety.8-10 The rationale of this attitudes-behaviour-outcome model assumes that taking attitudes correlate with
risk-taking behaviours, which in turn predict RTCs. Although the potential of this model is often advocated and sometimes used in traffic safety campaigns,11-13 the causal pathway between attitudes, driving behaviours and RTCs risk is rarely studied.14 This gap in knowledge is due to the fact that most studies that have demonstrated a strong relationship between drivers’ attitudes and their behaviour on the roads 8, 15-18 did not include data on RTCs. The few studies that considered drivers’ attitudes to RTCs produced inconsistent findings. A study by Assum among Norwegian drivers14 found that the association between attitudes and accident risk disappears when controlling for mileage and for driver’s age. Another recent study from Norway19 found that attitudes towards rule violations and speeding influenced involvement in risky driving behaviours, which had an impact on near accidents and accidents. Unfortunately, accident data were recorded retrospectively and over lifetimes, making difficult to disentangle the temporal sequence in the associations between attitudes, risky driving, and crashes. We conducted a study in a large cohort of employees and recent retirees (the GAZEL cohort) in order to test the hypothesis that behavioural predictors of serious RTCs were correlated with unfavourable attitudes towards traffic safety. The three specific objectives of this study were: (1) to identify behavioural predictors of serious RTCs, (2) to identify patterns of attitudes towards traffic safety, and (3) to examine the relationship between these specific attitudinal patterns and behavioural predictors of serious RTCs.
MATERIALS AND METHODS Participants
The participants were current employees or recent retirees of the French national electricity and Gas Company, Electricité De France–Gaz De France (EDF-GDF), who volunteered to participate in a research cohort, known as the GAZEL cohort. The GAZEL cohort was established in 1989 and originally included20624 subjects working at EDF-GDF, comprising men aged 40–50 and women aged 35–50 at baseline. Since 1989, this cohort has been followed up by means of yearly self-administered questionnairesand by data collection from the company’s human resources andmedical departments. The objectives and methods of the cohort have been described in detail elsewhere.20
Materials
Driving Behaviour and Road Safety (DBRS) questionnaire 2001
In 2001, a DBRS questionnaire was mailed to the 19 894 living members of the GAZEL cohort. This questionnaire was previously pilot-tested on 500 randomly selected participants. The answers and comments of the 330 respondents were used to finalize it.
Risky driving behaviours were assessed using five questions: The participants were asked to report their maximum speed in built-up areas, on rural roads, and on highways (a circle had to be drawn on a scale for each location with marks labelled with multiples of ten; when the circle was placed between two marks, say 40 and 50, it was coded 45). Drinking and driving was assessed with the question: “In the 12 past months, have you ever driven after drinking too much alcohol?” Driving whilst sleepy was assessed using the question: “In the 12 past months, have you ever driven while sleepy?” Participantswere also asked whether they had ever used connections to avoid paying the fine for a traffic violation (traffic ticket fixing).
Participants were considered to haverisky behaviour if they reported answering a phone call (with or without a car kit), whatever the driving circumstances and/or if they reported not stopping the vehicle before starting a phone call. Drivers were also asked whether they considered they could violate the Highway Code if they deemed a rule improper. The type of principal vehicle owned in January 2001 was noted and included in one of five categories according to its maximum speed.
Attitudes towards traffic regulations were assessed by asking participants whether they agreed or disagreed with a set of 19 assertions related to traffic regulation and enforcement issues debated in France in 2001. Assertions were positive or negative and were related to speed limitations, seat belt use, drinking and driving, and the overall traffic regulation system. Assertions were constructed in neutral language in order to avoid suggesting the response.17 Positive and negative attitudes were coded as 0 and 1, respectively.
The annual GAZEL cohort questionnaire
Sociodemographic data from the cohort database included sex, year of birth, occupational category. Low quantity alcohol drinkers were defined as men (women) reporting 1-13 (1-6) drinks over one week as opposed to high quantity alcohol drinkers who reported 14-27 (men) and 7-20 (women) drinks over the same period. Regular drinkers were defined as those who reported consuming alcohol on three or more days in the week, as opposed to episodic drinkers who reported drinking alcohol on fewer than 3 days a week.
Traffic safety-related data from the Annual GAZEL Cohort (AGC) questionnaire
Questions on mobility and accidents of the past year were added to the AGC questionnaire sent in January 2002, January 2003 and January 2004 providing data for the years 2001, 2002
and 2003, respectively. Drivers were asked how many kilometres they drove a 4- or 2-wheel motorized vehicle in the last 12 months in order to estimate their mileage. The nature of travels (work, private) and driver or passenger status were taking into account. The participants were also asked to report whether in the past 12 months they had been involved in one or more RTC. A distinction was made between serious RTC, defined as a crash which required at least a medical consultation, heavy material crashes when at least one vehicle was towed, and light material crashes. Only serious RTC were taken into account in the analyses.
Statistical analysis
Because the mean and variance of the number of serious RTCs in the 2001-2003 period were not different in our study, 21-22 we fitted generalized linear Poisson regression models26 with time-dependent covariates to estimate the Rate Ratios (RRs) of serious RTCs in the 2001-2003 period associated with reported risky driving behaviours in 2001. The impacts of potential confounders were tested using 3 nested models. In model 1, the impact of each risky driving behaviour on the risk of serious RTCs was assessed separately as an independent variable. RRs in model 2 were further adjusted for age, gender, occupational category in 2001, the type of vehicle owned in 2001, alcohol consumption (a five-category time-dependent covariate) and mileage (a time-time-dependent covariate). As recommended by Janke,24 a logarithmic transformation was applied to annual mileage. All risky driving behaviours significantly associated with the risk of serious RTCs in model 2 were included in model 3. Those that remained significantly associated with the risk of serious RTCs were selected for the next steps of the study.
Principal component analysis (PCA) with orthogonal (varimax) rotation25 was used in order to determine underlying dimensions of attitudes towards traffic safety among participants. An
item was considered to load on a given component if the factor loading was 0.5 or greater. The factor scores (REGR factor score) from the first four attitudinal factors of the PCA were saved. Factor scores are the scores of each participant (row) for each factor (column). To compute the factor score for a given participant for a given factor, the participant’s (automatically) standardized score for each variable is multiplied by the corresponding factor loading of the variable for the given factor, and the products are summed. This procedure runs automatically in most statistical packages such as SPSS, SAS etc. These factor scores were divided into three distinct levels using the percentiles (scores at or below the 25th percentile mean less negative towards traffic safety and scores at or above the 75th percentile mean more negative attitude towards traffic safety) and then regressed on the risky driving behaviours selected in the previous step. All odds ratios (OR) were adjusted for age, gender and socio-professional category.
RESULTS
We received responses to the 2001 DBRS questionnaire from 14 226 of the 19 894 living members of the GAZEL cohort. Some were excluded (n=26) because of socio-demographic data discrepancies with the general cohort database. Another 326 respondents were excluded because they did not drive in 2001 and 50 others because their data on driving behaviours were missing. A further 377 participants were also excluded because they did not respond to any of the three succeeding AGC questionnaires of the years 2001, 2002 and 2003. Among the remaining 13 447 participants (10 300 men, 3 147 women), 328 reported one serious RTA, 8 two serious RTA and 1 three serious RTA in the 2001-2003 period; 76 other serious RTA were excluded because they were reported to have occurred before the completion of the 2001 DBRS questionnaire. These 13 447 participants represented 67.6% of the 19 894 members of the GAZEL cohort that were alive in 2001. Their mean age was 56.4 years with a range of 48 to 62 on 1st January 2001.
Behavioural predictors of serious road traffic crashes
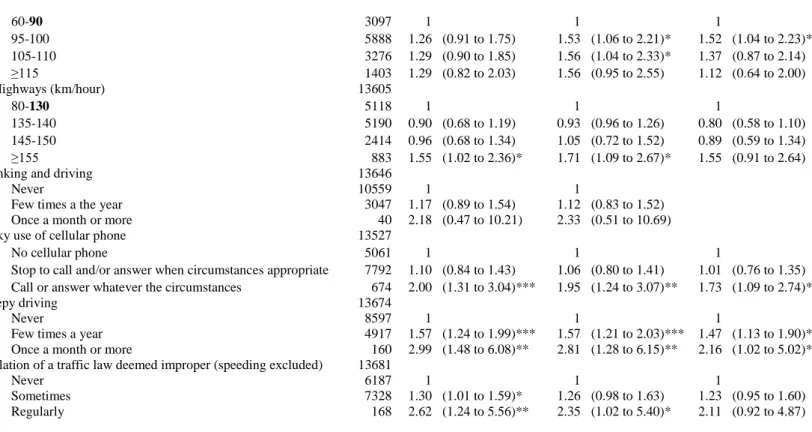
The crude risk of serious RTA in the 2001-2003 period increased significantly with
self-reported high speed on highways, risky use of cellular phone and with self-self-reported frequency
of drinking and driving, sleepy driving and violation of a traffic law deemed to be improper
(Table 1). When adjusted for potential confounders (model 2), the risk of serious RTCs was associated with exceeding speed limitations on rural roads and on highways, risky use of cellular phone, sleepy driving, and violation of a traffic law deemed to be improper. In the final multivariate model (model 3) that included all significant predictors from model 2, maximum speed more than 90 km/h on rural roads, risky use of cellular phone, and sleepy driving were the three self-reported behaviours that remained significantly associated with the risk of serious RTCs.
Pattern of attitudes towards traffic safety
The principal component analysis followed by orthogonal rotation identified six factors with Eigenvalues greater than 1. We retained the first four factors formed at least by two variables explaining 37.8% of the total variance (Table 2). The first factor compared participants in favour of enforcement to those not in favour. The second factor compared participants in favour of speed limitations to those not in favour. The third factor compared participants in favour of continuous assessment of driving ability to those not in favour. Finally, the fourth factor compared participants in favour of alcohol prohibition on roads to those not in favour.
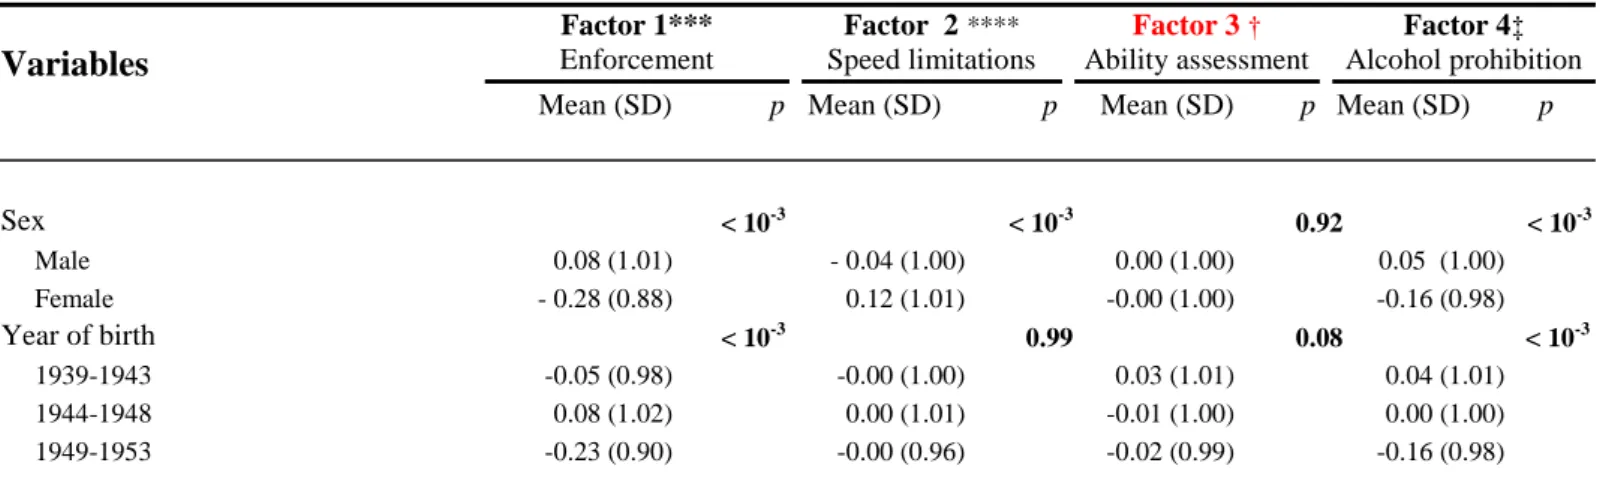
Who were participants with negative attitudes towards traffic safety?
Higher mean scores for negative attitudes towards enforcement (factor 1) were found among men, relatively younger participants, those who reported high quantity episodic alcohol consumption, those who reported higher annual mileage and those who reported having the most powerful vehicles (Table 3). Higher mean scores for negative attitudes towards speed limitations (factor 2) were found among women, unskilled workers, participants who reported high quantity episodic alcohol consumption, those who reported higher annual mileage and those who reported having the most powerful vehicles. Higher mean scores for negative attitudes to continuous assessment of driving ability (factor 3) were found among unskilled workers, participants who reported low quantity episodic alcohol consumption, and those with intermediate annual mileage. Finally, higher mean scores for negative attitudes towards alcohol prohibition on roads (factor 4) were found among older participants, managers, participants who reported high quantity episodic alcohol consumption and those who reported intermediate annual mileage and having intermediate-power vehicles.
Negative attitudes and behavioural predictors of serious RTCs
Results from multivariate logistic regression model (Table 4) show that negative attitudes towards enforcement and speed limitation were strongly associated with speeding and riky use of phone whereas negative attitudes towards alcohol prohibition was associated with sleepy driving.
DISCUSSION
In this study, risky driving behaviours such as exceeding speed limitations on rural roads (90 km/hour), sleepy driving, and risky use of cellular phone were found to be predictors of serious RTCs among participants of the GAZEL cohort in the 2001-2003 period. These predictors were found to be significantly correlated with negative attitudes towards enforcement, speed limitations and alcohol prohibition on roads.
Strengths of the study
These findings support the view that individuals with a high propensity for driving behaviours associated with an increased risk of RTCs were more likely to have negative attitudes towards traffic safety. 19-22 In contrast to many studies, the present study’s participants were from a large cohort followed-up on a regular basis and we were able to record incident RTCs and to account for a wide range of potential confounders, some of them being updated each year. The prospective design of our study allowed us to control the temporal relationship between the driving behaviours and the risk of subsequent serious RTCs.
Individuals with negative attitudes towards enforcement issues and accordingly with a high propensity for risky driving behaviours shared three main distinct characteristics consistent with the literature. They were male, had higher mileage and a more powerful vehicle.22, 29-30 However, the relationship between the attitudinal patterns and other variables including age, socio-professional category and alcohol consumption presented a more distorted picture. As expected, high quantity episodic alcohol consumers had a higher mean score for negative attitude towards alcohol prohibition on roads. However, self-reported frequency of drinking and driving was not found to be a predictor of serious RTCs in this study. One plausible explanation is that alcohol consumption rate is moderate among the participants of the
GAZEL cohort as high alcohol consumers were less willing to become members of the cohort.23 However, it is also possible that some of the heavy drinkers have under-reported their alcohol consumption habits. Another noteworthy result was that sleepy driving, one of the most important predictors of serious RTCs in this cohort, was not greatly associated with negative attitudes towards traffic safety issues after controlling for socio-demographic characteristics. This could be explained either by the fact that sleepy driving does not constitute a violation of the Highway Code or that driver’s attitudes towards sleepy driving were not assessed in this study.
Potential limitations of the study
Both serious RTCs and attitudes towards traffic safety and driving behaviours were self-reported. Although measures of self-reported risky driving behaviours have been found to have considerable validity in predicting traffic accident risk, 28-29 they cannot possibly account for the whole risk attributable to behavioural factors. It should be also noted that our sample, despite its large size and the inclusion of diverse trades and socioeconomic groups throughout France, mostly represented employed or retired middle-aged drivers. Although this sample characteristic somehow limits the generalizability of our results, the findings were consistent with Iversen and Rundmo’s study19
, which was conducted among a sample of Norwegian drivers, representative in terms of age, gender and education, and found that attitudes towards rule violations and speeding influenced involvement in risky driving behaviours which in turn was associated with near accidents and accidents.
Although scores for negative attitudes in three out of the four attitudinal factors were positively associated with behavioural predictors of serious RTCs, the variance fraction explained by these attitudinal factors was relatively low (ranging from 7 to 10%) probably
due to the many other factors that influenced drivers’ behaviours, including vehicles, road conditions, other drivers. Moreover, it is important to point out, as suggested by Iversen and Rundmo, 19 that self-reported measures can affect results. The moderate explained variance could also be due to the relative homogeneity of participants’ attitudes towards traffic safety, as suggested by the standard deviations of the scores of negative attitude towards traffic safety (Table 2). It is interesting, however, to underscore that although our study was conducted among middle-aged participants considered as the safest group when compared with other age groups, our data are consistent with an attitude-behaviour-accident pathway model. Finally, more response options than “agree” and “disagree” for the formulation of attitudinal scale
could have enhanced the discrimination effectiveness.
Conclusion and implications for prevention
In summary, drivers’ attitudes to a number of road traffic issues currently discussed were correlated with their reported behaviours which influenced their risk of being involved in traffic accidents. This unsurprising pattern was also described in a study of Europeans drivers’ attitudes towards enforcement30 in which it was shown that drivers penalized for speeding in the three years preceding the surveys were likely to report more frequently than other drivers that they exceeded speed limitations. Accordingly, these drivers were also those who were not concerned about road safety and did not want more enforcement or harsher penalties for offenders. These drivers deemed traffic enforcement measures to be arbitrary, unjust, and unuseful or designed for a purpose other than road safety. A survey of attitudes to road safety conducted in 2003 among a representative sample of British adults revealed that 41% of men surveyed thought that "speed cameras are only used to raise money" and 35% thought there are too many cameras on the roads.31
However, as stated by Redelmeier et al.7 traffic policing effectiveness, in particular traffic enforcement, should depend on the extent to which it gains social support (road users, traffic safety associations…). While the meaningful deterrent threat of enforcement is effective in securing the compliance of “early adopters”, 32
it does not work for some other drivers or “late adopters” for whom a more in-depth attitudinal change could be required. In a European study of drivers’ attitudes towards enforcement31, it appeared that some drivers’ experience of fines did not change either their attitudes, or their behaviour. Interventions aimed at changing drivers’ negative or distorted opinions of traffic “enforcement” as well as “speed limitations” and “alcohol prohibition on roads” could improve their compliance with road traffic rules.
Keys points
Although the potential of the “attitude-behaviour-outcome” model is often advocated and sometimes used in traffic safety campaigns, the causal pathway between attitudes, driving behaviours and road traffic accident risk is rarely studied.
Drivers’ attitudes towards current national road traffic issues were significantly correlated with their behavioural risk factors for serious road traffic accidents.
Changing drivers’ negative or distorted opinions of traffic “enforcement” as well as “speed limitations” and “alcohol prohibition on roads” could improve their compliance with road traffic rules.
Acknowledgments
The project was funded by Renault, Electricité de France-Gaz de France and Fondation MAIF. We thank all those who supported this work and in particular the staff of unit 687 of INSERM. Very special thanks go to Sébastien Bonenfant, Nadine Kaniewsky, and Nathalie Lopes for their valuable help throughout the study, and to Prof Marcel Goldberg for advice and support.
Contributors:
H Nabi analysed and interpreted data and wrote the report. E Lagarde conceived the study, contributed to analysis and interpretation of data and to the preparation of the manuscript. LR Salmi was involved with analysis and interpretation of data. M Chiron, S Lafont, and M Zins contributed to study design and interpretation of data. All authors contributed to the final version of the report. All authors had full access to all the data in the study and had final responsibility for the decision to submit for publication.
Ethical approval
This study protocol was approved by the French Data Protection Authority [Commission Nationale Informatique et Liberté (CNIL)]. Before inclusion in both the GAZEL cohort and the study on traffic safety, all participants received an information letter describing the main objective of the study and the non-compulsory nature of their participation.
REFERENCES
1. Evans L. The dominant role of driver behavior in traffic safety. Am J Public Health 1996; 86(6):784-6.
2. Parker D, Reason JT, Manstead ASR, et al. Driving errors, driving violations and accident involvement. Ergonomics 1995b; 38:1036-48.
3. Parker D, West R, Manstead ASR, et al. Behavioural characteristics and road traffic accident involvement. Accid Anal Prev 1995; 27:571-581.
4. Evans L. A new traffic safety vision for the United States. Am J Public Health 2003; 93(9):1384-6.
5. Stradling S. Drivers who speed. Impact 2000; 9:38-41.
6. Taylor MC, Lyman Da, Baruya A. The effect of drivers’ speed on the frequency of road accidents. TRL Report 421. TRL Limited, Crowthorne, 2000.
7. Redelmeier DA, Tibshirani RJ, Evans L. Traffic-law enforcement and risk of death from motor-vehicle crashes: case-crossover study. Lancet 2003; 361(9376):2177-82. 8. Manstead ASR, Parker D. Reconstructing the theory of planned behaviour. Paper
presented at the Eleventh General Meeting of the European Association of Experimental Social Psychology, 13-18 July, Gmunden, Autria.
9. Parker D, Stradling SG , Manstead ASR. Modifying beliefs and attitudes to exceeding the speed limit: an intervention study based on the theory of planned behaviour. J Appl Soc Psychol 1996; 26: 1-19.
10. Trafimow D, Fishbein M. The importance of risk in determining the extent to which attitudes affect intentions to wear seat-belts. J Appl Soc Psychol 1994; 24: 1-11. 11. Forward SE. Measuring attitudes and behavior using the theory of planned behavior.
In T Rothengatter and EC Vaya (eds.) Traffic and Transport psychology: Theory and Application. Pergamon, Oxford, 1997.
12. Aberg L. Drinking and driving: Intention, attitudes and social norms of Swedish male drivers. Accid Anal Prev 1993; 25: 289-96.
13. Parker D, Manstead ASR, Stradling SG, et al. Intention to commit driving violations: an application of the theory of planned behavior. J Appl Psychol 1992; 77: 94-101. 14. Assum T. Attitudes and road accident risk. Accid Anal Prev 1997; 29(2):153-9.
15. Stasson M, Fishbein M. The relation between perceived risk and preventative action: a within-subject analysis of perceived driving risk and intentions to wear seat-belts. J Appl Soc Psychol 1990; 20: 1514-57.
16. SARTRE. European drivers and traffic safety: Principal results. Presses des Ponts-et-Chaussées, Paris, 1994.
17. SARTRE. The attitude and behaviour of European car drivers to road safety: Part 1: Report on principal results. SWOV, Leidschendam, 1998.
18. SARTRE. European car drivers and road risk. Part 1: Report on principal results. INRETS, Arcueil, 2004.
19. Iversen H, Rundmo T. Attitudes towards traffic safety, driving behaviour and accident involvement in the Norwegian Public. Ergonomics 2004, 47, 555-572.
20. Goldberg M, Leclerc A, Bugel I, et al. La Cohorte GAZEL 20 000 volontaires pour la
recherche médicale: Bilan 1989-1993. (In French). Paris, France: Les Editions
INSERM; 1994.
21. Berhanu G. Models relating traffic safety with road environment and traffic flows on arterial roads in Addis Ababa. Accid Anal Prev 2004; 36(5):697-704.
22. Abdel-Aty MA, Radwan AE. Modeling traffic accidents occurrence and involvement.
Accid Anal Prev 2000; 32: 633-42.
23. McCullagh P, Nelder JA. Generalized Linear Models. Chapman and Hall: London. 1989.
24. Janke MK. Accidents, mileage, and the exaggeration of risk. Accid Anal Prev 1991; 23 (2-3): 183–8.
25. Cliff N. Analyzing multivariate data, Harcourt Brace Jovanovich, San Diego (1987). 26. Horswill MS, Coster ME. The effect of vehicle characteristics on drivers' risk-taking
behaviour.Ergonomics 2002; 45(2): 85-104.
27. SARTRE. “European drivers and road risk”. Part 2: Report on in depth-analysis. INRETS, Arcueil, 2004.
28. Fergusson D, Swain-Campbell N, Horwood J. Risky driving behaviour in young people: prevalence, personal characteristics and traffic accidents. Aust N Z J Public Health 2003; 27(3):337-42.
29. Juhnke GA, Sullivan TJ, Harman AE. Attitude Changes in DWI Offenders: A Study of a. Short-Term Treatment Program. J Addict Offen Couns 1995; 15(2):51-59.
30. Cauzard JP, Quimby A. The attitudes of European drivers towards the enforcement of traffic regulations. 'ESCAPE' project, Deliverable 7, VTT, 2000.
31. BMRB Social Research. Attitude to road safety. Department for Transportation Omnibus survey, 2004 Report, London, UK.
32. Dignan M, Tillgren P, Michielutte R. Developing process evaluation for community based health education research and practice: A role for the diffusion model. Health Values 1994; 18:56–59.
Table 1. Association of risky driving behaviours and serious road traffic crashes. Rate Ratios (RR) with 95%
Confidence Intervals determined by generalized linear Poisson regression.
Rate Ratios of serious Road Traffic Crashes in the 2001-2003 period
Risky-driving behaviours N † Model 1 RR 95% CI ‡ Model 2 RR 95% CI § Model 3 RR 95% CI _______________________________________________________________________________________________________________ Maximum speed
Built-up areas (km/hour) 13681
20-50 4048 1 1
55-60 2460 1.00 (0.75 to 1.34) 1.02 (0.75 to 1.39)
65-70 767 1.29 (0.92 to 1.82) 1.36 (0.94 to 1.96)
≥ 75 712 1.52 (0.94 to 2.45) 1.56 (0.94 to 2.60)
* p≤0.05, ** p≤0.01, *** p≤0.001 † Model 1: Unadjusted Rate Ratios
‡ Model 2: Rate Ratios adjusted for sex (male/female), age (covariate of 3 categories), occupational category (a time-dependent covariate of 3 categories), alcohol consumption (a five-category time-dependent covariate describing quantity and frequency), annual mileage (a time-dependent covariate logarithmic transformed), and type of vehicle owned in 2001 (four-category covariate).
§ Model 3: Model 2 + Rate Ratios adjusted for all risky driving variables found to be significantly associated with serious RTA in Model 2.
Note: Figures 50, 90, 130 in bold respectively constitute speed limits in built-up areas, on rural roads, and on highways in France.
Table 2. Factor structure of pattern of attitudes towards traffic safety determined by principal component
analysis following varimax rotation
Factors of negative attitudes towards: Eigenvalue
Variance explained (%) Agree* N (%) Disagree* N (%) Loadings 1) Enforcement 2.87 15.1
1.1 to improve traffic safety, traffic laws should be enforced 6165 (45.7) 0.77 1.2 testing of blood alcohol content on roads should be increased 2062 (15.2) 0.72
1.3 speeds controls on roads should be increased 4901 (36.2) 0.54
2) Speed limitations 1.79 9.4 60-90 3097 1 1 1 95-100 5888 1.26 (0.91 to 1.75) 1.53 (1.06 to 2.21)* 1.52 (1.04 to 2.23)* 105-110 3276 1.29 (0.90 to 1.85) 1.56 (1.04 to 2.33)* 1.37 (0.87 to 2.14) ≥115 1403 1.29 (0.82 to 2.03) 1.56 (0.95 to 2.55) 1.12 (0.64 to 2.00) Highways (km/hour) 13605 80-130 5118 1 1 1 135-140 5190 0.90 (0.68 to 1.19) 0.93 (0.96 to 1.26) 0.80 (0.58 to 1.10) 145-150 2414 0.96 (0.68 to 1.34) 1.05 (0.72 to 1.52) 0.89 (0.59 to 1.34) ≥155 883 1.55 (1.02 to 2.36)* 1.71 (1.09 to 2.67)* 1.55 (0.91 to 2.64)
Drinking and driving 13646
Never 10559 1 1
Few times a the year 3047 1.17 (0.89 to 1.54) 1.12 (0.83 to 1.52)
Once a month or more 40 2.18 (0.47 to 10.21) 2.33 (0.51 to 10.69)
Risky use of cellular phone 13527
No cellular phone 5061 1 1 1
Stop to call and/or answer when circumstances appropriate 7792 1.10 (0.84 to 1.43) 1.06 (0.80 to 1.41) 1.01 (0.76 to 1.35)
Call or answer whatever the circumstances 674 2.00 (1.31 to 3.04)*** 1.95 (1.24 to 3.07)** 1.73 (1.09 to 2.74)**
Sleepy driving 13674
Never 8597 1 1 1
Few times a year 4917 1.57 (1.24 to 1.99)*** 1.57 (1.21 to 2.03)*** 1.47 (1.13 to 1.90)**
Once a month or more 160 2.99 (1.48 to 6.08)** 2.81 (1.28 to 6.15)** 2.16 (1.02 to 5.02)*
Violation of a traffic law deemed improper (speeding excluded) 13681
Never 6187 1 1 1
Sometimes 7328 1.30 (1.01 to 1.59)* 1.26 (0.98 to 1.63) 1.23 (0.95 to 1.60)
Regularly 168 2.62 (1.24 to 5.56)** 2.35 (1.02 to 5.40)* 2.11 (0.92 to 4.87)
2.1 speed limitation should depend on the driver’s skill 10243 (75.5) 0.74 2.2 speed limitation should depend on the vehicle’s performance 8226 (60.8) 0.68
3) Continuous assessment of driving ability 1.34 7.1
3.1 periodic testing of knowledge of the Highway Code is desirable 2247 (16.5) 0.72 3.2 driving licence holders should undergo mandatory regular
medical examinations 3287 (24.2) 0.70
3.3 driving licence renewal should be mandatory above a certain
age 7137 (49.0) 0.58
4) Alcohol prohibition on roads 1.18 6.2
4.1 maximum blood alcohol content while driving should be
reduced to 0 g/litre 7137 (52.5) 0.75
4.2 legal alcohol limit at the wheel should not depend on the
driver’s capacity for alcohol 1731 (12.4) 0.51
Cronbach’s coefficient alpha on the list of the 10 attitudes towards traffic safety items = 0.61.
* Positive and negative attitudes were coded as 0 and 1, respectively. Agreement with variables reflecting a negative attitude towards traffic safety (items 2.1 and 2.2) was coded 1 and disagreement with variables reflecting a positive attitude towards traffic safety (all other items) was coded 1.
Table 3. Mean and standard deviation (SD) for attitudinal factor scores (REGR factor scores)
according to the participant’s characteristics in 2001.
Variables Factor 1*** Enforcement Factor 2 **** Speed limitations Factor 3 † Ability assessment Factor 4‡ Alcohol prohibition Mean (SD) p Mean (SD) p Mean (SD) p Mean (SD) p
Sex < 10-3 < 10-3 0.92 < 10-3 Male 0.08 (1.01) - 0.04 (1.00) 0.00 (1.00) 0.05 (1.00) Female - 0.28 (0.88) 0.12 (1.01) -0.00 (1.00) -0.16 (0.98) Year of birth < 10-3 0.99 0.08 < 10-3 1939-1943 -0.05 (0.98) -0.00 (1.00) 0.03 (1.01) 0.04 (1.01) 1944-1948 0.08 (1.02) 0.00 (1.01) -0.01 (1.00) 0.00 (1.00) 1949-1953 -0.23 (0.90) -0.00 (0.96) -0.02 (0.99) -0.16 (0.98)
Socio-professional category 0.47 < 10-3 < 10-3 0.00 Unskilled workers -0.00 (1.00) 0.07 (1.04) 0.17 (1.10) 0.00 (1.05) Skilled workers 0.01 (1.00) 0.04 (1.01) 0.03 (1.00) -0.03 (1.01) Managers -0.02 (0.99) -0.08 (0.97) -0.09 (0.97) 0.04 (0.97) Alcohol consumption < 10-3 < 10-3 0.00 < 10-3 Non-drinker -0.19 (0.91) -0.01 (0.99) 0.01 (0.99) -0.37 (0.89)
Low quantity regular -0.13 (0.98) -0.04 (0.96) -0.03 (0.97) -0.13 (0.95)
Low quantity episodic 0.10 (1.07) -0.08 (0.93) 0.16 (1.09) 0.22 (0.93)
High quantity regular 0.01 (1.02) -0.03 (1.01) 0.01 (1.02) 0.15 (1.00)
High quantity episodic 0.17 (1.06) 0.14 (1.09) 0.04 (1.04) 0.46 (1.02)
Annual mileage < 10-3 < 10-3 0.01 < 10-3
<10000 -0.15 (0.92) -0.06 (0.98) -0.01 (1.00) -0.07 (1.01)
10000-20000 -0.16 (1.01) -0.03 (1.00) 0.02 (1.00) 0.04 (0.98)
>20000 0.17 (1.03) 0.05 (1.00) -0.05 (0.97) 0.00 (1.00)
Type of vehicle < 10-3 < 10-3 0.29 < 10-3
City and utilitarian cars -0.16 (0.96) -0.03 (0.98) 0.02 (1.02) -0.08 (1.00)
Small family cars -0.00 (0.99) -0.07 (0.99) 0.01 (1.00) 0.03 (0.99)
Large family cars,
MPV and 4x4 sport utility vehicles 0.06 (1.02) 0.03 (1.01) -0.01 (0.98) 0.03 (1.00)
Executive, luxury, and sports cars 0.19 (1.03) 0.13 (1.01) -0.05 (0.98) -0.04 (1.03)
* p= p for comparisons.
** Higher mean factor scores indicate more negative attitudes towards traffic safety. *** Scores in Factor 1 range from -2.36 to 2.95.
**** Scores in Factor 2 range from -2.20 to 3.41. † Scores in Factor 3 range from -1.66 to 3.33. ‡ Scores in Factor 4 range from -2.23 to 3.35.
Table 4. Associations between attitudinal factor scores and behavioural predictors of serious RTC
Behavioural predictors of serious RTC Maximum speed
more than 90 km/ in rural roads
Sleepy driving (a few times a year + once a month or more
often
Risky use of cellular phone ( call or answer
whatever the circumstances) Attitudinal factor scores
categorized according to percentiles OR (95% CI) OR (95% CI) OR (95% CI)
* p≤0.05, ** p≤0.01, *** p≤0.001.
† Scores ≤ 25th mean less negative attitude towards traffic safety
‡ Scores ≥ 75th mean more negative attitude towards traffic safety
All OR (Odds Ratios) were adjusted for age, gender and socio-professional category.
1: enforcement ≤ 25th (n = 2972) † 1 1 1 25th to 75th (n =5944) 1.35 (1.22 to 1.50)*** 1.04 (0.94 to 1.15) 1.09 (0.99 to 1.21) ≥ 75th (n =2972) ‡ 2.09 (1.83 to 2.39)*** 1.14 (1.03 to 1.29)* 1.31 (1.17 to 1.47)*** 2: speed limitations ≤ 25th (n = 2989) 1 1 1 25th to 75th (n = 5927) 1.27 (1.14 to 1.41)*** 0.90 (0.82 to 0.99)* 1.46 (1.32 to 1.62)*** ≥ 75th (n = 2971) 1.80 (1.58 to 2.05)*** 0.90 (0.81 to 1.00) 1.97 (1.75 to 2.21)*** 3: ability assessment ≤ 25th (n = 2971) 1 1 1 25th to 75th (n = 5943) 1.01 (0.91 to 1.13) 0.94 (0.86 to 1.04) 1.08 (0.98 to 1.20) ≥ 75th (n = 2973) 0.86 (0.76 to 0.98)* 0.93 (0.83 to 1.04) 1.10 (0.98 to 1.23) 4: alcohol prohibition ≤ 25th (n = 2971) 1 1 1 1.01 (0.92 to 1.12) 25th to 75th (n = 5939) 0.99 (0.88 to 1.10) 1.16 (1.05 to 1.29)** ≥ 75th (n = 2977) 1.12 (0.99 to 1.27) 1.45 (1.30 to 1.63)*** 1.07 (0.96 to 1.21)