Deformability of Plasmodium falciparum Parasitized Red
Blood Cells
by
John Philip Mills
B.S., Materials Science and Engineering,
Cornell University (2001)
Submitted to the Department of Materials Science and Engineering
in partial fulfillment of the requirements for the degree of
Doctor of Philosophy in Materials Science and Engineering
at the
MASSACHUSETTS INSTITUTE OF TECHNOLOGY
February 2007
©
Massachusetts Institute of Technology 2007. All rights reserved.
Author
7·
-.-~~~~~·~i M~t~;;~·;"ci~~~· ~d ·E~~~~e~~~
January 17, 2007
r
\
Certified by
0:1.-• •- ••••••..•.. -:--: •.••••...•••Subra Suresh
Ford Professor of Engineering
Thesis Supervisor
Accepted by
:/ ()
Y.--:~• .-=- ": ...•...-:- .•...Samuel M. Allen
pasco
Professor of Physical Metallurgy
Chair, Departmental Committee on Graduate Students
Deformability of Plasmodium falciparum Parasitized Red Blood Cells
by
John Philip Mills
Submitted to the Department of Materials Science and Engineering on January 17, 2007, in partial fulfillment of the
requirements for the degree of
Doctor of Philosophy in Materials Science and Engineering
Abstract
The biophysical properties of the human red blood cell (RBC) permit large deformations required for passage through narrow capillaries and spleen sinusoids. Several pathologic conditions alter RBC deformability that can result in abnormal circulation behavior. In the present work, altered RBC deformability caused by invading Plasmodium falciparum parasites, which are responsible for the disease malaria, is evaluted. P. falciparum para-sitized RBCs (pRBCs) display decreased deformability and novel cytoadherence properties, and sequester in the microcirculation. Parasite-exported proteins that interact with the
pRBC membrane are identified as the cause for these alterations. It is postulated that
sequestration of pRBCs is responsible for severe cases malaria. Previous studies of pRBC deformability could not characterize deformability over all parasite intra-erythrocytic de-velopmental stages due to experimental limitations. In the present work, a technique based on optical tweezers is developed to permit testing of pRBC deformability over all intra-erythrocytic stages. Optical tweezers can measure the force versus displacement response of a single RBC in uniaxial tension. The membrane shear modulus, which is a major fac-tor in determining overall RBC deformability, can be interpreted based on the single RBC force versus displacement response. Initial tests with optical tweezers conducted on healthy RBCs demonstrate that shear modulus values were consistent with accepted values from
standard techniques. Next, deformability of P. falciparum pRBCs was measured at all
intra-erythrocytic parasite developmental stages. Deformability is found to decrease ten-fold during parasitization, which is three to four times greater than previously estimated. Finally, optical tweezers experiments are combined with targeted gene disruption tech-niques to measure the effect of a single parasite-exported protein on pRBC deformability.
It is shown that Ring-infected Erythrocyte Surface Antigen (RESA), a membrane binding
parasite-exported protein, plays a major role in reducing deformability of pRBCs at the early stages of intra-erythrocytic parasite development. Furthermore, the effect of RESA on deformability is more pronounced at febrile temperature, which early stage pRBCs can be exposed to during a malaria attack, than at normal body temperature.
Thesis Supervisor: Subra Suresh Title: Ford Professor of Engineering
Acknowledgments
First, I acknowledge my advisor Prof. Subra Suresh for his support and guidance throughout the duration of my graduate program. Through his leadership and dedication to scientific research, I was afforded many unique experiences to conduct research projects involving international collaboration with other leading research institutions. For his devoted com-mitnwnt to my success as a graduate student at MIT and to my future scientific career, I extend my utmost gratitude to Prof. Subra Suresh.
I am extremely grateful for my interactions with Prof. Lorna J. Gibson. As a member of my thesis committee, she provided insightful evaluation of my research. Her continuous support and interest in my projects were always appreciated. In addition, as her teaching assistant for two graduate courses, I gained invaluable experience and insight regarding academic classes and lecturing.
I am appreciative of Prof. Ram Sasisekharan who served on my thesis committee. His insight and understanding of my research topic were extremely inspiring and helpful.
In addition, I thank Prof. Christine Ortiz for serving on my thesis committee during my final defense.
I extend tremendous gratitude to Dr. Monica A. Diez Silva and David J. Quinn for their significant contributions to the research projects presented in this thesis. Monica's
keen scientific perception and understanding of Plasmodium jalciparum and RESA were
critically important for topics addressed in this thesis. David's dedication to the design, construction and calibration of the optical tweezers instrument described in Section 3.2.2 is deeply appreciated.
I acknowledge the help of Prof. Matthew J. Lang and his research group for the devel-opment of the optical tweezers instruments described in Chapter 3. Particular appreciation is given to Ricardo Brau for his helpful discussions while developing the optical tweezers instrument described in Section 3.2.1 and his commitment to the design and construction of the instrument described in Section 3.2.2. Other members of the group, Jorge Ferrer, David Appleyard, Peter Lee, Dr. Peter Tarsa, and Carlos Castro are also acknowledged for their continual help. During early development of the optical tweezers instrument described in Sections 3.2.2, I acknowledge the help of Prof. Kevin T. Turner and Anna Chen.
For the computational modeling simulations used to interpret experimental data, I acknowledge the substantial work of Dr. Ming Dao, a research scientist in Prof. Suresh's research group, and Prof. Ju Li at The Ohio State University.
I am extremely grateful for the opportunity to complete research projects presented in Chapters 4 and 5 at the National University of Singapore in the laboratory of Prof. Chwee Teck Lim, who served as a second advisor. Interactions with Prof. Kevin S. W. Tan and his
laboratory were instrumental for the projects involving Plasmodium falciparum. The help
of Prof. Chorng-Haur Sow and Gregory Lee for preparing the optical tweezers instrument in the laboratory of Prof. Lim is very much appreciated. The assistance of Qie Lan for her help in testing reported in Chapters 4 and 5 and helpful discussions with Dr. Enhua Zhou are acknowledged.
The collaboration and extremely significant contributions of Prof. Genevieve Milon, Prof. Peter H. David, M.D., Prof. Odile Mercereau-Puijalon and Prof. Serge Bonnefoy at the Institute Pasteur are kindly acknowledged. These interactions evolved from the Ph.D. work of Dr. Monica A. Diez Silva while at Institute Pasteur. I am especially thankful for the very helpful discussions and interactions with Prof. Milon and Prof. David during their visits to MIT.
I extend deep appreciation to Ken Greene and George LaBonte who support the entire laboratory of Prof. Subra Suresh. Ken and George have been of great help throughout my time in the laboratory.
As an undergraduate at Cornell University, many professors were influential in my early development as a scientist. I acknowledge Prof. Stephen L. Sass, Prof. Shefford Baker, Prof. Michael Thompson, Prof. George Malliaras, Prof. Christopher Ober and Prof. Alan Zhender for stimulating my interest in research and academia. Prof. Timothy S. Fisher, currently at Purdue University, provided particular motivation that directly led to my success as a student at Cornell University.
I would also like to acknowledge the following people at MIT and various other in-stitutions for their helpful academic interactions: Dr. Tim Hanlon, Dr. Nuwong (Kob) Chollacoop, Prof. Krystyn Van Vliet, Dr. In-suk Choi, Prof. Pasquale D. Cavaliere, Prof. Trevor Lindley, Dr. Ruth Schwaiger, Prof. Sam Allen, Prof. Roger Kamm, Prof. Alan Grodzinsky, Li Ang, Dr. Marina Puig-de-Morales, Dr. George Lykotrafitis, Dr. Gerrit
Huber, Irene Chang, Nadine Walter, Dr. Alexandre Micoulet, Andrea K. Bryan, Anamika Prasad, Dr. Suliana Manley, Dr. Margaret Horton, Joe Walish, Solar C. Olugebefola, Lisa Joslin, Tiffany S. Santos, Alec P. Robertson, David Danielson, G.J. la 0', Grace Y. Kim, Robert D. Boyer, Prof. Megan Frary, Joost Bonsen, Karl Ruping, John Lock, David Robertson, Coleman Greene, Kevin R. Duda, Kevin M. Maloney, William Ouimet, Dan Burns, Dr. Brad Peterson, Scott Litzelman, Julie Cheng, Angelita Mireles, Kathy Farrell, Stephanie Bright and Ada Ziolkowski.
Contents
1 Introduction 21
2 Background
2.1 Red Blood Cell Deformability .
2.2 P. falciparum Parasitized Red Blood Cell Deformability
25
25
31
3.1 Overview
3 Methods
3.3 Analysis of Experimental Data
Optical Tweezers Experiments
35 35 36 38 44 51
Escape Force Method
Trap Stiffness Method 3.2.1
3.2.2 3.2
4 Healthy Red Blood Cell Deformability
4.1
4.2
4.3
Introduction .
Results and Discussion .
Summary .
57 57
57
5 P. falciparum Parasitized Red Blood Cell Deformability 71
5.1
5.2
5.3Introduction .
Results and Discussion .
Summary .
71
72
80
6 Effect of Plasmodial RESA Protein on P. falciparum Parasitized Red
Blood Cell Deformability 83
6.1
6.2
6.3
Introduction .
Results and Discussion.
Summary .
83
85
91
List of Figures
2-1 A schematic representation of the RBC membrane. Illustration from Alberts
et al. [1] . . . .. 26
2-2 The spectrin network cytoskeleton shown schematically. Image from Alberts
et al. [1]. 26
2-3 The spectrin network cytoskeleton shown in an electron micrograph. Image
from Alberts et al. [1]. . . .. 27
2-4 The P. falciparum parasite life-cycle. Illustration from Miller [2]. . . .. 32
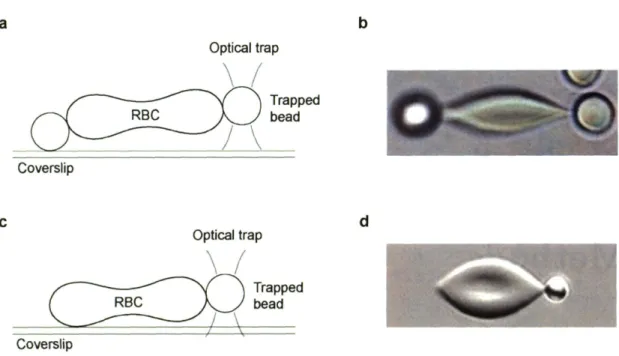
3-1 Test configurations for optical tweezers uniaxial tension experiments are
shown. (a) and (c) are schematic representations of two possible
experimen-tal geometries. In (a), the RBC is attached to two beads at diametrically
opposite ends, with one bead optically trapped above the surface and the other bead adhered to the coverslip. The contact points on the RBC serve as grips to stretch the cell. In (c) an alternate geometry is used to attached the
RBC directly to the coverslip at one small region instead of using a bead as in (a). In (b)and (d),a top view of test configuration (a) and (c), respectively,
is shown. (b) and (d) show RBC under some amount of uniaxial loading.
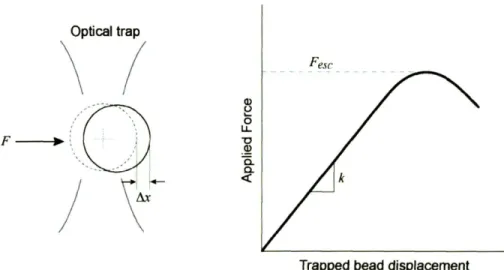
3-2 The schematic of an applied force exerted on an optically trapped bead is shown (left). The equilibrium position of the trapped bead under no applied force is shown by the dotted bead in the center of the optical trap. The applied force displaces the trapped bead from the center. The plot (right)
indicates the optically trapped bead position (~x) as a function of applied force (F) for a given incident laser power. The position of the bead relative to the optical trap center is proportional to the applied force for small dis-placements and is characterized by a trap stiffness, k. The force at which a bead will just escape the trap is defined as the escape force, Fesc . The magnitude of the trap stiffness and escape force scale proportionately with incident laser power. . . .. 37
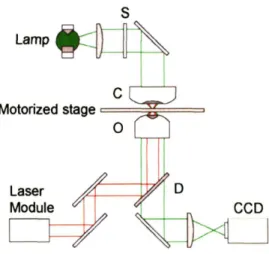
3-3 The optical design layout is shown for the escape force method optical tweez-ers instrument. The optical trap is formed by focusing the beam from the laser module (pathway shown in red) with the objective (0), which is also used to image the experiment with the microscope illumination (pathway shown in green). A CCD camera records RBC deformation experiments for post-test analysis. Not all components are shown. (C, condenser; S, shutter; D, dichroic mirror) . . . .. 39
3-4 Calibration of the optical trap using an escape force method [3]. A silica bead, 4.12 /-lm in diameter, is trapped in fluid (PBS and bovine serum albumin,
BSA) at a measured height, h = 3 /-lm, above the slide surface. As the
microscope stage and fixed slide are translated, the fluid exerts a viscous drag force on the trapped bead. When the viscous drag force is just equal to the escape force, the bead will escape the trap. . . .. 40
3-5 Force calibration plot showing the variation of trapping force with laser power for a 1.5 W diode pumped Nd:YAG laser source for a single optical trap
sys-tem. Non-linear trends below 80 mW laser power are not used for
3-6 Optical images of stretch tests show the projected axial diameter because of a height difference between trapped and attached beads. With the trapped
bead height known, the actual axial cell diameter can be calculated. . . .. 43
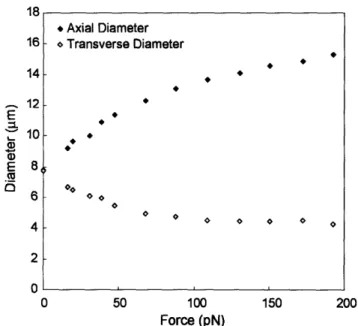
3-7 A representative force-displacement curve is plotted for a healthy RBC tested by the optical tweezers escape force method. The closed diamonds indicate the axial diameter and the open diamonds indicate the transverse diameter
of the cell for increasing levels of applied uniaxial force. 44
3-8 A diagram of the optical layout for the trap stiffness method optical tweezers instrument is shown. The trapping laser (red) and detection laser (dotted orange) are collinearly guided into the objective (0). The AOD automates laser trap positioning. The PSD detects the detection laser signal for measur-ing bead position. Experiments are recorded onto a CCD camera. The piezo stage is used for fine control of positioning the sample. Not all components are shown. (S, shutter; PBS, polarizing beam splitters; D, dichroic mirror; W, wollaston; C, condenser; F, filter) . . . .. 45
3-9 A force calibration by the trap stiffness method is plotted. Known drag forces are applied to a trapped bead by movement of the piezo stage at prescribed velocities. Forces are calculated by Stokes' law and appropriate corrections for wall effects (Faxen's law). The bead displacements within the trap are detected by the laser-based position detection system. The plot shows the linear relationship between applied force and trapped bead displacement for displacements close to the center of the trap. From the linear plot, the trap stiffness can be estimated. From this calibration, the trap stiffness is 0.73
3-10 A representative axial force-displacement curve is plotted for a healthy RBC tested by the optical tweezers trap stiffness method (closed squares). For comparison, the results from a representative escape force method test (shown also in Fig. 3-7) are superimposed (open diamonds). Both techniques con-verge to produce a similar force-displacement response for healthy RBCs. In comparison, the data is more continuous and extends to higher forces than the escape force method. . . .. 50
3-11 Schematic illustration of the hyperelastic constitutive response used in some of the computational simulations. (a) Uniaxial stress-strain response. (b) The variation of the membrane shear modulus with the progression of defor-mation of the first order hyperelasticity model, where strains are representa-tive of the large deformation response achieved in the present optical tweezers experiments. (c) The variation of the membrane shear modulus with respect
to shear strain of a higher order hyperelastic model. 53
4-1 A representative RBC optical tweezers test. The microscopy images show a
RBC under incrementally applied forces of (from top to bottom) 0, 20, 38, 48, 68, 88, 109, 130, 151, 173 and 193 pN during an optical tweezers experiment. As the applied force increase, the axial diameter (in the direction of uniaxial tension) increases and the transverse diameter (perpendicular to the axial diameter) decreases. Large geometrical changes to the RBC are observed for the cell to accommodate large deformations. Scale: The silica bead is 4.12 /-lmin diameter and the initial RBC diameter under no applied force is 8.4/-lm. 58
4-2 Force-displacement data from optical tweezers tests on single RBCs. The
average response from experimental data on sixteen healthy RBCs tested in uniaxial tension with scatter bars indicating the range of responses observed for (a) axial and b transverse cell diarnetcr change. Significant increase in axial diameter and decrease in transverse diameter (up to 2-fold) indicates the ability of the RBC to accomodate large deformations. When the applied load is removed, large deformations are fully recovered, indicating the elastic
4-3 Experimental results and computational predictions for RBC force-displacement response. The average experimental force-displacement curve (data points) and associated scatter bars are based on the sixteen optical tweezers RBC tests. To determine the healthy RBC membrane shear modulus from ex-periments, computational simulations are matched to the experimental data. The three computational force-displacement curves shown are generated by varying the RBC membrane shear modulusJ-Lo
=
5.3,7.3 and 11.3J-LNjm, and J-Lf=
13.9,19.2 and 29.6J-LNjm, respectively, invoking a higher order hypere-lastic constitutive response, Equation 3.7, which assumes constant membrane volume (not constant area). The closed data points (black diamonds) repre-sent the portion of the force-displacement curve that reflect the initial shear modulus (J-Lo), whereas the open points (white diamonds) represent the large deformation nonlinear response which the higher order hyperelastic term(J-Lf) captures. From experimental and computational analysis, the RBC mem-brane shear modulus is measured to be within the range of 5.3 -11.3J-LNjm, with an average of 7.3 J-LN jm. This figure is adapted from Mills et al. [4] .. 614-4 Images of an RBC and finite element RBC model under uniaxial tension at 0,
67, 130 and 193 pN. Optical images (left column) are obtained from experi-mental video photography. A top view (center column) and half model 3D view (right column) correspond to large deformation computational simu-lation of the biconcave RBC with f.-lo = 7.3 f.-lNjm, f.-lf = 19.2 f.-lNjm). The middle column shows a plan view of the stretched biconcave cell undergoing large deformation at the forces indicated. The predicted shape changes are in agreement with experimental observations. The color contours in the mid-dle column represent spatial variation of constant maximum principal strain. The right column shows one half of the full three-dimensional shape of the cell at different imposed forces. This figure is adapted from Mills et al. [4]. Scale: The silica bead is 4.12 /Lm in diameter and the RBC under no applied
4-5 RBC membrane shear modulus measured by optical tweezers tests at
labora-tory (2rC), normal body (3IC) and febrile (4rC) temperatures. The shear
modulus value was goung to be relatively unaffected by temperature over within the range of temperatures investigated. . . .. 64
4-6 RBC membrane shear modulus measured at various temperatures by
mi-cropipette aspiration [5] and in the present optical tweezers study (not previ-ously published). Over the range of temperatures from laboratory to physio-logical conditions, both techniques show relatively constant RBC membrane shear modulus measurements. . . .. 65
4-7 Best fits to the experimental relaxation data are plotted. Using relaxation data from eight different experiments, the characteristic time of relaxation was estimated to be
t
c = 0.19±
0.06 s using Eq. 4.2. This figure is adapted from Mills et al. [4] . . . .. 665-1 Representative optical images of RBCs and pRBCs at indicated intra-erythrocytic parasite developmental stages(left column) under no applied force, (center
column) 68
±
12 pN and (right column) 151± 20 pN of uniaxial appliedforce. The images of the healthy RBC illustrate the large strains that the
RBC membrane can withstand. The deformability of healthy RBCs was
presented in detail in Chapter 4. Deformability is progressively decreased from the ring stage to the trophozoite stage to the schizont stage in pRBCs. Parasite-free RBCs were found to be somewhat less deformable than healthy
RBCs not exposed to P. falciparum cultures. This figure was adapted from
5-2 Force-displacement data from optical tweezers tests on RBCs and pRBCs at each intra-erythrocytic parasite developmental stage. The (a) axial diameter increase and (b) transverse diameter decrease is measured from uniaxial ten-sion tests of single RBCs or pRBCs. Data points are averages from repeat experiments for each test condition: healthy RBCs (7 samples), parasite-free RBCs (8), ring stage pRBCs (5), trophozoite stage pRBCs (5) and schizont stage pRBCs (23). The scatter bars represent the range of force-displacement responses measured for each condition. Progressive loss of de-formability is captured by the changes in force-displacement response with intra-erythrocytic parasite maturation from ring stage to trophozoite stage to schizont stage. The dotted lines denote predicted variations of the axial diameter as a function of applied uniaxial force, based on three-dimensional finite element simulations described in Section 3.3. The RBC and pRBC membrane shear modulus values are extracted from the simulations that predict the experimentally measured force-displacement data for each test condition. This figure is adapted from Suresh et al. [6] . . . .. 75
5-3 Measured RBC and pRBC membrane shear modulus values extracted from
the force-displacement data presented in Figure 5-2 is compared to previous estimates by micropipette aspiration [7] and laminar shear flow [8]
meth-ods. (Shear modulus values plotted are based on analysis assuming that
the membrane maintains constant volume, not the classical assumption of constant membrane area, as described in Section 3.3.) Bars represent aver-age measurement and scatter bars indicate the range of measurements for a given condition. The average values of membrane shear modulus determined by optical tweezers uniaxial tension tests (black bars) are 5.3 jjN/m (for
healthy RBCs), 8 jjN/m (parasite-free RBCs) , 16 J.LN/m (ring stage pRBCs),
21 J.LN/m (trophozoite stage pRBCs) and 53 J.LN/m (schizont stage pRBCs).
Optical tweezers, used in the present study, is the only technique able to measure schizont stage pRBC deformability. The numbers on each bar in-dicate the number of samples tested for the given condition. This figure is
5-4 Results from the work of Glenister et al. [7] (white bars) showing the effect of mature stage exported proteins EMP3 and KAHRP on pRBC deformability at mature stages based on EMP3 and KAHRP knock out parasites derived from knobby 3D7 P. falciparum. For comparison, experimental results on 3D7 from the present study (Fig. 5-3) are also provided (black bars). . . .. 80
6-1 Imrnunofiuorescence images of P. falciparum pRBCs: Band 3 labeled in red;
parasite labeled in purple; RESA labeled in green. (a) Wild type pRBCs at
the ring stage show RESA present at the RBC membrane. (b) resal-KO
pRBCs obtained by gene disruption did not express any detectable RESA
protein. . . .. 85
6-2 Deformability of control, parasite-free and late ring stage (14- 20 h post inva-sion) pRBCs at room temperature (25DC). Tests were performed on cultures
of(a) control RBCs, (b) wild-type resal+ pRBCs, (c) resal-KO pRBCs and
(d) resal-rev pRBCs. This figure was adapted from a submitted manuscript
[10] . . . .. 86
6-3 Deformability over progressive parasite maturation from ring (12 - 24 h post-invasion) to the trophozoite stage (24 - 36 h post-post-invasion) at room tempera-ture (25DC). Tests were performed on cultures of (a) wild-type resal+ pRBCs
and (b) resal-KO pRBCs. . . .. 88
6-4 Deformability of RBCs and pRBCs at normal body (3iC) and febrile (41DC)
temperatures. Tests were performed on cultures of (a) healthy RBCs, (b)
Chapter
1
Introduction
Mechanical properties of the human red blood cell (RBC) allow for repeated large elastic deformations while circulating continuously in vivo. Severe complications can result when the deformability of RBCs is compromised due to pathologic conditions. A variety of blood disorders are known to modify RBC structure thereby altering mechanical properties of the membrane and, consequently, altered or insufficient blood circulation. Hereditary disorders such as spherocytosis, elliptocytosis ovalocytosis [11-13] and sickle cell disease [14-16], and infectious diseases such as malaria [7, 17] are all known to involve significant changes to the deformability properties of RBCs. In addition to the altered deformability of the RBC, changes to cytoadherence are also known to occur as a consequence of ultrastructure changes engendered by disease states [17].
Mechanical property measurement of pathologic RBCs at the single-cell level poses technical challenges because of the small length-scales (J.lm) and forces (picoNewton, pN) needed to study RBC deformability by recourse to continuous records of force versus
de-formation. In turn, the changes to deformability of pathologic RBCs are typically not
completely characterized despite extensive knowledge of the biochemical composition of these cells. In this thesis, measurement of RBC deformability is applied to the study of changes caused by RBC parasitization by P. falciparum. For the case of Plasmodium
fal-ciparumparasitized RBCs, it is known that significant changes to deformability properties result in sequestration of parasitized RBCs in small capillaries thereby causing decreased
O2 perfusion to surrounding tissues [2]. It is postulated that such sequestration and
de-struction of parasitized RBCs could be implicated in life-threatening cases of severe malaria. While adhesion properties of P. falciparum parasitized RBCs have been studied, much less is known about deformability changes induced by the parasite. For example, the standard technique of micropipette aspiration that is used to measure deformability of RBCs has technical limitations that prevent deformability measurements of P. falciparum parasitized RBCs at the mature stages of parasite development when sequestration occurs.
To study the deformability of P. falciparum parasitized RBCs at the single-cell level over all stages of intra-erythrocytic parasite development, two new optical tweezers exper-imental techniques were developed. Results extracted from the optical tweezers technique were shown to be consistent with accepted results from micropipette aspiration experiments for healthy RBCs, while providing significantly enhanced capabilities for probing the me-chanical properties of pathologic cells in a controlled and quantitative manner. The new optical tweezers instruments were used to measure the deformability of parasitized RBCs over all parasite development stages. In addition, the optical tweezers technique was coupled with gene disruption techniques to study protein-level effects on deformability.
In Chapter 2, background information on healthy RBC deformability is provided along with a description of intra-erythrocytic development of P. falciparum and associated deformability changes.
Methods of both optical tweezers techniques are provided in Chapter 3.
Results are presented in Chapter 4 on elastic and viscoelastic properties of healthy RBC membranes and compared to accepted values based on micropipette aspiration exper-iments. Next, Chapter 5 presents results on the deformability of P. falciparum parasitized RBCs over all intra-erythrocytic parasite developmental stages. In Chapter 6, the effect of parasite exported protein RESA, which interacts with the RBC membrane, is characterized.
Chapter 2
Background
2.1
Red Blood Cell Deformability
The deformability of human RBCs is critically important for normal in vivo circulation
re-quired for transport of O2 and C02. The resting biconcave discocyte shape of a RBC (8{tm
in diameter and 2.5ILmin thickness, on average) must quickly and reversibly accommodate large deformations when passing through narrow capillaries as small as 2{tm in diameter.
The RBC membrane can experience strains higher than 100% and shear forces in excess
of 100pN [18]. During the approximate 120 day lifespan, RBCs can circulate up to half a million times through narrow capillaries and spleen sinusoids. Aged RBCs with decreased deformability can be detected and removed by macrophages in the spleen [1].
The RBC consists of an outer membrane that surrounds the cytosol fluid containing hemoglobin for gas transport. The low viscocity of the cytosol and high surface-to-volume ratio of the biconcave shape facilitate large deformations of the RBC [17]. The other key property for RBC deformability is the highly elastic membrane that supports shear forces during large deformation.
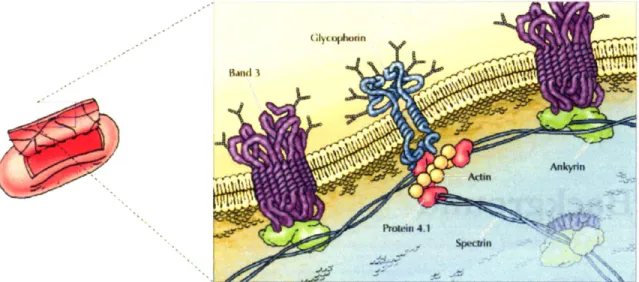
The superstructure of the RBC membrane is illustrated in Figure 2-1 and consists
of an outer phospholipid bilayer and supporting associated cytoskeletal spectrin network. The biochemical composition of the membrane is well characterized. The phospholipid
bi-Bdnd 3
(11 (.Optlonn
Figure 2-1: A schematic representation of the RBC membrane. Illustration from Alberts et
al. [1] ddu in I I lfopomvo in (AI 100 n
Figure 2-2: The spectrin network cytoskeleton shown schematically. Image from Alberts et
Figure 2-3: The spectrin network cytoskeleton shown in an electron micrograph. Image from Alberts et ai. [1].
layer contains cholesterol molecules and integral proteins to which the spectrin network is attached. The polar nature of the phospholipid molecules imparts area conservation and some amount of bending rigidity to the RBC. However, the bilayer can not support shear forces that occur during deformation through narrow capillaries and spleen sinusoids. The shear resistance is derived mainly from the spectrin network which is shown schematically in Figure 2-2. Spectrin heterodimers, which consist of intertwinedQ and{3 spectrins, associate
head-to-head to form tetramers. At each end of the tetramer, f-actin and band 4.1 form junctional complexes that link spectrin tetramers together to for the two-dimensional cy-toskeletal network. The junctional complexes are connected by integral protein glycophorin to the phospholipid bilayer. Band 3 and and ankyrin form a complex that also anchors the spectrin network to the phospholipid bilayer. Collectively, the composite properties of the phospholipid bilayer and spectrin network combine to give the unique elastic properties of the membrane. The importance of RBC superstructure to membrane deformability is high-lighted by membrane cytoskeleton defects that alter normal RBC circulation behavior. For the cases of spherocytosis, elliptocytosis and ovalocytosis, defects in the spectrin network lead to loss of normal biconcave shape and decreased capacity for deformation [11-13].
For healthy RBCs, the composite properties of the phospholipid bilayer and associ-ated spectrin network have been characterized by various techniques. The bending modulus,
Bo,
has been measured to be in the range of 1.7 x 10¹⁹ - 9 X 10¹⁹ N·m [19, 20]. The area[21-24]. Also measured by micropipette aspiration, the shear modulus of the RBC mem-brane is 4 - 10 J.1N1m. The strong resistance of the phospholipid bilayer to change in area
causes the area expansion modulus to be orders-of-magnitude larger than the shear modu-lus. Ithas been demonstrated that the bending modulus does not contribute significantly to the large deformation response in comparison to the shear modulus [25]. For these reasons, it is known that the shear modulus, which is a property related to the spectrin network, of the RBC membrane is the major factor in determining overall RBC deformability [21].
Mechanical response of RBCs has long been studied by means of the micropipette aspiration method (e.g., [26, 27]) whereby a single cell is aspirated into a glass tube by application of suction pressure. From comparisons of geometry changes of the aspirated cell with that predicted from analytical and numerical models of deformation, its elastic response during the application of the pressure and its viscoelastic relaxation response upon release of pressure are estimated. Two main limitations of micropipette aspiration are the complex stress state that makes interpretation difficult and that only a portion of the cell membrane can be sampled. Furthermore, for the case ofP. faiciparum parasitized RBCs, the increased adhesion of these cells causes increased friction along the inner wall of the rnicropipette which cornplicates interpretation of these results. Well-defined stress states can in theory be applied to an entire RBC without complications due to friction by implementation of optical tweezers.
Direct tensile stretching of the human RBC using optical tweezers to extract elastic
properties was first reported by Henon et ai. [28] who attached two silica beads
non-specifically to diametrically opposite ends of the cell, trapped both beads with laser beams, and imposed tensile elastic deformation on the cell by moving the trapped beads in opposite directions. Forces were calibrated by subjecting a trapped bead to counter flow following
the procedures outlined by Svoboda and Block [3] and Simmons et ai. [29]. Stokes law
was used to estimate the force on the trapped bead from known fluid velocity. With a 1.064 J.1m Nd:YAG laser beam of 605 mW maximum emission power and silica beads 2.1 J.1m in diameter, they imposed maximum tensile forces that were estimated to be 56 pN on
discocytic and osmotically swollen, nearly spherical cells. By employing simple analytical expressions based on two-dimensional linear elastic, small deformation, idealization of the cell, they examined variations in only the transverse diameter of the cell with applied
force, and ignored possible contributions to deformation arising from the bending stiffness
of the cell membrane and cytoskeleton. Finite contact between the beads and the cell
membrane during stretching by optical tweezers was also not considered. The in-plane shear
modulus of the cell membrane was estimated from this approach to be 2.5 ± 0.4 J-lN/m.
This estimate is lower than the range of shear modulus values of 4 to 10 J-lN/m obtained from a number of independent investigations which employed the more commonly known micropipette aspiration technique [20, 26, 30, 31]. Studies by the same group [32] employing triple bead optical tweezers measurements showed that the area expansion modulus and shear modulus of RBCs were higher in an isotonic buffer than in a low hypotonic buffer.
Sleep et ai. [33] also estimated elastic properties of the human red blood cells by optical tweezers where two polystyrene latex beads of 1J-lm diameter were trapped using
a 1.047 J.lm Nd:YLF laser beam. In this experiment, one bead was held fixed and the
other moved with a second trap to induce tensile deformation in the cell. Trap stiffness was estimated from the Brownian motion of the trapped bead. The variation of imposed force, up to a maximum of 20 pN, as a function of the transverse diameter, was reported for permeabilized spherical ghost cells whose deformation at a given force was about one half that of discocytic and osmotically swollen spherical cells. By invoking an axisymmetric cell model of Parker and Winlove [34], they estimated the in-plane shear modulus from optical tweezers studies to be nearly two orders of magnitude larger than those reported by Henon et ai. [28]. The analyses of deformation for extracting elastic properties also invoke rather severe assumptions on cell shape (e.g., idealization of a biconcave cell as a two-dimensional planar disc by Henon et ai. [28], and neglect of the effects of the relatively large contact region between the cell and the beads in this study and in the one by Sleep et ai. [33]). These theoretical assumptions along with possible errors arising from variations in force calibration procedures could account for the disparity between the initial optical tweezers based shear modulus values and accepted values based on standard techniques.
All of the foregoing studies of cell deformation by optical tweezers involve primarily small elastic deformation at low applied forces. Studies of deformation conditions at larger strain levels inevitably require much higher forces, which are conceptually feasible to obtain
using the optical tweezers method. In fact, a study of unfolding of titin molecules by
optical tweezers where a 1046 nm Nd:YAG laser with a maximum power of 1.5 W was used to trap a 3 l.tm diameter latex bead and where the force calibration was performed using the Stokes law method.
In principle, the optical tweezers method affords several potential advantages for the study of deformation of single biological cells:
• It provides a means to impose simple and well-controlled stress states, such as direct tensile stretching in small or large deformation, to biological cells. In this sense, it is complementary to, and conceptually simpler to interpret than, the widely used micropipette aspiration method [18, 20].
• The stress state imposed on the cell can be systematically varied by employing multiple beads which are attached to cell membranes, whereby the constitutive response of the cell membrane and cytoskeleton can be probed for different chemical and biological conditions.
• Optical tweezers stretching of cells in one or more directions is also amenable to three-dimensional computational simulations which can be used to guide and interpret experimental observations.
• The relaxation response of the stretched cell upon release of the tensile stretch in the optical tweezers experiments can also be used to extract the viscoelastic response of the cell.
• This method further provides a possible means to investigate systematically the effects of the progression of a pathological state, such as Plasmodium falciparum parasitized
RBCs, on the deformation characteristics and elastic and viscoelastic properties of the cell membrane [6]. Possible complications arising from micropipette aspiration of such infected cells, such as stress concentration at the ends of the micropipette and adhesion of the infected cell to the inner walls of the micropipette, can potentially be circumvented in the optical tweezers method.
Despite these advantages, uncertainties exist in the calibration of the force imposed on the cell by the optical tweezers method, which is in the pN to several hundred pN range.
Such complications have led to considerable variation and scatter in the experimental data reported previously in the literature. A comparison of the optical tweezers method with other techniques available for the study of mechanics of single cells and populations of cells can be found in recent reviews [36, 37].
2.2
P. falciparum
Parasitized Red Blood Cell Deformability
Alnollg the four different species of Plasmodium that can parasitize human RBCs, P.
fal-ciparum and P. vivax are the most common, with the former resulting in more severe form
of malaria [2]. Malaria induced by P. falciparum is the most widespread parasitic
dis-ease in humans with an estimated annual infection rate of several hundred million people worldwide and an estimated annual mortality rate of several million, mostly children. The intra-erythrocytic stage of P. falciparum occurs after the parasite (merozoite) leaves the liver to invade RBCs, and during the subsequent asexual stage lasting about 48 h, the par-asite nucleates inside the RBC to producing up to 20 new merozoites 2-4. Each merozoite can subsequently invade other healthy RBCs.
When a merozoite invades an RBC, it undergoes pronounced structural changes within the RBC. The intra-erythrocytic developmental stages of the parasite are broadly classified as:
• ring stage: with characteristic thin discoidal, flat or cup-shaped ring features whose formation commences at about 30 min from the time of invasion of the parasite into the RBC
• trophozoite stage: with irregular bulges or knobs at the surface of the parasite ap-pearing at about 24 h after invasion, parasite growth inside the RBC and formation of small pigmented regions, and
• schizont stage: with nuclear division of the parasite resulting in the multiplication of the number of merozoites, greater spread of parasite and pigmented regions within cell volume, and export of parasite proteins to the RBC membrane causing severe distortion of the cell cytoskeleton and membrane some 3648 h after invasion.
Figure 2-4: The P. falciparum parasite life-cycle. Illustration from Miller [2].
In the late schizont stage, the parasitized RBC also exhibits a change in shape, which is spherical compared to the biconcave shape for the healthy RBC.
Reviews of structure evolution during these developmental stages has been previ-ously reported [2, 17, 38].
An important outcome of the full development of P. falciparum within the RBC
is that it increases the adhesion of infected RBCs to inner linings of small blood vessels. Single-cell mechanical property measurements performed using the micropipette aspiration method [39, 40] and the lalninar shear flow method [8] also show that RBCs parasitized by P. falciparum stiffen considerably with marked increases in their shear moduli. Profound alterations to the mechanical properties and adhesive response of the parasitized RBCs cause them to sequester in the microvasculature of major organs. Life-threatening consequences of such sequestration can include cerebral malaria, hypoglycaemia, metabolic acidosis and respiratory distress [2].
and schizont when change in deformability properties could have an effect on sequestration. It has been shown that for P. vivax that parasitized RBCs do not stiffen and do not have
adhesion properties like P. falciparum. P. vivax, consequently, does not become sequestered
Chapter 3
Methods
3.1
Overview
The single cell force-displacement response of RBCs is determined by two different methods, each developed as part of this project, that employ the optical tweezers technique of direct RBC stretching: an escape force method and a trap stiffness method. The former method is based on the escape force needed to dislodge a bead from the optical trap. The latter method involves tracking the position of a bead within the optical trap; the relationship between force and bead position is calibrated prior to experiments. The escape force method requires a less complicated experimental set-up, but significant post-processing of data; the trap stiffness method has a complicated experimental layout that requires fine alignment of optical components, but provides a higher degree of accuracy in force and displacement measures and has significant automation to conduct tests and acquire data in real-time. The escape force method is used to measure the force-displacement response of healthy and P. falciparum parasitized RBCs in Chapters 4 and 5. The trap stiffness method, is used to obtain results on genetically disrupted P. falciparum parasitized RBCs presented in Chapter 6.
The overall approach of the optical tweezers method begins by attaching beads to specific locations on the RBC membrane. Calibrated pN-level forces generated by optically trapping the beads attached to the cells (either specifically or non-specifically) are used
a c Optical trap
\ !
~TrapPed
RBC bead)
\
Coverslip Optical trap\ !
~Trapped
RBC bead Coverslip b dFigure 3-1: Test configurations for optical tweezers uniaxial tension experiments are shown. (a) and (c) are schematic representations of two possible experimental geometries. In (a), the RBC is attached to two beads at diametrically opposite ends, with one bead optically trapped above the surface and the other bead adhered to the coverslip. The contact points on the RBC serve as grips to stretch the cell. In (c) an alternate geometry is used to attached the RBC directly to the coverslip at one small region instead of using a bead as in (a). In (b) and (d), a top view of test configuration (a) and (c), respectively, is shown.
(b) and (d) show RBC under some amount of uniaxial loading. Scale: (b) beads are 4 {lm
in diameter and (d) the bead is 2 /-lm in diameter.
to deform single RBCs. By monitoring the displacements of an RBC under calibrated
forces, the force-displacement response can be experimentally determined. Details of the two optical tweezers methods are provided in Sections 3.2.1 and 3.2.2.
3.2
Optical Tweezers Experiments
The single cell force-displacement response of RBCs is experimentally measured by the optical tweezers method. The two test configurations used for uniaxial tension tests are shown in Figure 3-1. In Figure 3-1a, an RBC is attached to two beads at diametrically opposite locations on the membrane. The position of the bead attached to the coverslip
~
o u. u .~a.
c..«
FescTrapped bead displacement
Figure 3-2: The schematic of an applied force exerted on an optically trapped bead is shown (left). The equilibrium position of the trapped bead under no applied force is shown by the dotted bead in the center of the optical trap. The applied force displaces the trapped bead from the center. The plot (right) indicates the optically trapped bead position (~x) as a function of applied force (F) for a given incident laser power. The position of the bead relative to the optical trap center is proportional to the applied force for small displacements and is characterized by a trap stiffness, k. The force at which a bead will just escape the trap is defined as the escape force, Fesc . The magnitude of the trap stiffness and escape force scale proportionately with incident laser power.
can be controlled by movement of a motorized microscope stage to accurately position the sample. The other bead is optically trapped above the coverslip surface. In the other test configuration illustrated in Figure 3-1c, a small portion of the RBC membrane is attached directly to the coverslip on the left side of the RBC as shown. Contact points on opposite sides of the RBC serve as grips to stretch the cell in uniaxial tension.
The force-displacement test is performed by moving the stage to apply deformations while forces are measured by either the escape force method or trap stiffness method. Figure 3-2 illustrates the equilibrium position of a trapped bead as a function of increasing levels of applied force for a constant trapping laser power. The force exerted by the trap scales proportionately with trapping laser power. The escape force method (Sec. 3.2.1) is based on calibrating the maximum trap force (escape force, Fesc ,Fig. 3-2) at different trapping laser powers. Using various trapping laser powers, a range of calibrated forces can be exerted
on an RBC. The trap stiffness method (Sec. 3.2.2) involves calibrating the linear region of the equilibrium trapped bead position versus applied force (Fig. 3-2). The position of a bead within the trap is determined by a separate laser-based position detection system. Position detection involves a second low-powered laser in the same path as the trapping laser, but that has a different wavelength and does not contribute significantly to trapping forces. The signal of the detection laser after passing through a trapped bead is imaged onto a position-sensitive diode (PSD). The PSD signal can be used to continuously measure the position of a trapped bead in real-time. After calibration of the trap stiffness, the force during a trap stiffness method experiment can be detected continuously by tracking the trapped bead position with the laser-based position detection system. Therefore, the force-displacement curve can be obtained from a single stretch at a given laser power with the trap stiffness method.
The first experiments reported in Chapters 4 and 5 were conducted using the escape force method. This technique required a relatively simple experimental set-up and permitted force-displacement data collection with substantial post-processing effort. The trap stiffness method represents a refinement of the initially developed escape force method. The design of the trap stiffness lnethod permits lnorc accurate force-displacement measurement and lnore automated testing, while requiring significantly more precise alignment and calibration of all components. The trap stiffness method, completed after results were obtained for Chapters 4 and 5, was used for results presented in Chapter 6.
3.2.1 Escape Force Method
The escape force optical tweezers method is illustrated in Figure 3-3 and described in
more detail in Mills et al. [4] . The design incorporates an inverted microscope (Leica
Microsystems, Wetzlar, Germany) and a trapping laser module (1064 nm Nd:YAG, 1.5 W, LaserTweezers, Cell Robotics, Inc.) to form a single-bead gradient optical trap. The trap is formed by focusing the laser through an oil immersion lens (100x magnification) which is also used to view the sample during tests. Optically trapped silica beads (4.12 I"m in diameter, Bangs Laboratories, USA) attached to an RBC (Fig. 3-1a) were used to apply calibrated forces to the cell. The relatively high laser power and large bead diameter
s
Motorized stage==~<===
Figure 3-3: The optical design layout is shown for the escape force method optical tweezers instrument. The optical trap is formed by focusing the beam from the laser module (path-way shown in red) with the objective (0), which is also used to image the experiment with the microscope illumination (pathway shown in green). ACCD camera records RBC defor-mation experiments for post-test analysis. Not all components are shown. (C, condenser; S, shutter; D, dichroic mirror)
facilitate exertion of forces on the cell that are about three to six times greater than those reported by similar earlier studies [28, 33]. The large forces are used to measure nonlinear single RBC force-displacement response and viscoelastic recovery.
Force calibration
Calibration of the optical tweezers instrument is performed by an escape force method [3]. In this technique, which is referred to as the stage movement technique, the force required to displace a trapped bead out of the optical trap is measured by applying a known viscous drag force by moving a motorized stage. The calibration procedure begins by trapping a bead in solution (phosphate-buffered saline (PBS) with 0.1 mg/ml bovine serum albumin (BSA)) at a measured height (h
=
3/-lm) above the coverslip surface. The solution and height of the trapped bead above the slide surface are kept unchanged throughout cal-ibration and experimental tests. As the microscope stage is moved at a specified velocity, the fluid exerts a viscous drag force on the trapped bead, as shown in Fig. 3-4. The viscous drag force, Fd, equals the magnitude of the escape force, Fese , when the bead just escapes the trap. From the stage velocity, Vese , at the point of escape, the escape force is estimatedFluid
\ I
°1
) \h
Fluid\ I
Coverslip Stage at rest Coverslip Stage velocityv~Figure 3-4: Calibration of the optical trap using an escape force method [3]. A silica bead, 4.12 /-lm in diameter, is trapped in fluid (PBS and bovine serum albumin, BSA) at a measured height, h = 311m, above the slide surface. As the microscope stage and fixed slide are translated, the fluid exerts a viscous drag force on the trapped bead. When the viscous drag force is just equal to the escape force, the bead will escape the trap.
as
(3.1)
The viscous drag coefficient,
f3,
for a spherical bead located near a wall is described by Faxens Law [3],f3
= 61r'T]r(1- 196(r/h)
+
~(r/h)3 - 2~6(r/h)4 - 116(r/h)5(3.2)
where, for the reported experiments, the bead radius, r = 2.06 11m, height of the bead above the wall, h
=
311m, and fluid viscosity, 'T]=
0.0013 Pa·s. Equation 3.1 takes the form of Stokes' law, F = 61rr'T]v, for a bead located far from the coverslip.The stage move~enttechnique described here represents an extension of fluid cham-ber technique used in previous work [25, 41]. The fluid chamcham-ber technique imposes a viscous drag force by flowing fluid through a narrow channel where a bead is trapped. Fluid velocity, estimated by tracking the speed of untrapped beads, is used with Equation 3.1 to determine the escape force. However, this calibration method has some significant limitations. First,
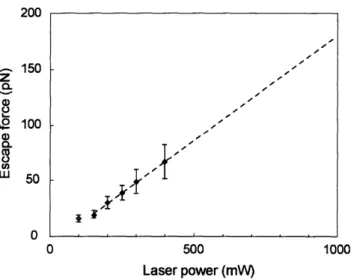
untrapped beads used to determine fluid velocity flow at various heights above the coverslip that may not be consistent with the velocity in Equation 3.1. Untrapped beads tend to flow along the surface of a slide and produce complex fluid flow near the coverslip which makes fluid velocity estimates very approximate. Second, steady fluid flow is difficult to achieve for the lowest flow rates to calibrate forces below 70 pN. Third, the scatter in cali-bration of escape force is considerably greater than for the stage movement technique. The stage movement technique used in this work provides a more accurate escape force method to determine the velocity of the fluid from known stage velocity, thereby resolving some limitations of the fluid chamber method. The escape force generated over a range of laser powers is shown in Fig. 3-5. The incident laser power reported is measured prior to entering the objective lens. Due to losses from reflection and absorption, an incident laser power of 917 mW was observed for the maximum laser power setting of 1.5 W. The maximum stage velocity limits direct calibration at 400 mW of incident laser power. The escape force values for higher laser power is linearly extrapolated from the calibration data in Fig. 3-5. The maximum incident laser power, 917 mW, corresponds to an extrapolated escape force estimate of 193
±
20 pN. The linear relationship between laser power and escape force is consistent with theoretical predictions [42] and empirical evidence [3]. Multiple calibration runs were performed at each power level before each set of experiments.Specimen Preparation
Specimen preparation for testing healthy RBCs and P. falciparum parasitized RBCs involves the following steps. The general procedure for achieving the test configuration in Fig. 3-1 is described for tests reported in Chapters 4 and 5. The first step is a lancet finger prick to obtain a small sample of healthy fresh blood. P. falciparum parasitized RBCs were obtained from a microbiology laboratoryl. The blood is centrifuged in PBS-BSA solution (0.1 mg/ml) three times at 1,000 rpm to wash and isolate RBCs. Silica beads are also
centrifuged in PBS-BSA solution at 10,000 rpm three times. The RBCs and beads are
mixed together and stored at 4°C for 1 h to allow for spontaneous and nonspecific adhesion of beads to RBCs. Prior to adding the RBC and bead solution into a test chamber, the coverslip is coated with BSA to prevent most adhesion between glass and the beads or
IThe laboratory of Prof. K. S. W. Tan in the Department of Microbiology, Faculty of Medicine, National University of Singapore
200
Z
150.e:
Q) ~ .E 100 Q) Q. ~ en ill 50o
o
500 Laser power (mW) 1000Figure 3-5: Force calibration plot showing the variation of trapping force with laser power for a 1.5 W diode pumped Nd:YAG laser source for a single optical trap system. Non-linear trends below 80 mW laser power are not used for extrapolation to higher laser powers.
RBCs. Some adhesion is necessary to achieve the test configuration illustrated in Figure 3-1. All experiments are completed within 1 h after RBCs are removed from storage at 4°C. Experiments are conducted when the correct test configuration (Fig. 3-1) is found. Correct bead arrangement can be confirmed by trapping the bead not attached to the slide. Because the optical trap is located above the slide surface and focal plane, a bead that is successfully trapped will appear out of focus, indicating that the bead is not adhered to the slide surface (see right bead in Fig. 3-1b). With this bead trapped, the stage can be translated to determine if the other bead (Fig. 3-1a) or part of the RBC membrane (Fig. 3-1b) is effectively adhered to the slide. Adherence to the slide is confirmed when the adhered bead or RBC membrane attachment point moves in a manner consistent with the stage and the RBC appears to be only in contact at the grip locations.
Uniaxial Tension Tests
A uniaxial tension test to determine the force-displacement response of a single RBC is performed by moving the coverslip relative to the trap to deform the cell. By stretching at different laser powers, corresponding to a range of calibrated escape forces, the force-displacement curve can be determined. All stretch tests are recorded digitally by a CCD
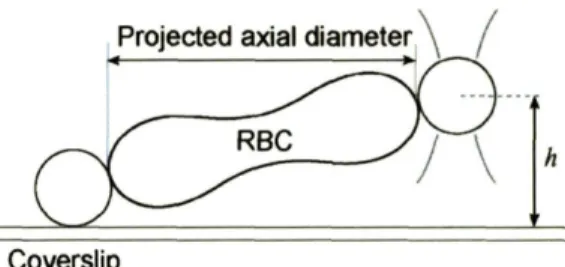
Projected axial diameter \
h
Coverslip
Figure 3-6: Optical images of stretch tests show the projected axial diameter because of a height difference between trapped and attached beads. With the trapped bead height known, the actual axial cell diameter can be calculated.
camera for image analysis of RBC deformation. For each stretch test, the axial diameter (in the direction of the uniaxial load) and transverse diameter (orthogonal to axial direction) of the cell are measured from the still-frame image when the trapped bead just escapes the trap. The calibration of laser power to escape force (Fig. 3-5) determines the force at this instant. From each point where the trapped bead escapes the trap, one data point on the force-displacement curve can be determined. Notice that the axial diameter is actually the projected axial diameter because of the height difference between the beads (Fig. 3-6). A correction factor for the actual axial diameter is made based on the known trapped bead
height. A representativeforc~isplacementcurve for a healthy RBC determined the escape
force method is plotted in Figure 3-7. The RBC membrane modulus is calculated from the forc~isplacementcurve as described in Section 3.3.
Tests conducted at physiological temperatures (at 3rC and 41°C) were achieved by
locally heating the test sample with resistive heaters. Optical tweezers tests were conducted at these temperatures after maintaining the test temperature for ten minutes. Two resistive heating pads attached to thin copper blocks were kept in thermal contact with the microslide to control the temperature at the sample. A thermocouple placed at the sample chamber was used to set and maintain the local local temperature to within ±l°C of the set temperature.
Viscoelastic Recovery Tests
Time dependent properties can be measured from the relaxation response of an RBC after the trapped bead escapes the trap. By measuring changes in axial and transverse
18 • Axial Diameter 16 <>Transverse Diameter
•
•
•
14•
•
•
12•
E•
.a
•
'- 10•
•
~
•
E 8 m l5 6 <><> <> <> <> <> <> 4 <> <> <> <> <> 2 0 0 50 100 150 200 Force (pN)Figure 3-7: A representative force-displacement curve is plotted for a healthy REC tested by the optical tweezers escape force method. The closed diamonds indicate the axial diameter and the open diamonds indicate the transverse diameter of the cell for increasing levels of applied uniaxial force.
diameters over time as the cell recovers its original shape, viscoelastic properties can be experimentally interrogated. Video images of the relaxation response of a stretched RBC upon release of trapping force post bead escape immediately after a uniaxial tension test can be used to infer the viscoelastic properties of the RBC membrane.
3.2.2
TrapStiffness Method
The trap stiffness rnethod optical tweezers instrurnent design, shown schematically in Fig-ure 3-8, was also developed for experiments involving healthy and parasitized RBCs and is described further in detail et al. [43]. The instrument incorporates an inverted microscope (Nikon TE200) equipped with lasers for trapping (10 W, IPG Photonics) and position detec-tion (970 nm, Avanex) that are collinearly guided into a 100x objective (1.40 NA, Nikon), which is based on a high-end optical trap instrument designed for single-molecule studies [44, 45]. The trapping laser path (red pathway in Fig. 3-8) passes through antireflection coated optics to minimize power losses before entering the objective. The trapping laser
S3
I----+-~"' FPSO
,/~=~:·0
Lamp
AOO
Piezo
Stage=========;~====:==Jo
Trap
Laser
Figure 3-8: A diagram of the optical layout for the trap stiffness method optical tweez-ers instrument is shown. The trapping laser (red) and detection laser (dotted orange) are collinearly guided into the objective (0). The AOD automates laser trap positioning. The PSD detects the detection laser signal for measuring bead position. Experiments are recorded onto a CCD camera. The piezo stage is used for fine control of positioning the sample. Not all components are shown. (S, shutter; PBS, polarizing beam splitters; D, dichroic mirror; W, wollaston; C, condenser; F, filter)
path is guided into the illumination path (green pathway) by a low pass dichroic mirror (D2). Along the path, the trapping laser passes through acousto-optic deflectors (AODs) which are used to steer the trap in two dimensions in the focal plane and to regulate trap power. Computer control of AODs enables automation of the trap location and intensity. The high laser power and minimization of power losses due to optical absorption and reflec-tion enable high forces to be achieved beyond the capabilities of the escape force method presented in Section 3.2.1. The laser-based position detection system incorporates a detec-tion laser and PSD. The detecdetec-tion laser path (dotted orange pathway in Fig. 3-8) is guided into the trapping laser path by a high-pass dichroic mirror (D 1). The signal of the detection laser is separated from the illumination pathway by another dichoic mirror (D3) and sepa-rated from the trapping laser signal by a filter (F). The detection laser path is ultimately focused onto a PSD, the signal being continuously acquired and used to determine the posi-tion of a trapped bead. Improved force calibraposi-tion is achieved by using a separate posiposi-tion detection laser capable of detecting a trapped bead with position resolution <5nm. The piezo stage (Physik Instrumente), which is also computer controlled, is used for making fine displacements (position resolution < 1nm) for RBC stretch tests. A CCD camera is used to image the specimen during experiments. Computer control of the AODs and piezo stage, along with acquisition of the PSD signal, adds automation to the instrument which was not available in previous RBC studies with optical tweezers [4, 28, 33, 41]. The particular advantages of this optical tweezers system are described here:
• High force capability: Forces up to and exceeding 600 pN can be achieved with the described set-up. This is roughly three times larger than the forces obtained by the escape force method described in Section 3.2.1 and in Mills et ai. [4], and roughly ten
times larger than forces reported in Henon et ai. [28] and Sleep et ai. [33]. The high
forces enable more of the nonlinear response of RBC in uniaxial tension to be studied.
• Increased force resolution: The scatter in forces calibrated by the present system compared to the escape force method described in Section 3.2.1 shows a reduction
from around 20% to less than 5%. The increased force resolution leads to more
accurate force-displacement data which, in turn, allows more subtle RBC membrane changes to be observed.
• Increased experimental throughput: The automation of experiments allows the force-displacement response and shear modulus measurement to be determined in
real-time. Using the escape force method (Sec. 3.2.1) requires significant amounts of
data analysis to extract the force-displacement curve. In addition, the continuous acquisition of force (via the laser-based position detection system) and displacements (via piezo stage control) permit a more continuous force-displacement curve to be obtained from a single RBC stretch test. In comparison, the escape force method requires multiple stretches to obtain discrete points that are used to construct the force-displacement curve.
• Study of time dependent properties: Automation and fine control over experimental parameters of force and displacement allow time-dependent property testing that was not possible with the escape force optical tweezers instrument. Tests involving stress relaxation, cyclic loading and strain-rate behavior are all easily implemented with the present optical tweezers trap stiffness instrulnent design.
The primary disadvantage of the trap stiffness is a significantly more complex optical layout compared to the escape force method.
Force calibration
Force calibration of the trap stiffness method optical tweezers instrument requires determination of the trap stiffness (reported in units of pNInm) that corresponds to the
slope of the applied force versus bead position plot within the linear region (Fig. 3-2). The bead displacement within the trap, measured by the position detection laser signal imaged on the PSD, is multiplied by the trap stiffness to continuously monitor the force exerted by the trap.
The trap stiffness is calculated by the Stokes' method, by moving the piezo stage at specified velocities and applying drag forces which can be calculated by Equations 3.1 and 3.2. The displacement of a trapped bead within the optical trap under an applied drag force is detected by the position detection signal. The slope of the bead position versus applied
40 , - - - , 35
Z
30 S: Q) 25e
.E 20 "'0 .~a.
15 ~ 10 5 o o o Data Linearfit o o o o o 20 40 Bead displacement (nm) o 60Figure 3-9: A force calibration by the trap stiffness method is plotted. Known drag forces are applied to a trapped bead by movement of the piezo stage at prescribed velocities. Forces are calculated by Stokes' law and appropriate corrections for wall effects (Faxen's law). The bead displacements within the trap are detected by the laser-based position detection system. The plot shows the linear relationship between applied force and trapped bead displacement for displacements close to the center of the trap. From the linear plot, the trap stiffness can be estimated. From this calibration, the trap stiffness is 0.73 pNjnm.
force yields the trap stiffness (Fig. 3-9)2. Tests were performed with an incident laser power entering the objective of 700 mW, which corresponded to a trap stiffness of 0.7 pN/nm for all 2 /-lm diameter beads with less than 5% error. Repeated force calibrations were performed before each set of experiments. Forces up to 350 pN were applied in force-displacement tests reported in Chapter 6.
With slight rnodifications to the present instflnncnt, a variety of other stress states,
other than simple uniaxial tension, are feasible. The ADDs can be used to time share
multiple traps or separate traps can be split off from the main trap pathway. Multiple traps can be used to optically trap multiple beads located on the membrane of an RBC and impose more complex states of stress (e.g. biaxial, shear loading).
Specimen preparation
For trap stiffness method tests, the following procedure is used. Fresh whole blood
was obtained from a local source (Research Blood Components, Inc.). P. falciparum
para-sitized RBCs were cultured as described in detail in Chapter 6. Blood was centrifuged at 1,000 rpm in RPMI three times to wash and isolate RBCs. After the last centrifugation, the RBCs are suspended in PBS-BSA (0.1 mg/ml).
Polystyrene beads (2 /-lm diameter, streptavidin coated, Polysciences) were used
In the trap stiffness method optical tweezers experiments. The index of refraction of
polystyrene generates larger forces for a given laser power compared to silica. Also, the smaller bead diameter, 2 /-lm, used here compared to the 4 /-lm diameter beads used with the escape force method yield a smaller contact area with the RBC membrane that cor-responds to more sensitive modulus measurement based on finite element simulations [25]. Polystyrene beads are coated with Concanavalin A (ConA, Sigma) to facilitate specific bind-ing to the RBC membrane. Beads are first centrifuged three times in PBS-BSA at 10,000 rpm. ConA is added and the suspension is incubated at 4°C for 0.5 h. After, coated beads were centrifuged three more times in PBS-BSA at 10,000 rpm.
2The linear region extends up to 500 nm from the equilibrium trapped bead location under no applied forces.

![Figure 2-4: The P. falciparum parasite life-cycle. Illustration from Miller [2].](https://thumb-eu.123doks.com/thumbv2/123doknet/14673155.557282/32.918.152.792.130.509/figure-p-falciparum-parasite-life-cycle-illustration-miller.webp)
![Figure 3-4: Calibration of the optical trap using an escape force method [3]. A silica bead, 4.12 /-lm in diameter, is trapped in fluid (PBS and bovine serum albumin, BSA) at a measured height, h = 311m, above the slide surface](https://thumb-eu.123doks.com/thumbv2/123doknet/14673155.557282/40.918.186.776.140.349/figure-calibration-optical-diameter-trapped-albumin-measured-surface.webp)